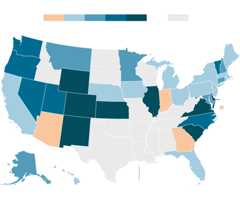
Estimated change in abortions
-20
0
+20
+30
+60%
No estimate
Wash.
Maine
Mont.
N.D.
Vt.
Ore.
Minn.
N.H.
Idaho
S.D.
N.Y.
Mass.
Wis.
Mich.
Conn.
Wyo.
R.I.
Pa.
Iowa
N.J.
Neb.
Nev.
Ohio
Ind.
Md.
Del.
Ill.
Utah
W.Va.
Colo.
D.C.
Calif.
Va.
Kan.
Mo.
Ky.
N.C.
Tenn.
Okla.
Ariz.
Ark.
S.C.
N.M.
Ga.
Miss.
Ala.
Texas
La.
Alaska
Fla.
Hawaii
States in gray
banned all abortions.
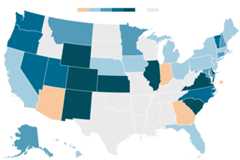
Estimated change in abortions
-20
0
+20
+30
+60%
No estimate
Wash.
Maine
Mont.
N.D.
Vt.
Ore.
Minn.
N.H.
Idaho
N.Y.
S.D.
Mass.
Wis.
R.I.
Conn.
Mich.
Wyo.
Pa.
Iowa
N.J.
Neb.
Nev.
Ohio
Md.
Del.
Ind.
Ill.
Utah
W.Va.
Colo.
Va.
Calif.
D.C.
Kan.
Mo.
Ky.
N.C.
Tenn.
Okla.
Ariz.
Ark.
S.C.
N.M.
Ga.
Miss.
Ala.
Texas
La.
Alaska
Fla.
States in gray banned all abortions.
Hawaii
Source: Guttmacher Institute
Note: Data compares January to June 2023 with a six-month period in 2020.
Abortions Rose in Most States This Year, New Data Shows
Legal abortions most likely increased in the United States in the first six months of the year compared with 2020, an analysis of new estimates shows, as states with more permissive abortion laws absorbed patients traveling from those with bans and access to abortion pills via telemedicine continued to expand.
New research from the Guttmacher Institute offers the latest view of legal abortions since the Supreme Court’sDobbs decision last year upended access to abortion nationwide and allowed more than a dozen states to ban or restrict the procedure.
The data suggests that thousands of women have crossed state lines to obtain an abortion, in the face of restrictions at home. It also indicates a rise in abortions among those living in states where the procedure is legal.
“You have two forces at work,” said Caitlin Myers, an economist at Middlebury College, who reviewed the Guttmacher report. “On the one hand, you have people trapped in ban states, and, on the other, you have people in a whole lot of the country where access has improved.”

Around465,000 abortions were recorded across 50 states and Washington, D.C.,
in six months of 2020.
Texas
29,015
Ill.
26,390
N.J.
24,415
Calif.
77,030
Ga.
Pa.
N.C.
Va.
Wash.
Mass.
Mich.
N.Y.
55,180
Colo.
Nev.
Tenn.
Okla.
Ind.
La.
Wis.
D.C.
Ariz.
Md.
Ore.
Conn.
Fla.
38,700
Ohio
Kan.
Minn.
Around511,000 abortions were estimated across 36 states and Washington, D.C., in the first six months of 2023.
Fla.
43,650
N.J.
27,690
Calif.
89,330
N.C.
Md.
Pa.
Colo.
Wash.
Ohio
Mich.
N.Y.
65,130
Nev.
Mass.
Conn.
Minn.
Ga.
S.C.
D.C.
Ind.
N.M.
Ill.
44,690
Ore.
Va.
Kan.
Ariz.
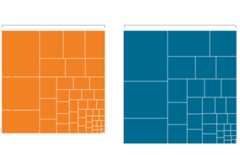
Around511,000 abortions were estimated
across 36 states and Washington, D.C.,
in the first six months of 2023.
Around465,000 abortions were recorded
across 50 states and Washington, D.C.,
in six months of 2020.
Fla.
43,650
N.J.
27,690
Texas
29,015
Ill.
26,390
N.J.
24,415
Calif.
77,030
Calif.
89,330
N.C.
Md.
Pa.
Ga.
Pa.
N.C.
Va.
Wash.
Mass.
Mich.
Colo.
Wash.
Ohio
Mich.
N.Y.
55,180
Nev.
Tenn.
Colo.
Okla.
N.Y.
65,130
Ind.
Wis.
La.
Conn.
Minn.
Mass.
Nev.
D.C.
Ariz.
Md.
Ga.
Ore.
Conn.
Fla.
38,700
S.C.
D.C.
Ind.
N.M.
Ohio
Kan.
Minn.
Ill.
44,690
Ore.
Va.
Kan.
Ariz.
Source: Guttmacher Institute
Notes: Data compares January to June 2023 with a six-month period in 2020. No estimates were provided for 2023 for 14 states that banned abortion.
Altogether, about 511,000 abortions were estimated to have occurred in areas where the procedure was legal in the first six months of 2023, a review of Guttmacher’s data shows, compared with about465,000abortions nationwide in a six-month period of 2020.
Abortions rose in nearly every state where the procedure remains legal, but the change was most visible in states bordering those with total abortion bans. Many of these states loosenedabortion laws, and providersopened new clinics to serve patients coming from elsewhere. In Illinois, for example, where abortion is legal, abortions rose an estimated 69 percent in 2023 compared with the same period in 2020, to about 45,000 from 26,000.
Other states with restrictive neighbors, like Colorado, Kansas, New Mexico and South Carolina, also had jumps in estimated counts of abortions.
Arizona, Georgia and Indiana, by contrast, sought to restrict abortion, and all three states had drops in their estimates. Arizona and Georgia have gestational limits on the procedure, and Indianarecently enacted a total ban.
Researchers emphasized that the rise in abortions so far in 2023 does not mean that state bans have had no impact on access.
“Travel doesn’t come without a cost,” said Isaac Maddow-Zimet, a data scientist at the Guttmacher Institute and the lead researcher on the institute’s report. “Just because someone isn’t denied an abortion doesn’t mean it was an easy experience. And we know that some can’t leave their state.”
There are no estimates yet of women who were denied abortions or those who were unable to get them. The increases in most states may also mask the number of abortions prevented by the bans.
“Abortions had begun rising in advance of Dobbs, and they may have continued to rise even more steeply than observed if it weren’t for the bans,” Dr. Myers said.
The Guttmacher Institute’s report is based on a survey of physical abortion clinics and telehealth and virtual providers. The institute, which supports abortion rights, does not contact all clinics in each state but relies on a sample to estimate the number of abortions.
The report excludes abortions obtained outside of the formal health care system, through, for example, pills mailed into states with bans from other countries or states where abortion is legal. Otherdata suggests that thousands of people, especially those living in states with bans, haveordered abortion pills online from overseas.
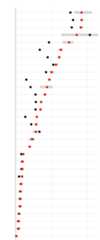
Populous states like California, Florida, Illinois and New York had the most abortions. Because the researchers relied on a statistical model, they reported a range of uncertainty in their counts, and there was more uncertainty in states with more abortion providers. Data was not collected from the 14 states with abortion bans in effect in the first part of the year.
Range of estimates of abortions by state
Charts compare the 2020 count of abortions in each state (black dot) with the range of estimates for 2023 (gray bar) and the median estimate (red dot).
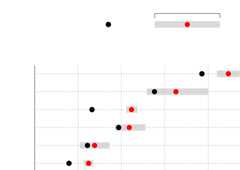
Range of 2023 estimates
2020 count
Low
Median
High
20,000
40,000
60,000