A CANDLE for a deeper in vivo insight
- PMID:22341767
- PMCID: PMC3403005
- DOI: 10.1016/j.media.2012.01.002
A CANDLE for a deeper in vivo insight
Abstract
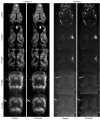
A new Collaborative Approach for eNhanced Denoising under Low-light Excitation (CANDLE) is introduced for the processing of 3D laser scanning multiphoton microscopy images. CANDLE is designed to be robust for low signal-to-noise ratio (SNR) conditions typically encountered when imaging deep in scattering biological specimens. Based on an optimized non-local means filter involving the comparison of filtered patches, CANDLE locally adapts the amount of smoothing in order to deal with the noise inhomogeneity inherent to laser scanning fluorescence microscopy images. An extensive validation on synthetic data, images acquired on microspheres and in vivo images is presented. These experiments show that the CANDLE filter obtained competitive results compared to a state-of-the-art method and a locally adaptive optimized non-local means filter, especially under low SNR conditions (PSNR<8dB). Finally, the deeper imaging capabilities enabled by the proposed filter are demonstrated on deep tissue in vivo images of neurons and fine axonal processes in the Xenopus tadpole brain.
Copyright © 2012 Elsevier B.V. All rights reserved.
Figures


Similar articles
- Image heterogeneity correction in large-area, three-dimensional multiphoton microscopy.Hovhannisyan VA, Su PJ, Chen YF, Dong CY.Hovhannisyan VA, et al.Opt Express. 2008 Mar 31;16(7):5107-17. doi: 10.1364/oe.16.005107.Opt Express. 2008.PMID:18542610
- On the fundamental imaging-depth limit in two-photon microscopy.Theer P, Denk W.Theer P, et al.J Opt Soc Am A Opt Image Sci Vis. 2006 Dec;23(12):3139-49. doi: 10.1364/josaa.23.003139.J Opt Soc Am A Opt Image Sci Vis. 2006.PMID:17106469
- Images of finite sized spherical particles in confocal and conventional microscopes when illuminated with arbitrary polarization.Alali S, Massoumian F.Alali S, et al.Appl Opt. 2008 Jan 20;47(3):453-8. doi: 10.1364/ao.47.000453.Appl Opt. 2008.PMID:18204733
- Enhanced weak-signal sensitivity in two-photon microscopy by adaptive illumination.Chu KK, Lim D, Mertz J.Chu KK, et al.Opt Lett. 2007 Oct 1;32(19):2846-8. doi: 10.1364/ol.32.002846.Opt Lett. 2007.PMID:17909593
- Multiphoton fluorescence lifetime contrast in deep tissue imaging: prospects in redox imaging and disease diagnosis.Ramanujan VK, Zhang JH, Biener E, Herman B.Ramanujan VK, et al.J Biomed Opt. 2005 Sep-Oct;10(5):051407. doi: 10.1117/1.2098753.J Biomed Opt. 2005.PMID:16292944Review.
Cited by
- A Simple and Efficient Method for Visualizing Individual Cellsin vivo by Cre-Mediated Single-Cell Labeling by Electroporation (CREMSCLE).Schohl A, Chorghay Z, Ruthazer ES.Schohl A, et al.Front Neural Circuits. 2020 Jul 28;14:47. doi: 10.3389/fncir.2020.00047. eCollection 2020.Front Neural Circuits. 2020.PMID:32848634Free PMC article.
- An assay to image neuronal microtubule dynamics in mice.Kleele T, Marinković P, Williams PR, Stern S, Weigand EE, Engerer P, Naumann R, Hartmann J, Karl RM, Bradke F, Bishop D, Herms J, Konnerth A, Kerschensteiner M, Godinho L, Misgeld T.Kleele T, et al.Nat Commun. 2014 Sep 12;5:4827. doi: 10.1038/ncomms5827.Nat Commun. 2014.PMID:25219969Free PMC article.
- An AMPK phosphoregulated RhoGEF feedback loop tunes cortical flow-driven amoeboid migration in vivo.Lin B, Luo J, Lehmann R.Lin B, et al.Sci Adv. 2022 Sep 16;8(37):eabo0323. doi: 10.1126/sciadv.abo0323. Epub 2022 Sep 14.Sci Adv. 2022.PMID:36103538Free PMC article.
- A projection specific logic to sampling visual inputs in mouse superior colliculus.Reinhard K, Li C, Do Q, Burke EG, Heynderickx S, Farrow K.Reinhard K, et al.Elife. 2019 Nov 21;8:e50697. doi: 10.7554/eLife.50697.Elife. 2019.PMID:31750831Free PMC article.
- An adaptation of astronomical image processing enables characterization and functional 3D mapping of individual sites of excitation-contraction coupling in rat cardiac muscle.Tian Q, Kaestner L, Schröder L, Guo J, Lipp P.Tian Q, et al.Elife. 2017 Nov 14;6:e30425. doi: 10.7554/eLife.30425.Elife. 2017.PMID:29135437Free PMC article.
References
- Anscombe FJ. The Transformation of Poisson, Binomial and Negative-Binomial Data. Biometrika. 1948;35:246–254.
- Arce GR. Nonlinear signal processing: a statistical approach. Wiley; Hoboken; Chichester: 2005.
- Baker M. Seeing more with less. Nat Methods. 2010;7:782. - PubMed
- Boulanger J, Kervrann C, Bouthemy P, Elbau P, Sibarita JB, Salamero J. Patch-based nonlocal functional for denoising fluorescence microscopy image sequences. IEEE Trans Med Imaging. 2010;29:442–454. - PubMed
- Broser PJ, Schulte R, Roth A, Helmehen F, Waters J, Lang S, Sakmann B, Wittum G. Nonlinear anisotropic diffusion filtering of three-dimensional image data from 2-photon microscopy. Image Processing: Algorithms and Systems IV. 2005;5672:44–69. - PubMed
