


When New York City was the COVID-19 pandemic epicenter: The impact on trauma care
Anna Liveris,MD
Melvin E Stone Jr,MD
Harley Markel,MD
George Agriantonis,MD
Marko Bukur,MD
Sherry Melton,MD
Valery Roudnitsky,MD
Edward Chao,MD
Srinivas H Reddy,MD
Sheldon H Teperman,MD
James A Meltzer,MD, MS
Address for reprints: Anna Liveris, MD, Jacobi Medical Center, Albert Einstein College of Medicine, 1400 Pelham Parkway S, Bronx, NY 10461; email:anna.liveris@nychhc.org.
Received 2021 Aug 23; Revised 2021 Oct 30; Accepted 2021 Nov 1; Issue date 2022 Aug.
This article is made available via the PMC Open Access Subset for unrestricted re-use and analyses in any form or by any means with acknowledgement of the original source. These permissions are granted for the duration of the COVID-19 pandemic or until permissions are revoked in writing. Upon expiration of these permissions, PMC is granted a perpetual license to make this article available via PMC and Europe PMC, consistent with existing copyright protections.
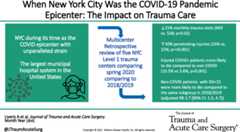
A large multicenter study shows an increased mortality risk to trauma patients during a time when NYC was considered the epicenter for COVID-19. Non-COVID patients with ISS<15 were more likely to die compared to the same subgroup in 2018/2019.
KEY WORDS: COVID-19, trauma, resources, violence
BACKGROUND
During early spring 2020, New York City (NYC) rapidly became the first US epicenter of the COVID-19 pandemic. With an unparalleled strain on health care resources, we sought to investigate the impact of the pandemic on trauma visits and mortality in the United States' largest municipal hospital system.
METHODS
We conducted a retrospective multicenter cohort study of the five level 1 trauma centers in NYC's public health care system, New York City's Health and Hospitals Corporation. Clinical characteristics, mechanism of injury, and mortality of trauma patients presenting during the early pandemic (March 1, 2020, to May 31, 2020) were compared with a similar period in the previous 2 years. To account for important patient and hospital-level confounding variables, we created a propensity score for treatment and applied inverse probability weighting.
RESULTS
In March to May 2020, there was a 25% decrease in median number of monthly trauma visits (693 vs. 528;p = 0.02) but a 50% increase (15% vs. 22%;p = <0.001) in patients presenting for penetrating injuries, compared with the same period for 2018 and 2019. Injured patients with COVID were significantly more likely to die compared with those without COVID-19 (10.5% vs. 3.6%;p < 0.001). Overall, there was no significant difference in mortality for non–COVID-injured New Yorkers cared for in 2020 compared with 2018 and 2019. Less severely injured non-COVID patients (Injury Severity Score, <15), however, were significantly more likely to die compared with this same subgroup in 2018 and 2019 (adjusted relative risk, 2.7 [95% confidence interval, 1.5–4.7]).
CONCLUSION
Despite a decline in overall trauma visits during the early part of the COVID pandemic in NYC, there was a significant increase in the proportion of penetrating mechanisms. Less-injured non-COVID patients experienced an increase in mortality in the early pandemic, possibly from a depletion of human and hospital resources from the large influx of COVID patients. These data lend support to the safeguarding of trauma system resources in the event of a future pandemic.
LEVEL OF EVIDENCE
Prognostic and Epidemiologic; Level III.
In the final days of 2019, the novel severe acute respiratory syndrome coronavirus 2 (SARS-CoV-2) virus emerged out of Wuhan, China and rapidly reached every corner of the globe.1 During the early spring of 2020, New York City (NYC) became the US epicenter for COVID-19 with the first confirmed case in the city reported on February 29, 2020.2,3 By the time the World Health Organization declared COVID-19 a worldwide pandemic about a week later, NYC already had more than 200 reported COVID-19 cases and several related deaths.4,5 More than 200,000 laboratory-confirmed cases were reported in NYC within the short 2-month period that followed, more than any other city in the world.2 To mitigate the spread of the virus, the New York State Governor's office issued the “New York State on PAUSE” executive order on March 22, 2020. Similar to other states and countries, this “stay-at-home” mandate ordered the closure of all nonessential businesses and enacted social distancing.6 This mandate remained in place until June 8, 2020, when the State and City governments agreed to begin stepwise reopening of NYC.7,8
New York City's Health and Hospitals Corporation (NYC H + H) is the largest municipal health care system in the United States and serves as the safety net for more than 1 million patients every year.9 New York City's Health and Hospitals Corporation's trauma system consists of five distinct and functionally independent American College of Surgeons (ACS)–verified level 1 trauma centers (Supplemental Digital Content, Supplementary Fig. 1,http://links.lww.com/TA/C194) spread across four of the City's five boroughs (Bronx, Queens, Manhattan, and Brooklyn) with coordinated leadership.
There have been several published studies describing the impact of the COVID pandemic on trauma care. These studies are primarily single center experiences and have been arguably deficient in certain details such as mortality and the direct effect of COVID infection on the patient cohort.10–12 The NYC experience, however, provides a unique perspective on how the COVID pandemic affected a regional multicenter trauma system, in particular, early in the pandemic and as the first US epicenter when little was known on how to treat or mitigate COVID-related mortality and complications.
The purpose of this study is to examine how the peak of the COVID-19 pandemic affected NYC's municipal trauma system. During the NYC spring 2020 lockdown, the assumption was that there were less people outside of their homes and, therefore, less opportunity for serious injury. We hypothesized that trauma visits and, subsequently, the trauma mortality rate would decrease overall during the early stages of the pandemic as compared with previous years in the same period.
PATIENTS AND METHODS
Study Design, Setting, and Patients
We conducted a retrospective multicenter cohort study of NYC's public health care system, NYC H + H. This study followed the Strengthening the Reporting of Observational Studies in Epidemiology reporting guideline. Following institutional review board approval, we abstracted data for all patients injured between January 1 and May 31 for the years 2018, 2019, and 2020. To simplify our analyses, we considered the months January and February 2020 asprepandemic and March through May 2020 asearly pandemic. First, we compared the two periods before the pandemic (January to February 2018 and 2019 vs. January to February 2020) to evaluate trends that were independent of the pandemic. Next, we compared the early pandemic months to that of the 2 years prior (March to May 2018 and 2019 vs. March to May 2020).
Data were abstracted from each center's trauma registry, maintained as part of the requirements for ACS level 1 verification. As part of their collaboration with the National Trauma Registry of the American College of Surgeons, data are collected uniformly across all centers using preestablished variables and definitions. In addition, we queried the electronic medical record to obtain a list of patients in the study who had COVID-19 testing performed. We then reviewed the records of each of these patients to determine the COVID-19 test result. Patients were considered positive for COVID-19 if the patient's record had a positive COVID-19 antigen test or a positive polymerase chain reaction test during the index hospital visit, or any of the followingInternational Classification of Diseases, Tenth Revision, diagnosis codes: U07.1 (COVID-19, confirmed) and Z20.828 (COVID-19, suspected).
Outcomes
The primary outcome was in-hospital mortality. Secondary outcomes included need for thoracotomy, need for laparotomy, hospital length of stay (LOS), and intensive care unit (ICU) LOS. We also examined the number of patients transferred out of each trauma center and the number of patients discharged to rehabilitation facilities.
Covariates
We examined the following variables as potential confounders: age, sex, race, ethnicity, injury type, transfer into the hospital, hypoxia, hypotension, Glasgow Coma Scale (GCS), thoracostomy tube status, endotracheal intubation, need for blood transfusion (packed red blood cells), and Injury Severity Score (ISS). Hypoxia was defined as an initial pulse oximetry of <94%. Hypotension was defined as an initial systolic blood pressure below 90 mm Hg for patients 10 years or older, or 70 mm Hg + (2 × age in years) for patients younger than 10 years.13,14 We dichotomized the covariate GCS at 9 and ISS at 15, two clinically important cut points, because they did not satisfy the logistic regression model assumption of linearity.
Statistical Analyses
Continuous variables were described using medians and interquartile ranges and compared between groups using a Mann-Whitney test. Categorical variables were described using frequencies and percentages and compared between groups using a χ2 test or a Fisher's exact test, where appropriate. All tests were two-tailed, and ap value of <0.05 was considered statistically significant. All analyses were performed using Stata, version 15.1 (StataCorp, College Station, TX).
We compared the risk of mortality in early pandemic months (March, April, and May 2020) to the same period in the prior years (March, April, and May 2018 and 2019). To account for potential confounding in the association of the early pandemic and mortality, we created a propensity score for each patient and applied inverse probability weighting. The propensity score for each patient was determined using a logistic regression model with the period as the dependent variable and all the aforementioned covariates as independent variables. The propensity score was then used to create inverse probability weights for each patient. Using these weights, a more balanced sample was thus created with respect to these covariates.
Before examining the outcome, we confirmed that each covariate was adequately balanced in the propensity-weighted sample using the following parameters: standardized difference, −0.15 to 0.15, and variance ratio, 0.5 to 2.0.15 We verified that the area of common support was sufficient using overlap plots. To account for missing data, we used a missing indicator approach by creating a separate missing category for those categorical variables with missing values. Thus, the propensity score sought to balance the distribution of both observed or available values and missing values among the treatment groups.16
Outcomes and Subgroup Analyses
For the primary outcome of in-hospital death, we calculated the propensity-weighted absolute risk difference and the relative risk between periods. To determine if a certain subgroup of patients was particularly affected, we performed additional analyses based on ISS, injury type, mechanism, and age. To examine whether any change in the overall mortality rate was due to an increase in patient medical problems due to the pandemic, we performed additional secondary analyses incorporating patient comorbidities and complications (Supplemental Digital Content, Supplementary Fig. 2,http://links.lww.com/TA/C195).
Sensitivity Analysis
Considering that patients with COVID-19 may be at a higher risk of dying from COVID-19, we performed an additional sensitivity analysis for the primary outcome by excluding all COVID-19 patients.
RESULTS
A total of 9,196 injured patients were cared for at NYC H + H's five level 1 trauma centers during the study periods for 2018, 2019, and 2020. Compared with January and February 2018 and 2019, there was no significant difference in median number of trauma visits per month in January and February 2020. There was, however, a significant decrease in median number of trauma visits, by approximately 25%, in the early pandemic period of March through May 2020 as compared with the same time frame in 2018 and 2019 (Table1).
TABLE 1.
Characteristics of Injured Patients, Before and During COVID-19 Pandemic, NYC Trauma Centers 2018 to 2020
| Overall (N = 9,196) | Jan/Feb 2018–2019 (n = 2,361) | Jan/Feb 2020 (n = 1247) | p | Mar/Apr/May 2018–2019 (n = 4,140) | Mar/Apr/May 2020 (n = 1,448) | p | |
|---|---|---|---|---|---|---|---|
| Cases per mo, median | 631 | 609 | 624 | 0.64 | 693 | 528 | 0.02 |
| Age, median (IQR), y | |||||||
| Overall | 46 (29–67) | 50 (31–70) | 48 (30–69) | 0.07 | 44 (27–65) | 44 (29–64) | 0.34 |
| ≥18 | 50 (32–69) | 53 (34–72) | 51 (34–71) | 0.26 | 49 (32–68) | 47 (32–67) | 0.46 |
| <18 | 12 (5–16) | 13 (6–16) | 11 (4–15) | 0.22 | 12 (6–16) | 12 (5–16) | 0.79 |
| Male | 6,344 (69) | 1,545 (65) | 840 (67) | 0.25 | 2,887 (70) | 1,072 (74) | 0.002 |
| Race | |||||||
| White | 1,577 (17) | 446 (19) | 224 (18) | 681 (17) | 226 (16) | 0.13 | |
| Black | 2,699 (29) | 665 (28) | 354 (28) | 0.88 | 1,210 (29) | 470 (32) | |
| Asian | 451 (5) | 132 (6) | 75 (6) | 179 (4) | 65 (5) | ||
| Other | 4,469 (49) | 1,118 (47) | 594 (48) | 2,070 (50) | 687 (47) | ||
| Ethnicity | |||||||
| Non-Hispanic | 4,630 (50) | 1,220 (52) | 650 (52) | 0.34 | 2,065 (50) | 695 (48) | <0.001 |
| Hispanic | 2,665 (29) | 687 (29) | 338 (27) | 1,255 (30) | 385 (27) | ||
| Unknown | 1,901 (21) | 454 (19) | 259 (21) | 820 (20) | 368 (25) | ||
| Injury type | |||||||
| Blunt | 7,663 (83) | 2,001 (85) | 1,060 (85) | 0.79 | 3,478 (84) | 1,124 (78) | <0.001 |
| Penetrating | 1,424 (15) | 327 (14) | 173 (14) | 611 (15) | 313 (22) | ||
| Burn | 109 (1) | 33 (1) | 14 (1) | 51 (1) | 11 (1) | ||
| Mechanism | |||||||
| Cut/pierce | 1,095 (12) | 250 (11) | 149 (12) | <0.00 | 472 (11) | 224 (15) | <0.001 |
| Fall-ground level | 3,064 (33) | 857 (36) | 453 (36) | 1,300 (31) | 454 (31) | ||
| Fall from height | 1,184 (13) | 292 (12) | 164 (13) | 1 | 555 (13) | 173 (12) | |
| Burn | 96 (1) | 26 (1) | 14 (1) | 45 (1) | 11 (1) | ||
| GSW | 371 (4) | 90 (4) | 39 (3) | 144 (3) | 98 (7) | ||
| MVA—occupant | 450 (5) | 97 (4) | 69 (6) | 210 (5) | 74 (5) | ||
| MVA—motorcycle | 169 (2) | 15 (1) | 20 (2) | 79 (2) | 55 (4) | ||
| MVA—pedestrian | 553 (6) | 178 (8) | 91 (7) | 227 (5) | 57 (4) | ||
| MVA—other | 203 (2) | 56 (2) | 13 (1) | 105 (3) | 29 (2) | ||
| Assault | 1,010 (11) | 220 (9) | 127 (10) | 518 (13) | 145 (10) | ||
| Other | 1,001 (11) | 280 (12) | 108 (9) | 485 (12) | 128 (9) | ||
| Transferred in hypoxia <94% | 926 (10) | 222 (9) | 133 (11) | 0.24 | 395 (10) | 176 (12) | 0.006 |
| No | 8,359 (91) | 2,153 (91) | 1,123 (90) | 0.53 | 3,773 (91) | 1,310 (90) | 0.04 |
| Yes | 454 (5) | 113 (5) | 67 (5) | 187 (5) | 87 (6) | ||
| Missing | 383 (4) | 95 (4) | 57 (5) | 180 (4) | 51 (4) | ||
| Hypotensive | |||||||
| No | 8,549 (93) | 2,208 (94) | 1,138 (91) | 0.03 | 3,868 (93) | 1,335 (92) | 0.001 |
| Yes | 278 (3) | 60 (3) | 49 (4) | 105 (3) | 64 (4) | ||
| Missing | 369 (4) | 93 (4) | 60 (5) | 167 (4) | 49 (3) | ||
| GCS | |||||||
| <9 | 476 (5) | 112 (5) | 71 (6) | 0.08 | 210 (5) | 83 (6) | 0.28 |
| ≥9 | 8,650 (94) | 2,242 (95) | 1,167 (94) | 3,894 (94) | 1,347 (93) | ||
| Missing | 70 (1) | 7 (0) | 9 (1) | 36 (1) | 18 (1) | ||
| Chest tube placed | 332 (4) | 96 (4) | 41 (3) | 0.27 | 136 (3) | 59 (4) | 0.16 |
| Intubated | 548 (6) | 133 (6) | 70 (6) | 1.00 | 243 (6) | 102 (7) | 0.11 |
| Received PRBC | 440 (5) | 97 (4) | 62 (5) | 0.23 | 203 (5) | 78 (5) | 0.47 |
| ISS | |||||||
| <15 | 7,848 (85) | 2,022 (86) | 1,069 (86) | <0.00 | 3,531 (85) | 1,226 (85) | 0.76 |
| ≥15 | 1,106 (12) | 303 (13) | 128 (10) | 497 (12) | 178 (12) | ||
| Missing | 242 (3) | 36 (2) | 50 (4) | 112 (3) | 44 (3) |
All data represent frequency (percentage) unless otherwise indicated.
COVID-19 pandemic affected NYC beginning March 2020.
GSW, gunshot wound; IQR, interquartile range; MVA, motor vehicle accident; PRBC, packed red blood cells.
Patients presenting to our trauma centers were similar in most regards before and after the beginning of the COVID19 pandemic. There were several small statistically significant differences; many of which were not clinically important (Table1). The age, race, and ethnicity of patients were similar for all periods examined. Moreover, patients were not substantially more severely injured in the early pandemic compared with prior years, as there were no important differences in hypoxia, hypotension, GCS, need for thoracostomy tube, endotracheal intubation, and need for blood transfusion. In addition, the ISS was similar across all periods.
Compared with prior years, however, patients presenting for penetrating injuries increased significantly by approximately 50% in the early pandemic period (15% in March to May 2018 and 2019 vs. 22% in March to May 2020). Table1 shows the breakdown by specific mechanism. The cut/pierce and gunshot wound mechanisms represented 15% and 7% of injuries during the early pandemic period of March to May 2020, respectively. In all other periods analyzed, these mechanisms represented about 11% and 3% of injuries, respectively.
The pandemic brought some important changes to our trauma centers (Table2). While there were no substantial differences in the thoracotomy or laparotomy rates, or the hospital and ICU LOS, there were significantly fewer patients transferred out and less patients discharged to rehabilitation facilities in March to May 2020 compared with the 2 years prior. Of note, in the years before the pandemic, the in-hospital overall mortality for trauma patients was 2.6%. During the early pandemic period in the spring of 2020, however, the in-hospital morality rate increased significantly by doubling to 5.3% (Table2).
TABLE 2.
Unadjusted Primary and Secondary Outcomes for Injured Patients, Before and During COVID-19 Pandemic, NYC Trauma Centers 2018 to 2020
| Outcome | Overall (N = 9,196) | Jan/Feb 2018–2019 (n = 2,361) | Jan/Feb 2020 (n = 1,247) | p | Mar/Apr/May 2018–2019 (n = 4,140) | Mar/Apr/May 2020 (n = 1,448) | p |
|---|---|---|---|---|---|---|---|
| Died | 302 (3) | 72 (3.1) | 45 (3.6) | 0.37 | 109 (2.6) | 76 (5.3) | <0.001 |
| Thoracotomy | 48 (1) | 12 (1) | 5 (0) | 0.65 | 23 (1) | 8 (1) | 0.99 |
| Laparotomy | 194 (2) | 47 (2) | 30 (2) | 0.41 | 80 (2) | 37 (3) | 0.15 |
| Hospital LOS, median (IQR), d | 3 (1–7) | 3 (1–7) | 2 (1–7) | 0.004 | 3 (1,7) | 2 (1,5) | <0.001 |
| ICU LOS, median (IQR), d | 3 (1–6) | 3 (1–6) | 3 (1–5) | 0.47 | 3 (1–6) | 2 (1–5) | 0.08 |
| Transferred out | 291 (3) | 65 (3) | 39 (3) | 0.52 | 112 (3) | 75 (5) | <0.001 |
| Discharged to rehab | 1,510 (16) | 423 (18) | 209 (17) | 0.39 | 683 (17) | 195 (13) | 0.006 |
All data represent frequency (percentage) unless otherwise specified.
COVID-19 pandemic affected NYC beginning March 2020.
IQR, interquartile range; rehab, rehabilitation facility.
To account for potential confounding in the association of the pandemic and mortality, we performed inverse probability weighting using the propensity score for treatment and compared patients treated in March to May 2018 and 2019 to those in March to May 2020. Before propensity weighting, standardized differences and variance ratios for the baseline covariates ranged from −0.08 to 0.18 and 0.6 to 1.7, respectively. After propensity score weighting, differences observed for the baseline covariates that were evident prior in the sample were no longer present. Moreover, after propensity weighting, standardized differences and variance ratios for the baseline covariates were much improved and within the recommended limits, ranging from −0.01 to 0.02 and 1.0 to 1.1, respectively.
Table3 demonstrates the mortality risk for injured patients in the early pandemic months compared with prior years after adjusting for important confounders using propensity score weighting. Here, we note that, although there was a significant difference in mortality overall (prepandemic: 79 [2.8%] vs. early pandemic: 127 [4.6%];p = 001), once the 353 patients with COVID-19 were excluded from the analysis, the mortality difference overall was attenuated and no longer statistically significant (prepandemic: 69 [2.6%] vs. early pandemic: 88 [3.3%];p = 0.17). In the early pandemic months, the unadjusted mortality risk was significantly higher for injured patients with COVID-19 (37 [10.5%]) compared with those without COVID-19 (39 [3.6%];p < 0.001).
TABLE 3.
Propensity-Weighted Mortality Risk for Early Pandemic Months Compared With Previous Years—Overall and by Subgroup
| Excluding COVID-19 Patients | ||||||||||
|---|---|---|---|---|---|---|---|---|---|---|
| Mortality | n | Mar/Apr/May | Absolute Risk Difference (95% CI) | Relative Risk (95% CI) | n | Mar/Apr/May | Absolute Risk Difference (95% CI) | Relative Risk (95% CI) | ||
| 2018/2019 | 2020 | 2018/2019 | 2020 | |||||||
| Overall | 5,588 | 79 (2.8) | 127 (4.6) | 1.7 (0.7–2.7) | 1.6 (1.2–2.1) | 5,235 | 69 (2.6) | 88 (3.3) | 0.7 (−0.3 to 1.8) | 1.3 (0.9–1.8) |
| Severity | ||||||||||
| ISS <15 | 4,757 | 20 (0.9) | 69 (2.9) | 2.0 (1.2–2.9) | 3.4 (2.1–5.4) | 4,476 | 17 (0.8) | 45 (2.0) | 1.2 (0.3–2.1) | 2.7 (1.5–4.7) |
| ISS ≥15 | 675 | 52 (15.5) | 48 (14.2) | −1.2 (−6.6 to 4.2) | 0.9 (0.6–1.3) | 610 | 49 (15.9) | 41 (13.5) | −2.4 (−8.9 to 4.1) | 0.8 (0.5–1.4) |
| Injury type | ||||||||||
| Blunt | 4,602 | 56 (2.5) | 105 (4.6) | 2.1 (1.0–3.3) | 1.9 (1.4–2.5) | 4,327 | 50 (2.3) | 71 (3.3) | 1.0 (−0.2 to 2.1) | 1.4 (1.0–2.1) |
| Penetrating | 924 | 21 (4.6) | 16 (3.5) | −1.1 (−2.7 to 0.4) | 0.8 (0.5–1.1) | 847 | 17 (4.3) | 11 (2.7) | −1.6 (−3.1 to −0.1) | 0.6 (0.4–1.0) |
| Mechanism | ||||||||||
| Fall, ground level | 1,754 | 22 (2.5) | 45 (5.1) | 2.6 (0.6–4.6) | 2.1 (1.3–3.3) | 1,632 | 19 (2.3) | 32 (3.9) | 1.6 (−1.0 to 4.3) | 1.7 (0.8–3.6) |
| Fall, from height | 728 | 14 (3.8) | 28 (7.9) | 4.2 (0.7–7.6) | 2.1 (1.2–3.7) | 679 | 12 (3.5) | 17 (5.0) | 1.5 (−1.8 to 4.8) | 1.4 (0.7–2.9) |
| MVA | 836 | 12 (2.9) | 8 (2.0) | −0.9 (−2.8 to 0.9) | 0.7 (0.3–1.6) | 779 | 11 (2.8) | 6 (1.7) | −1.1 (−3.2 to 0.9) | 0.6 (0.2–1.7) |
| Assault | 663 | 1 (0.3) | 3 (0.8) | 0.5 (−0.4 to 1.5) | 3.1 (0.4–21.8) | 638 | 1 (0.3) | 1 (0.3) | 0.0 (−0.5 to 0.6) | 1.1 (0.2–7.7) |
| Age | ||||||||||
| <65 y | 4,201 | 48 (2.3) | 69 (3.3) | 1.0 (0.0–2.0) | 1.4 (1.0–2.0) | 3,952 | 42 (2.1) | 54 (2.7) | 0.6 (−0.5 to 1.7) | 1.3 (0.8–2.0) |
| ≥65 y | 1,387 | 31 (4.5) | 59 (8.5) | 3.9 (1.4–6.5) | 1.9 (1.3–2.7) | 1,283 | 27 (4.2) | 38 (5.9) | 1.7 (−1.0 to 4.4) | 1.4 (0.9–2.3) |
All data represent frequency (percentage) unless otherwise specified.
Bolded comparison noted to be statistically significant (p < 0.05).
COVID-19 pandemic affected NYC beginning March 2020.
CI, confidence interval; MVA, motor vehicle accident.
We performed several subgroup analyses. When evaluating patients by ISS, we found that the adjusted mortality risk was significantly higher for those patients with lower ISS but not in those with higher ISS (Table3). This relationship persisted even after excluding the COVID-19 patient cohort. The in-hospital mortality rate for non–COVID-injured New Yorkers with an ISS of <15 cared for during March to May 2020 (2.0%) was 2.7 times higher than that of patients admitted during the same time frame in 2018 and 2019 (0.8%;p = 0.005). In many of the other subgroups, we also found significant differences in the adjusted mortality risk when comparing the early pandemic to prior years, but after excluding COVID-19 patients, most of these differences were attenuated and no longer statistically significant. We did find, however, that, after excluding the COVID-19 cohort, patients with penetrating injuries were significantly less likely to die in the early pandemic compared with prior years. Specifically, penetrating trauma victims without COVID-19 admitted during the early spring of 2020 were 40% less likely to die in the hospital compared with the same time frame in 2018 and 2019.
Comorbidities varied slightly among patients in the early pandemic compared with prior years (Table4). Importantly, mental health disorders and substance abuse were significantly increased. The proportion of patients experiencing an in-hospital complication, however, for the most part remained unchanged (Table5). Of note, adjusting for patient comorbidities and in-hospital complications had little effect on the mortality risk experienced by trauma patients during the early pandemic (Table6).
TABLE 4.
Unadjusted Comorbidity Prevalence, Before and During COVID-19 Pandemic, NYC Trauma Centers 2018 to 2020
| Comorbidity | Overall (N = 9,196) | Jan/Feb 2018–2019 (n = 2,361) | Jan/Feb 2020 (n = 1,247) | p | Mar/Apr/May 2018–2019 (n = 4,140) | Mar/Apr/May 2020 (n = 1,448) | p |
|---|---|---|---|---|---|---|---|
| Any comorbidity | 3,986 (43) | 1,079 (46) | 589 (47) | 0.38 | 1,649 (40) | 669 (46) | <0.001 |
| Hypertension | 2,114 (23) | 600 (25) | 327 (26) | 0.60 | 857 (21) | 330 (23) | 0.09 |
| Advanced directive | 58 (1) | 18 (1) | 8 (1) | 0.68 | 20 (0) | 12 (1) | 0.13 |
| Alcohol use Disorder | 731 (8) | 207 (9) | 89 (7) | 0.09 | 314 (8) | 121 (8) | 0.35 |
| Angina | 2 (0) | 0 (0) | 0 (0) | 1.00 | 2 (0) | 0 (0) | 0.40 |
| Anticoagulant use | 392 (4) | 94 (4) | 77 (6) | 0.003 | 143 (3) | 78 (5) | 0.001 |
| Bleeding disorder | 41 (0) | 9 (0) | 6 (0) | 0.66 | 17 (0) | 9 (1) | 0.31 |
| Currently on chemotherapy | 7 (0) | 0 (0) | 0 (0) | 1.00 | 6 (0) | 1 (0) | 0.48 |
| Cirrhosis | 70 (1) | 17 (1) | 13 (1) | 0.31 | 26 (1) | 14 (1) | 0.19 |
| COPD | 199 (2) | 55 (2) | 36 (3) | 0.31 | 74 (2) | 34 (2) | 0.18 |
| CVA | 187 (2) | 56 (2) | 28 (2) | 0.81 | 84 (2) | 19 (1) | 0.08 |
| Dementia | 339 (4) | 96 (4) | 50 (4) | 0.94 | 151 (4) | 42 (3) | 0.18 |
| Diabetes | 1,052 (11) | 303 (13) | 178 (14) | 0.23 | 410 (10) | 161 (11) | 0.19 |
| Disseminated cancer | 30 (0) | 6 (0) | 1 (0) | 0.26 | 18 (0) | 5 (0) | 0.65 |
| Functionally dependent | 494 (5) | 127 (5) | 91 (7) | 0.02 | 188 (5) | 88 (6) | 0.02 |
| CHF | 193 (2) | 45 (2) | 25 (2) | 0.84 | 86 (2) | 37 (3) | 0.29 |
| MI | 42 (0) | 15 (1) | 3 (0) | 0.11 | 23 (1) | 1 (0) | 0.02 |
| Peripheral artery disease | 29 (0) | 9 (0) | 5 (0) | 0.93 | 11 (0) | 4 (0) | 0.95 |
| Mental health disorder | 735 (8) | 183 (8) | 95 (8) | 0.89 | 310 (7) | 147 (10) | 0.001 |
| Renal failure | 94 (1) | 20 (1) | 15 (1) | 0.30 | 37 (1) | 22 (2) | 0.05 |
| Smoker | 721 (8) | 169 (7) | 132 (11) | <0.001 | 265 (6) | 155 (11) | <0.001 |
| Steroid | 36 (0) | 14 (1) | 3 (0) | 0.14 | 18 (0) | 1 (0) | 0.04 |
| Substance use disorder | 678 (7) | 208 (9) | 82 (7) | 0.02 | 268 (6) | 120 (8) | 0.02 |
All data represent frequency (percentage) unless otherwise indicated.
CHF, congestive heart failure; COPD, chronic obstructive pulmonary disease; CVA, cerebrovascular accident; MI, myocardial infarction.
TABLE 5.
Unadjusted In-hospital Complications, Before and During COVID-19 Pandemic, NYC Trauma Centers 2018 to 2020
| Complication | Overall (N = 9,196) | Jan/Feb 2018–2019 (n = 2,361) | Jan/Feb 2020 (n = 1,247) | p | Mar/Apr/May 2018–2019 (n = 4,140) | Mar/Apr/May 2020 (n = 1,448) | p |
|---|---|---|---|---|---|---|---|
| Any complication | 425 (5) | 118 (5) | 60 (5) | 0.81 | 185 (4) | 62 (4) | 0.77 |
| Alcohol withdrawal | 126 (1) | 40 (2) | 14 (1) | 0.18 | 55 (1) | 17 (1) | 0.65 |
| Cardiac arrest | 62 (1) | 12 (1) | 13 (1) | 0.07 | 21 (1) | 16 (1) | 0.02 |
| CAUTI | 15 (0) | 3 (0) | 4 (0) | 0.24 | 7 (0) | 1 (0) | 0.69 |
| CLABSI | 2 (0) | 1 (0) | 0 (0) | 0.99 | 1 (0) | 0 (0) | 0.99 |
| Deep SSI | 11 (0) | 2 (0) | 1 (0) | 0.99 | 7 (0) | 1 (0) | 0.69 |
| DVT | 27 (0) | 7 (0) | 0 (0) | 0.10 | 14 (0) | 6 (0) | 0.68 |
| PE | 17 (0) | 5 (0) | 2 (0) | 0.99 | 7 (0) | 3 (0) | 0.77 |
| Compartment syndrome | 11 (0) | 3 (0) | 1 (0) | 0.99 | 6 (0) | 1 (0) | 0.69 |
| Unplanned intubation | 63 (1) | 20 (1) | 10 (1) | 0.89 | 21 (1) | 12 (1) | 0.17 |
| AKI | 32 (0) | 13 (1) | 2 (0) | 0.08 | 10 (0) | 7 (0) | 0.17 |
| MI | 5 (0) | 2 (0) | 0 (0) | 0.55 | 3 (0) | 0 (0) | 0.57 |
| Organ space SSI | 3 (0) | 0 (0) | 0 (0) | 1.00 | 3 (0) | 0 (0) | 0.57 |
| Osteomyelitis | 1 (0) | 0 (0) | 0 (0) | 1.00 | 1 (0) | 0 (0) | 0.99 |
| ARDS | 22 (0) | 3 (0) | 4 (0) | 0.24 | 12 (0) | 3 (0) | 0.77 |
| Return to OR | 32 (0) | 7 (0) | 6 (0) | 0.39 | 14 (0) | 5 (0) | 0.99 |
| Sepsis | 29 (0) | 5 (0) | 3 (0) | 0.99 | 14 (0) | 7 (0) | 0.44 |
| Stroke | 8 (0) | 2 (0) | 1 (0) | 0.99 | 4 (0) | 1 (0) | 0.99 |
| Superficial SSI | 8 (0) | 3 (0) | 1 (0) | 0.99 | 4 (0) | 0 (0) | 0.58 |
| Pressure ulcer | 16 (0) | 3 (0) | 2 (0) | 0.99 | 9 (0) | 2 (0) | 0.74 |
| Unplanned ICU admission | 94 (1) | 29 (1) | 20 (2) | 0.35 | 34 (1) | 11 (1) | 0.82 |
| VAP | 15 (0) | 5 (0) | 1 (0) | 0.67 | 6 (0) | 3 (0) | 0.70 |
All data represent frequency (percentage) unless otherwise indicated.
AKI, acute kidney injury; ARDS, acute respiratory distress syndrome; CAUTI, catheter-associated urinary tract infection; CLABSI, central line-associated bloodstream infection; DVT, deep vein thrombosis; MI, myocardial infarction; OR, operating room; PE, pulmonary embolism; SSI, surgical site infection; VAP, ventilator-associated pneumonia.
TABLE 6.
Propensity-Weighted Mortality Risk for Early Pandemic Months Compared With Previous Years—Additionally Adjusted Patient Comorbidities and In-hospital Complications
| Excluding COVID-19 Patients | ||||||||||
|---|---|---|---|---|---|---|---|---|---|---|
| Mortality | n | Mar/Apr/May | Absolute Risk Difference (95% CI) | Relative Risk (95% CI) | n | Mar/Apr/May | Absolute Risk Difference (95% CI) | Relative Risk (95% CI) | ||
| 2018/2019 | 2020 | 2018/2019 | 2020 | |||||||
| Overall | 5,588 | 79 (2.8) | 127 (4.6) | 1.7 (0.7–2.7) | 1.6 (1.2–2.1) | 5,235 | 69 (2.6) | 88 (3.4) | 0.7 (−0.3 to 1.8) | 1.3 (0.9–1.8) |
| + Adjusted for any comorbidity | 5,588 | 79 (2.8) | 131 (4.7) | 1.9 (0.8–2.9) | 1.7 (1.3–2.1) | 5,235 | 69 (2.6) | 90 (3.4) | 0.8 (−0.2 to 1.9) | 1.3 (0.9–1.8) |
| + Adjusted for any complication | 5,588 | 79 (2.8) | 128 (4.6) | 1.8 (0.8–2.7) | 1.6 (1.3–2.1) | 5,235 | 68 (2.6) | 94 (3.6) | 1.0 (−0.1 to 2.1) | 1.4 (1.0–1.9) |
| + Adjusted for any comorbidity and any complication | 5,588 | 78 (2.8) | 132 (4.7) | 1.9 (0.9–2.9) | 1.7 (1.3–2.2) | 5,235 | 68 (2.6) | 96 (3.7) | 1.1 (−0.1 to 2.2) | 1.4 (1.0–1.9) |
All data represent frequency (percentage) unless otherwise specified.
Bolded comparison noted to be statistically significant (p < 0.05).
COVID-19 pandemic affected NYC beginning March 2020.
CI, confidence interval; MVA, motor vehicle accident.
DISCUSSION
In the first few months of the COVID-19 pandemic, SARS-CoV-2 exhausted NYC's health care system and resources, peaking at more than 5,000 new cases per day.2 Reported fatality rates neared 10% during this same period with about a third of hospitalized patients succumbing to COVID-19 infection.2,3 In response to this burden, elective surgeries were canceled, and hospital beds and staff were reallocated to the care of COVID-19 patients throughout NYC. As trauma surgeons and surgical critical care physicians were redeployed to COVID-ICUs, an early report from the Greater New York American College of Surgeons Committee on Trauma (ACS COT) recognized and acknowledged the new burden on the NYC trauma system.17 This report recommended frequent institutional assessments of the effect of the crisis on trauma center functions. Given the lack of governmental or consensus guidance for trauma system maintenance at that time, the Greater New York ACS COT advocated to preserve trauma infrastructures and capacity whenever possible in each region.
In this study of the NYC's municipal trauma system of five level 1 trauma centers, we found that overall trauma visits declined significantly during the initial COVID surge in Spring 2020 compared with the two preceding years of the same period, consistent with our primary hypothesis. Despite this overall decline in trauma visits, the rates of penetrating trauma significantly increased by almost 50% during this same period. Unexpectedly, we found that there was an increase in the mortality rate compared with prior years when accounting for important confounders. However, after excluding COVID-19–positive patients, the increased risk of death persisted only in the subset of patients with low ISS. Specifically, non–COVID-19 patients who were less severely injured were more than twice as likely to die during the early pandemic compared with prior years.
The effect the pandemic and “stay-at-home” orders had on trauma care in this country has been evaluated by authors in three other major cities across the United States. One of the first reports came from Philadelphia where, similar to our experience, there was a 20% decrease in trauma admissions but a 35% increase in penetrating trauma.10 A subsequent large study from San Francisco showed no change in overall violent traumas but did demonstrate a small statistically significant increase in homicides in association with their shelter-in-place order.11 However, these two studies did not examine the effect of the pandemic on trauma mortality. A recently published study from Los Angeles County, however, did examine mortality and found an overall decrease in both injury severity and a significant decrease in the mortality rate of trauma patients during the early pandemic compared with the prior years.12 This led the authors to suggest that “in future lockdowns … not only [is] there no need for trauma closures or additional critical care resources but … areduced need for these resources, may be taken into account.” There remains the question, however, of why did the NYC municipal trauma system, in contrast to the LA County experience, demonstrate an increase in mortality during the early pandemic among its less severely injured patients?
To begin to answer this question of increased mortality, it is important to note that NYC was the first large metropolitan area in the United States to be affected by the COVID-19 pandemic. Without any prior experience to draw from, NYC quickly became the most severely affected city and the US epicenter for the pandemic during the early spring 2020.2,5,18,19 Elmhurst Hospital, one of the five trauma centers included in our study, was frequently noted to be one of the worst affected hospitals in the country and was called the “epicenter of the epicenter” by the media.20 The Bronx, where two of our trauma centers are located, had the highest hospitalizations and fatalities due to COVID-19 per 100,000 population in the city and, at that time, in the world.21 In short, NYC H + H was at the forefront of the US COVID-19 response. Many of our surgical ICUs and most trauma surgeons who practice surgical critical care throughout the NYC municipal trauma system were “redeployed” to primarily care for COVID-19 patients during this time. This redeployment occurred even as the trauma system still needed to care for the injured. With much of our human resources reallocated and our supplies and equipment frequently depleted, providing optimal care for trauma patients became challenging.22,23
The Greater New York ACS COT from the beginning encouraged frequent reassessments of the burden the pandemic had on the trauma system and advocated for its protection.17 Under this advisement and our trauma system leadership, the trauma teams were never fully dismantled, and these resources were protected for high-priority trauma activations in our emergency departments. Without outpatient clinic requirements and elective surgical caseloads, general surgeons, some subspecialists, and operating rooms were available for patients requiring emergent surgical interventions. Despite these recommendations and our best efforts to maintain trauma care at our centers, our study suggests that the pandemic placed a substantial and unprecedented strain on the NYC municipal trauma system. The enormous burden of COVID-19 disease that our trauma system faced, which was unparalleled in the United States at the time, may have contributed to the increase in mortality of trauma patients in several possible ways.
First, critically ill COVID-19 patients, often with serious comorbidities and associated complications (e.g., acute kidney injury requiring renal replacement therapy) were a substantial diversion from patients thought to be “less sick” or less severely injured.24,25 One can easily understand how this distraction could potentially compromise the usual standard of care devoted to trauma patients in normal unstrained circumstances, given the demanding needs of critically ill COVID-19 patients. Second, the COVID-19 burden depleted material resources, in particular critical care beds normally reserved for trauma patients. For instance, one of our system's surgical ICUs, which typically has 55% to 60% of beds occupied by trauma patients, was filled to 100% capacity with critically ill COVID-19 patients after the first week of the surge. As a whole, the entire NYC municipal trauma system experienced similar circumstances necessitating the conversion of alternative spaces (e.g., waiting areas, hallways) into makeshift critical care units. At the same time, the COVID-19 burden depleted human resources, as many providers at all levels and specialties were overworked with little to no time off early in the pandemic. Many house staff and subspecialists were reallocated, and providers themselves became ill from COVID-19, removing them from the workforce temporarily or, worse yet, permanently.
Despite the increase in mortality, our study elucidated an interesting and unexpected finding, specifically, a significant, although small, survival benefit to non–COVID-19 patients with penetrating injuries admitted during the early pandemic. This was especially interesting because we also found no significant difference in the number of thoracotomies or laparotomies, or the ICU LOS as compared with prior years. Although this phenomenon may be the result of unmeasured confounders in our study, there are also other reasons one may speculate as to why victims with penetrating traumas may have seen improved survival despite the numerous strains on the system described. For one, the pandemic placed extraordinary strain on emergency medical systems (EMS) worldwide and resulted in prolonged response times as COVID-19 cases increased.26 One study cited a 3-minute increase in NYC EMS response time in the early days of the pandemic, corresponding with the period of this study.27 While quantifying EMS response times is beyond the scope of this study, it follows that likely increased response times could impact the survival profile of patients with penetrating trauma. Were patients with enough physiologic reserve to withstand the prolonged EMS transport times as compared with prior years selected for survival while the other more severely injured patients died in the field?28 While further study is certainly required to confirm this theory, this could be one explanation for the increased survival seen in patients with penetrating trauma during the pandemic period.
As surrogates for resource utilization, our study looked at several measures including transfers-out and discharges to rehabilitation facilities as secondary outcomes. Many of our centers had to go on brief periods of diversion to accommodate the critically ill COVID-19 patients. Thus, we found an increased number of trauma transfers out to other acute care facilities in this study. Our study also showed significantly fewer discharges to acute rehabilitation facilities during the study period, suggesting that these centers were likely equally overwhelmed and at capacity with patients. This may have led to a “bottleneck” and hindered our ability to discharge trauma patients to these facilities during the study period. Notwithstanding, overall hospital LOS was significantly lower by 1 day, but this trend was also noted to be significant in the months leading up to the pandemic.
There are several key limitations to our study that should be taken into account when interpreting our results. First, the design of our study did not allow for an in-depth analysis of material or human resources that may have shed more light on how their depletion may have affected patient mortality. It is possible that the lack of available beds may have changed triage and discharge practices at many of our facilities such that those with minor injuries who may have otherwise been admitted were now discharged from the emergency department, thus increasing the average injury severity of remaining patients. Determining which resource depletion contributed the most to the increase in mortality, whether it be human resources or ventilators or blood products, may help other cities in preventing deaths due to trauma during future pandemics. In addition, during the early pandemic, it is important to note that COVID-19 testing was not widespread and the tests that were available were not very sensitive.29,30 Thus, patients were often labeled as carrying a clinical diagnosis of COVID-19 despite negative testing. This creates an unavoidable potential for bias and error. Specifically, it is possible that those patients with perceived minor injuries may not have been tested as frequently as those with severe injuries, partially accounting for the increased mortality risk we detected. Lastly, like most retrospective cohort studies, our study was subject to confounding by particular variables related to both the exposure and the outcome. To account for potentially important confounders, we created a propensity score for treatment and used it to balance these confounders across periods. While we attempted to include as many important confounders in the propensity score as reasonably possible using a large multicenter data set, residual confounding may still exist.
In summary, we present the first study describing the impact of the COVID-19 pandemic on trauma patient mortality within the multicenter municipal trauma system of NYC during its time as the US epicenter. Our unanticipated increase in mortality in non-COVID patients with low ISS should not be seen as a failure of the trauma system as many appreciate the nothing short of heroic efforts displayed by NYC health care workers during this time. Instead, this report should be used to demonstrate the importance of supporting and safeguarding locoregional trauma systems and their resources in the event of another global pandemic or other large-scale event, such as a natural disaster or terrorist attack, which may lead to a surge in critically ill and critically injured patients. More study beyond this report is warranted to further elucidate how the pandemic has affected trauma care and to inform how trauma systems can best communicate and share resources during catastrophic events, including future pandemic surges.
AUTHORSHIP
A.L. contributed in the literature search, study design, data interpretation, data collection, data analysis, manuscript writing, and critical revision. M.E.S. contributed in the literature search, study design, data interpretation, manuscript writing, and critical revision. H.M. contributed in the data collection. J.A.M. contributed in the literature search, study design, data interpretation, data collection, data analysis, manuscript writing, and critical revision. G.A., M.E.S., M.B., V.R., E.C., S.H.R., and S.H.T. contributed in the manuscript writing and critical revision.
ACKNOWLEDGMENTS
We thank Carrie Garcia, RN; Margaret Ewen, MS, PA-C; Fred Harry, RPA-C; Mark Anderson, RN; Joanne Scarpinato, LPN; and all the rest of the Trauma Program Office staff.
DISCLOSURE
The authors declare no conflicts of interests.
Footnotes
Published online: November 10, 2021.
Supplemental digital content is available for this article. Direct URL citations appear in the printed text, and links to the digital files are provided in the HTML text of this article on the journal’s Web site (www.jtrauma.com).
Contributor Information
Melvin E. Stone, Jr., Email: melvin.stone@nychhc.org.
Harley Markel, Email: markelh1@nychhc.org.
George Agriantonis, Email: agriantg@nychhc.org.
Marko Bukur, Email: marko.bukur@nyulangone.org.
Sherry Melton, Email: meltons@nychhc.org.
Valery Roudnitsky, Email: valery.roudnitsky@nychhc.org.
Edward Chao, Email: edward.chao@nychhc.org.
Srinivas H. Reddy, Email: srinivas.h.reddy@nychhc.org.
Sheldon H. Teperman, Email: sheldon.teperman@nychhc.org.
James A. Meltzer, Email: james.meltzer@nychhc.org.
REFERENCES
- 1.Zhu N, Zhang D, Wang W, Li X, Yang B, Song J, Zhao X, Huang B, Shi W, Lu R. A novel coronavirus from patients with pneumonia in China, 2019.N Engl J Med. 2020;382:727–733. [DOI] [PMC free article] [PubMed] [Google Scholar]
- 2.Thompson CN, Baumgartner J, Pichardo C, Toro B, Li L, Arciuolo R, Chan PY, Chen J, Culp G, Davidson A. COVID-19 outbreak — New York City, February 29–June 1, 2020.MMWR Morb Mortal Wkly Rep. 2020;69(46):1725–1729. [DOI] [PMC free article] [PubMed] [Google Scholar]
- 3.CDC COVID-19 Response Team . Geographic differences in COVID-19 cases, deaths, and incidence — United States, February 12–April 7, 2020.MMWR Morb Mortal Wkly Rep. 2020;69(15):465–471. [DOI] [PMC free article] [PubMed] [Google Scholar]
- 4.Ghebreyesus T, World Health Organization . WHO Director-General's opening remarks at the media briefing on COVID-19-2020. March 11, 2020. Available at:https://www.who.int/director-general/speeches/detail/who-director-general-s-opening-remarks-at-the-media-briefing-on-covid-19---11-march-2020. Accessed August 1, 2021.
- 5.Rosenberg ES, Dufort EM, Blog DS, Hall EW, Hoefer D, Backenson BP, Muse AT, Kirkwood JN, St George K, Holtgrave DR. COVID-19 testing, epidemic features, hospital outcomes, and household prevalence, New York State-March 2020.Clin Infect Dis. 2020;71(8):1953–1959. [DOI] [PMC free article] [PubMed] [Google Scholar]
- 6.Governor Cuomo Signs the 'New York State on PAUSE' Executive Order [press release]. Published March 23, 2020. Available at:https://www.governor.ny.gov/news/governor-cuomo-signs-new-york-state-pause-executive-order. Accessed August 2, 2021.
- 7.Erwin PC, Mucheck KW, Brownson RC. Different responses to COVID-19 in four US states: Washington, New York, Missouri, and Alabama.Am J Public Health. 2021;111:647–651. [DOI] [PMC free article] [PubMed] [Google Scholar]
- 8.Office of the New York State Governor . Governor Cuomo Announces New York City to Enter Phase 1 of Reopening on June 8 and Five Regions Enter Phase 2 of Reopening Today. Published May 29, 2020. Available at:https://www.governor.ny.gov/news/governor-cuomo-announces-new-york-city-enter-phase-1-reopening-june-8-and-five-regions-enter. Accessed September 2, 2021.
- 9.Bank M, O’Neill P, Prince J, Simon R, Teperman S, Winchell R. Early report from the greater New York chapter of the American College of Surgeons Committee on Trauma on the COVID-19 crisis. Published April 15, 2020. Available at:https://www.facs.org/-/media/files/covid19/nyc_chapter_acs_cot_covid19_crisis.ashx. Accessed August 1, 2021.
- 10.New York City Health + Hospitals . Report to the Community. Published April 1, 2014. Avalilable at:https://www.nychealthandhospitals.org/wp-content/uploads/2016/07/2014-hhc-report-to-the-community.pdf. Accessed October 1, 2021.
- 11.Qasim Z, Sjoholm LO, Volgraf J, Sailes S, Nance ML, Perks DH, Grewal H, Meyer LK, Walker J, Koenig GJ. Trauma center activity and surge response during the early phase of the COVID-19 pandemic-the Philadelphia story.J Trauma Acute Care Surg. 2020;89(4):821–828. [DOI] [PMC free article] [PubMed] [Google Scholar]
- 12.Matthay ZA, Kornblith AE, Matthay EC, Sedaghati M, Peterson S, Boeck M, Bongiovanni T, Campbell A, Chalwell L, Colwell C. The DISTANCE study: determining the impact of social distancing on trauma epidemiology during the COVID-19 epidemic—an interrupted time-series analysis.J Trauma Acute Care Surg. 2021;90(4):700–707. [DOI] [PMC free article] [PubMed] [Google Scholar]
- 13.Chiba H, Lewis M, Benjamin ER, Jakob DA, Liasidis P, Wong MD, Navarrete S, Carreon R, Demetriades D. “Safer at home”: the effect of the COVID-19 lockdown on epidemiology, resource utilization, and outcomes at a large urban trauma center.J Trauma Acute Care Surg. 2021;90(4):708–713. [DOI] [PMC free article] [PubMed] [Google Scholar]
- 14.Committee on Trauma — American College of Surgeons .Advanced Trauma Life Support (ATLS)® Student Course Manual. 10th ed.Chicago, IL: American College of Surgeons; 2018. [Google Scholar]
- 15.American Academy of Pediatrics .Pediatric Advanced Life Support: Provider Manual. Dallas, TX: American Heart Association; 2016. [Google Scholar]
- 16.Linden A, Samuels SJ. Using balance statistics to determine the optimal number of controls in matching studies.J Eval Clin Pract. 2013;19(5):968–975. [DOI] [PubMed] [Google Scholar]
- 17.Harder VS, Stuart EA, Anthony JC. Propensity score techniques and the assessment of measured covariate balance to test causal associations in psychological research.Psychol Methods. 2010;15(3):234–249. [DOI] [PMC free article] [PubMed] [Google Scholar]
- 18.Dong E, Du H, Gardner L. Johns Hopkins Center for systems science and engineering. An interactive web-based dashboard to track COVID-19 in real time.Lancet Infect Dis. 2020;20(5):533–534. [DOI] [PMC free article] [PubMed] [Google Scholar]
- 19.World Health Organization . Coronavirus disease (COVID-19): Situation Report — 132. 2020. Published May 31, 2020. Available at:https://www.who.int/docs/default-source/coronaviruse/situation-reports/20200531-covid-19-sitrep-132.pdf?sfvrsn=d9c2eaef_2. Accessed July 31, 2021.
- 20.Correal A, Jacobs A, Jones RC. A tragedy is unfolding: inside New York's virus epicenter. New York Times. April 10, 2020.
- 21.New York State Department of Health NYSDOH COVID-19 Tracker 2020. Available at:https://covid19tracker.health.ny.gov/views/NYS-COVID19-Tracker/NYSDOHCOVID-19Tracker-Map?%3Aembed=yes&%3Atoolbar=no&%3Atabs=n. Accessed October 10, 2021.
- 22.Jacobs A, Richtel M, Baker M. At war with no ammo: doctors say shortage of protective gear is dire. New York Times. May 19, 2020.
- 23.Ranney ML, Griffeth V, Jha AK. Critical supply shortages — the need for ventilators and personal protective equipment during the Covid-19 pandemic.N Engl J Med. 2020;382(18):e41. [DOI] [PubMed] [Google Scholar]
- 24.Cortiula F, Pettke A, Bartoletti M, Puglisi F, Helleday T. Managing COVID-19 in the oncology clinic and avoiding the distraction effect.Ann Oncol. 2020;31(5):553–555. [DOI] [PMC free article] [PubMed] [Google Scholar]
- 25.Gogia S, Newton-Dame R, Boudourakis L, Uppal A, Tatem K, Gupta R, Langston M, Astua A, Kapinos G, Sokol S. Covid-19 X-curves: illness hidden, illness deferred.NEJM Catalyst Innovations in Care Delivery. May 2, 2020. Available at:https://catalyst.nejm.org/doi/full/10.1056/CAT.20.0231. Accessed July 20, 2021. [Google Scholar]
- 26.Al Amiry A, Maguire BJ. Emergency medical services (EMS) calls during COVID-19: early lessons learned for systems planning (a narrative review).Open Access Emerg Med. 2021;13:407–414. [DOI] [PMC free article] [PubMed] [Google Scholar]
- 27.Prezant DJ, Lancet EA, Zeig-Owens R, Lai PH, Appel D, Webber MP, Braun J, Hall CB, Asaeda G, Kaufman B. System impacts of the COVID-19 pandemic on New York City's emergency medical services.J Am Coll Emerg Physicians Open. 2020;1(6):1205–1213. [DOI] [PMC free article] [PubMed] [Google Scholar]
- 28.Watkins A. NYC's 911 system is overwhelmed. ‘I'm terrified,’ a paramedic says. New York Times. March 31, 2020.
- 29.Goldstein ND, Burstyn I. On the importance of early testing even when imperfect in a pandemic such as COVID-19.Glob Epidemiol. 2020;2:100031. [DOI] [PMC free article] [PubMed] [Google Scholar]
- 30.Sethuraman N, Jeremiah SS, Ryo A. Interpreting diagnostic tests for SARS-CoV-2.JAMA. 2020;323(22):2249–2251. [DOI] [PubMed] [Google Scholar]