


Megastudies improve the impact of applied behavioural science
Katherine L Milkman
Dena Gromet
Hung Ho
Joseph S Kay
Timothy W Lee
Pepi Pandiloski
Yeji Park
Aneesh Rai
Max Bazerman
John Beshears
Lauri Bonacorsi
Colin Camerer
Edward Chang
Gretchen Chapman
Robert Cialdini
Hengchen Dai
Lauren Eskreis-Winkler
Ayelet Fishbach
James J Gross
Samantha Horn
Alexa Hubbard
Steven J Jones
Dean Karlan
Erika Kirgios
Joowon Klusowski
Ariella Kristal
Rahul Ladhania
George Loewenstein
Jens Ludwig
Barbara Mellers
Sendhil Mullainathan
Silvia Saccardo
Jann Spiess
Gaurav Suri
Joachim H Talloen
Jamie Taxer
Yaacov Trope
Lyle Ungar
Kevin G Volpp
Ashley Whillans
Jonathan Zinman
Angela L Duckworth
Author contributions K.L.M., D.G., A.R., M.B., J.B., L.B., E.C., G.C., R.C., H.D., L.E.-W., A.F., J.J.G., S.H., A.H., S.J.J., D.K., E.K., J.K., A.K., G.L., B.M., S.M., S.S., G.S., J.H.T., J.T., Y.T., L.U., K.G.V., A.W., J.Z. and A.L.D. designed the research. K.L.M., D.G., J.S.K., P.P., Y.P., A.L.D. and A.R. performed the research. H.H., T.W.L., P.P. and Y.P. analysed the data. K.L.M. and A.L.D wrote the paper. D.G., H.H., J.S.K., T.W.L., P.P., Y.P., A.R., M.B., J.B., C.C., G.C., H.D., A.F., J.J.G., D.K., T.K., E.K., J.K., R.L., J.L., B.M., S.M., S.S., J.S., A.W. and J.Z. provided feedback on the paper. K.L.M., D.G., J.S.K., T.K., R.L. and S.M. supervised data analysis. K.L.M., D.G., H.H., J.S.K. and T.W.L. prepared theSupplementary Information.
Correspondence and requests for materials should be addressed to Katherine L. Milkman or Angela L. Duckworth.kmilkman@wharton.upenn.edu;aduckworth@characterlab.org
Issue date 2021 Dec.
Reprints and permissions information is available athttp://www.nature.com/reprints.
Abstract
Policy-makers are increasingly turning to behavioural science for insights about how to improve citizens’ decisions and outcomes1. Typically, different scientists test different intervention ideas in different samples using different outcomes over different time intervals2. The lack of comparability of such individual investigations limits their potential to inform policy. Here, to address this limitation and accelerate the pace of discovery, we introduce the megastudy–a massive field experiment in which the effects of many different interventions are compared in the same population on the same objectively measured outcome for the same duration. In a megastudy targeting physical exercise among 61,293 members of an American fitness chain, 30 scientists from 15 different US universities worked in small independent teams to design a total of 54 different four-week digital programmes (or interventions) encouraging exercise. We show that 45% of these interventions significantly increased weekly gym visits by 9% to 27%; the top-performing intervention offered microrewards for returning to the gym after a missed workout. Only 8% of interventions induced behaviour change that was significant and measurable after the four-week intervention. Conditioning on the 45% of interventions that increased exercise during the intervention, we detected carry-over effects that were proportionally similar to those measured in previous research3–6. Forecasts by impartial judges failed to predict which interventions would be most effective, underscoring the value of testing many ideas at once and, therefore, the potential for megastudies to improve the evidentiary value of behavioural science.
A major impediment to prescribing behaviourally informed policy interventions is the inability to make apples-to-apples comparisons of their efficacy2. Scientific teams tend to run studies independently, recruiting their own samples, making their own decisions about design parameters and targeting behavioural outcomes of their own choosing. As a consequence, differences in treatment efficacy are obscured by massive heterogeneity in sample demographics, treatment and follow-up periods, contexts and outcomes. Furthermore, many promising ideas for changing behaviour do not work in practice7, and it can be surprisingly difficult to predict ex ante which seeds will eventually bear fruit7–11. Thus, the ‘one-apple-at-time’ approach is an inefficient way to advance behavioural science.
We propose an experimental paradigm for evaluating many behavioural interventions at once: the megastudy is a massive field experiment in which many different treatments are tested synchronously in one large sample using a common, objectively measured outcome. This approach takes inspiration from the common task framework, which has substantially accelerated progress in the field of machine learning12. In a common task framework, researchers compete to solve the same problem (such as image recognition), subject to the same constraints (for example, the same validation method) and using the same dataset, with complete transparency in terms of hypotheses tested and results12,13. There are also precedents for this kind of research in online and laboratory environments14,15. Furthermore, scientific tournaments have a similar flavour to megastudies16, although they rarely involve random assignment and have not focused on behaviour change.
Additional benefits of megastudies include enabling economies of scale and publishing null results. The centralized administration of megastudies both decreases the marginal costs of conducting field research for individual scientists and accelerates the pace of scientific exploration. Further, in the spirit of recent large scientific collaborations aimed at improving the openness and reproducibility of research17, megastudies enable null findings to be published because those null results are part of a larger endeavour.
Here we present a demonstration megastudy involving scientists who worked in small teams to create dozens of different online programmes aimed at promoting gym attendance in American adults. We also summarize separate prediction studies in which lay and expert third-party observers made ex ante forecasts of the relative efficacy of these interventions.
Defining the primary outcome
As policy-makers agree that physical exercise is healthy and because gym attendance can be measured objectively and precisely, gym visits are a natural target for applied behavioural science research3–5,18. Currently, only 49% of American adults exercise at the recommended levels19, and physical inactivity accounts for an estimated 9% of premature mortality globally20.
Our final megastudy sample includedn = 61,293 participants in 46 US states (65% female, mean age = 39.13, s.d. = 13.25). The outcomes of interest over a four-week intervention period were: (1) the number of days participants checked into the gym each week, and (2) an indicator for whether participants checked into the gym at least once in a given week (following previous research5,6). For simplicity, here we focused on the number of days that participants exercised, but include the discrete exercise measure inExtended Data Fig. 1,Extended Data Tables 1–3 andSupplementary Information 5, in which we show that results with this secondary outcome are remarkably similar to our main results below.
Gym attendance data were provided by 24 Hour Fitness, which requires members to check in to enter the gym. In the four weeks before joining our megastudy, participants’ mean number of weekly visits to the gym was 1.27 (s.d. = 1.48) and the mean number of participants who checked into the gym at least once in a given week was 47.7% (s.d. = 40.4%).
At least 455 participants were assigned to each megastudy condition (mean:n = 1,135; median:n = 839;Extended Data Table 4), yielding at least 90% power to detect a mean difference of 0.32 weekly gym visits per person between conditions whenα is set at 0.05. Furthermore, as reported inExtended Data Table 5 andSupplementary Information 1 and7, balance checks suggest that randomization was successful and participant characteristics were similar across experimental conditions.
The effects of study conditions on exercise
Our megastudy included a placebo control condition in which participants received 1,500 points when they enrolled in the study (worth US$1.08 when redeemed athttps://www.amazon.com, an amount equal to the expected earnings of participants in a typical experimental condition; see the ‘Descriptions of the 54 conditions in the megastudy’ section of theSupplementary Information). Participants in the placebo control condition received no other intervention content.
We also included a baseline intervention called planning, reminders and microincentives to exercise. This condition combined three low-cost, evidence-based components that are expected to increase exercise. First, as past research has shown that planning prompts facilitate follow-through21–23, we prompted participants to plan the dates and times when they would exercise each week of the programme. Second, as reminders have been shown to enhance goal achievement24, we texted participants reminders to exercise at these scheduled times. Finally, building on past work showing that cash rewards for exercise that are an order of magnitude larger than this can promote gym attendance3–6 and that the effects of very small incentives on goal commitment can be surprisingly large25, we offered participants microincentives for each gym visit (300 points per visit, redeemable for approximately US$0.22).
The other 52 experimental conditions in our megastudy augmented this planning, reminders and microincentives to exercise condition by adding new features (Supplementary Table 1).
Compared with the placebo control condition, 45% of the 53 experimental conditions tested in our megastudy produced a statistically significant (two-sidedP < 0.05) increase in an ordinary least squares (OLS) regression model predicting weekly gym visits during our four-week intervention (significantP values range from 2.39 × 10⁷ to 0.045;Fig. 1a andExtended Data Table 6 present these regressions;Table 2 shows the percentage of other treatments each experimental condition outperformed). InExtended Data Table 7, we present parallel analyses of whether study participants attended the gym at least once per week, and we found that, compared with the placebo control condition, approximately 34% of the experimental conditions had significantly more people visiting the gym at least once per week.
Fig. 1|. Measured versus predicted changes in weekly gym visits induced by interventions.
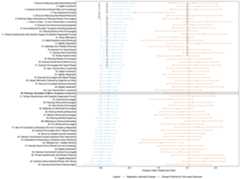
The measured change (blue) versus change predicted by third-party observers (gold) in weekly gym visits induced by each of the 53 experimental conditions in our megastudy compared with the placebo control condition during a four-week intervention period. The error bars represent the 95% confidence intervals (seeExtended Data Table 6 for the complete OLS regression results shown here in blue and the sample sizes for each condition;Supplementary Information 11 for more details about the prediction data shown in gold; andSupplementary Table 1 for full descriptions of each treatment condition in our megastudy). Sample weights were included in the pooled third-party prediction data to ensure equal weighting of each of our three participant samples (professors, practitioners and Prolific respondents). The superscripts a–e denote the different incentive amounts offered in different versions of the bonus for returning after missed workouts, higher incentives and rigidity rewarded conditions, which are described inSupplementary Table 1. In conditions with the same name, superscripts that come earlier in the alphabet indicate larger incentives.
Table 2 |.
The percentage of treatments that each experimental condition outperformed
| Experimental condition | The percentage of conditions outperformed (P < 0.05) | List of conditions outperformed (P < 0.05) |
|---|---|---|
| (1) Bonus for returning after missed workoutsb | 55 | 54***, 30**, 40**, 41**, 44–53**, 26–29*, 31–39*, 42*, 43* |
| (2) Higher incentivesa | 47 | 54***, 47–52**, 28–31*, 33*, 35–46*, 53* |
| (3) Exercise social norms shared (high and increasing) | 40 | 54***, 47–52**, 30*, 33*, 35–37*, 39–46*, 53* |
| (4) Free audiobook provided | 15 | 54**, 47–53* |
| (5) Bonus for returning after missed workoutsa | 38 | 54***, 47–52**, 30*, 33*, 36*, 37*, 39–46*, 53* |
| (6) Planning fallacy described and planning revision encouraged | 11 | 54**, 48–52* |
| (7) Choice of gain- or loss-framed microincentives | 32 | 54***, 47–52**, 30*, 37*, 40–46*, 53* |
| (8) Exercise commitment contract explained | 11 | 54**, 48–52* |
| (9) Free audiobook provided, temptation bundling explained | 17 | 54**, 45*, 47–53* |
| (10) Following workout plan encouraged | 13 | 54**, 47–52* |
| (11) Fitness questionnaire with decision support and cognitive reappraisal prompt | 11 | 54**, 48–52* |
| (12) Values affirmation | 4 | 51*, 54* |
| (13) Asked questions about workouts | 2 | 54* |
| (14) Rigidity rewardeda | 6 | 54**, 51*, 52* |
| (15) Defaulted into three weekly workouts | 2 | 54* |
| (16) Exercise fun facts shared | 2 | 54* |
| (17) Exercise advice solicited | 2 | 54* |
| (18) Fitness questionnaire | 2 | 54** |
| (19) Planning revision encouraged | 2 | 54* |
| (20) Exercise social norms shared (low) | 2 | 54* |
| (21) Exercise encouraged with typed pledge | 0 | |
| (22) Gain-framed microincentives | 2 | 54* |
| (23) Higher incentivesb | 2 | 54* |
| (24) Rigidity rewardede | 2 | 54* |
| (25) Exercise encouraged with signed pledge | 0 | |
| (26) Values affirmation followed by diagnosis as gritty | 0 | |
| (27) Bonus for consistent exercise schedule | 0 | |
| (28) Rigidity rewardedc | 0 | |
| (29) Loss-framed microincentives | 0 | |
| (30) Planning, reminders and microincentives to exercise | 2 | 54** |
| (31) Fitness questionnaire with cognitive reappraisal prompt | 0 | |
| (32) Exercise encouraged | 0 | |
| (33) Planning workouts encouraged | 0 | |
| (34) Gym routine encouraged | 0 | |
| (35) Reflecting on workouts encouraged | 0 | |
| (36) Planning workouts rewarded | 0 | |
| (37) Effective workouts encouraged | 0 | |
| (38) Planning benefits explained | 0 | |
| (39) Reflecting on workouts rewarded | 0 | |
| (40) Fun workouts encouraged | 0 | |
| (41) Monday–Friday consistency rewarded, Saturday–Sunday consistency rewarded | 0 | |
| (42) Exercise encouraged with electronically signed pledge | 0 | |
| (43) Bonus for variable exercise schedule | 0 | |
| (44) Exercise commitment contract explained post-intervention | 0 | |
| (45) Rewarded for responding to questions about workouts | 0 | |
| (46) Defaulted into one weekly workout | 0 | |
| (47) Exercise social norms shared (low but increasing) | 0 | |
| (48) Rigidity rewardedd | 0 | |
| (49) Exercise commitment contract encouraged | 0 | |
| (50) Fitness questionnaire with decision support | 0 | |
| (51) Rigidity rewardedb | 0 | |
| (52) Exercise advice solicited, shared with others | 0 | |
| (53) Exercise social norms shared (high) | 0 | |
| (54) Placebo control | 0 | |
The percentage of conditions outperformed (P < 0.05) was obtained by conducting pairwise Wald tests to assess whether paired regression coefficients significantly differed from one another inExtended Data Table 6.
The superscripts a–e denote the different incentive amounts offered in different versions of the bonus for returning after missed workouts, higher incentives and rigidity rewarded conditions, which are described inSupplementary Table 1. In conditions with the same name, superscripts that come earlier in the alphabet indicate larger incentives.
P < 0.05;
P < 0.01;
P < 0.001.
Rather than adjusting ourP values for 53 paired comparisons, we report unadjusted standard errors, two-sidedP values and confidence intervals (CI) so readers may choose a preferred correction. Using the Storey–Tibshirani method of computing the false-discovery rate26, we estimate that the results identified as significant at the 5% level have less than a 5.07% chance of being a true null. The 45% of our experimental conditions that increased gym visits produced an estimated 0.14 to 0.40 extra weekly gym visits during the four-week intervention period (the CI lower bounds range from 0.004 to 0.21 and the CI upper bounds range from 0.23 to 0.59), increasing exercise by an estimated 9% to 27% compared with the placebo control condition, in which participants visited the gym a mean of 1.48 times per week during the intervention period. No treatment significantly reduced gym visits. Furthermore, anF-test enables us to reject the null hypothesis that all 53 treatment effects have the same true value (F = 1.392,P = 0.032).
The planning, reminders and microincentives to exercise condition produced an estimated 0.14 more weekly gym visits per participant (a 9% increase in exercise) compared with the placebo control condition (b = 0.14, 95% CI = 0.04–0.23,P = 0.006).
All of the 24 treatments that significantly increased exercise in comparison to the placebo control condition included planning, reminders and incentives to exercise, typically with an additional nudge or reward to visit the gym (Fig. 1). Five of these experimental conditions stood out, significantly outperforming the planning, reminders and microincentives condition according to Wald tests comparing the estimated treatment effects. As some effect-size estimates had wider confidence intervals than others, these five conditions were not exactly the same as the five conditions with the largest estimated effect sizes shown inFig. 1. The conditions in question are presented inTable 1 with their estimated effects on exercise. Note that the criteria used for their selection (that they are the top performers in a distribution) mean that these estimated treatment effects are probably inflated.
Table 1 |.
Regression-estimated effects of top-performing interventions
| Compared with the placebo control condition | Compared with the planning, reminders and microincentives condition | |||||
|---|---|---|---|---|---|---|
| Treatment | b | 95% CI | P | b | 95% CI | P |
| (1) Bonus for returning after missed workoutsb | 0.403 | 0.21–0.59 | <0.001 | 0.266 | 0.06–0.47 | 0.010 |
| (2) Higher incentivesa | 0.365 | 0.18–0.55 | <0.001 | 0.229 | 0.04–0.42 | 0.020 |
| (3) Exercise social norms shared (high and increasing) | 0.345 | 0.18–0.51 | <0.001 | 0.209 | 0.03–0.39 | 0.020 |
| (5) Bonus for returning after missed workoutsa | 0.336 | 0.18–0.49 | <0.001 | 0.200 | 0.03–0.37 | 0.022 |
| (7) Choice of gain- or loss-framed microincentives | 0.284 | 0.18–0.39 | <0.001 | 0.147 | 0.02–0.27 | 0.021 |
SeeExtended Data Table 6 for the complete OLS regression results summarized here in columns 2–4, andExtended Data Table 8 for the complete OLS regression results summarized in columns 5–7.
The superscripts a–b denote the different incentive amounts offered in different versions of the bonus for returning after missed workouts and higher incentives, which are described inSupplementary Table 1. In conditions with the same name, superscripts that come earlier in the alphabet indicate larger incentives.
As shown inTable 1, we found that rewarding participants with a bonus of 125 points (US$0.09) for returning to the gym after a missed workout produced an estimated 0.40 more weekly gym visits per participant (a 27% increase in exercise) compared with the placebo control (b = 0.40,P < 0.001). This condition produced a 16% increase in exercise relative to planning, reminders and microincentives (b = 0.27,P = 0.010). Second, offering participants larger incentives (that is, 490 points per gym visit, or US$1.75) produced an estimated 0.37 more weekly gym visits per participant (a 25% increase in exercise) compared with the placebo control (b = 0.37,P < 0.001). This condition produced a 14% increase in exercise relative to planning, reminders and microincentives (b = 0.23,P = 0.020). Third, telling participants that the majority of Americans exercise and the fraction is growing produced an estimated 0.35 more weekly gym visits per participant (a 24% increase in exercise) compared with the placebo control (b = 0.35,P < 0.001). This condition produced a 13% increase in exercise relative to planning, reminders and microincentives (b = 0.21,P = 0.020). Fourth, rewarding participants with a bonus of 225 points (US$0.16) for returning to the gym after a missed workout produced an estimated 0.34 more weekly gym visits per participant (a 23% increase in exercise) compared with the placebo control (b = 0.34,P < 0.001). This condition produced a 12% increase in exercise relative to planning, reminders and microincentives (b = 0.20,P = 0.022). Fifth, allowing participants to choose whether their rewards for gym visits would be framed as gains (such that they would earn points each day that they visited the gym) or losses (such that they would lose points each day that they did not visit the gym) produced an estimated 0.28 more weekly gym visits per participant (a 19% increase in exercise) compared with the placebo control (b = 0.28,P < 0.001). This condition produced a 9% increase in exercise relative to planning, reminders and microincentives (b = 0.15,P = 0.021). Note that, in different conditions, points had different cash values (Supplementary Table 1).
Enduring effects of study conditions
Although 45% of the experimental conditions in our megastudy outperformed the placebo control condition during our four-week intervention, only 8% produced significant increases in the frequency of gym visits during the four weeks post-intervention, compared with 2.5% that would be expected to do so by chance (Extended Data Table 9). AnF-test enabled us to reject the null hypothesis that all 53 treatments have null effects beyond the treatment period (F = 1.418,P = 0.024).
Focusing on the 45% of interventions that outperformed the placebo control during the four-week intervention period, each extra gym visit that was generated during the four-week intervention period corresponded to between −0.07 and 0.76 extra gym visits during the ten weeks post-intervention (median = 0.354 extra gym visits post-intervention, 25th percentile = 0.085 extra gym visits post-intervention, 75th percentile = 0.522 extra gym visits post-intervention;Supplementary Table 5). We also pooled data from these interventions into a single category and estimated that they generated a mean of 0.30 extra gym visits during the 10-week post-intervention period for every additional gym visit that they produced during the four-week intervention (skew-corrected 95% CI=0.13–0.54; seeSupplementary Information 3 for details). These post-intervention returns are consistent with those from previous studies of gym attendance and habit formation3–6, in which analogous returns range from 0.16 to 0.46 extra gym visits post-intervention for every extra gym visit induced during the intervention (Supplementary Table 5).
By selecting on the basis of those interventions that increased exercise significantly during the four-week intervention period, we focused on experimental conditions that will be of the greatest interest to policy makers, but we also probably overstate their post-intervention effects due to the winner’s curse. To address this, we pooled data from all 53 experimental conditions into a single category. We estimate that interventions in our study generated a mean of 0.28 extra gym visits during the 10-week post-intervention period for every additional gym visit that they produced during the four-week intervention (skew-corrected 95% CI = 0.07–0.59).
Prediction accuracy
One could argue that the harder it is to predict the results of experiments, the more valuable the megastudy approach. The more difficult it is to forecast ex ante which interventions will work, the harder it is to decide in advance which interventions to prioritize for testing, and the more useful it is to instead test a large number of treatment approaches.
To assess forecasting accuracy, we conducted a series of separate preregistered studies (see the ‘Data availability’ section) in which third-party observers were asked to predict the impact of three randomly selected interventions from our megastudy. We collected these data 14 months after conducting our megastudy. One study included 301 participants recruited from Prolific (who made a total of 903 predictions, or a mean of 17 predictions per treatment condition); another included 156 professors from the top 50 schools of public health as rated by U.S. News & World Report in 2019 (who made a total of 468 predictions, or a mean of 9 predictions per treatment condition; a list of schools is provided inSupplementary Information 11); and a final study included 90 practitioners recruited from companies that specialize in applied behavioural science (who made a total of 270 predictions, or a mean of 5 predictions per treatment condition). See the ‘Prediction study participants’ section in the Methods for demographic information about the study participants.
We found no robust correlations (weighted pooledr = 0.02,P = 0.89) between these populations’ estimated treatment effects and observed treatment effects (Prolific participantsr = 0.25,P = 0.07; professors’r = −0.07,P = 0.63; practitionersr = −0.18,P = 0.19). Furthermore, predictions about the benefits of our interventions were a mean of 9.1 times too optimistic (Fig. 1b). Predictions of treatment effects for our secondary dependent variable–the likelihood of making a gym visit in a week–were similarly inaccurate and are presented inSupplementary Information 11.
Taken together, these results highlight how difficult it is to predict ex ante the efficacy of interventions and why it is therefore so valuable that megastudies enable the synchronous testing of many different approaches to changing behaviour.
Conclusions
The megastudy paradigm enables apples-to-apples comparisons of dozens of different behaviour change interventions, each designed by an independent scientific team. If we had tested only one or two interventions (as is typical in behavioural science research27,28), we probably would not have picked many top performers and failed to gain valuable new insights. Relatedly, few of the 20 preregistered studies embedded within our megastudy yielded results that were consistent with their preregistered hypotheses. The megastudy paradigm ensures that all results, including null results, are published and that insights can still be gleaned from comparing treatments across studies, as illustrated both by this megastudy and a follow-up megastudy testing the best strategies for nudging vaccination29.
The megastudy paradigm has limitations. First, the insights of a megastudy depend on the strength of the included interventions. In the current demonstration, it is probable that more extensive interaction (such as in-person coaching) or greater financial incentives would have produced larger treatment effects3–6,18. Second, constraining scientists to a specific sample, dependent variable and timeframe arguably limits creativity in intervention design. Third, the effect sizes of top-performing interventions in megastudies will typically be over-estimated, whereas the effect sizes of the worst-performing interventions in megastudies will typically be underestimated due to noise and mean reversion30. Replicating the effects of outlier interventions identified in megastudies will therefore be important for establishing their true impact.
Regarding contexts that are especially well-suited for megastudies, one prerequisite is a sufficiently large population for testing more than a handful of interventions with adequate statistical power. Furthermore, as is the case with any study intended to influence policy, a cost–benefit analysis should suggest that, if tested interventions yield plausible treatment effects, deploying those interventions widely would be a wise investment. For example, our use of microincentives in this megastudy (rather than the substantially larger incentives that have been proven impactful in previous gym studies) was informed by cost-effectiveness calculations that suggested that large incentives could not be justified by the expected treatment effects and the value of exercise to society (Supplementary Information 3 and4). Furthermore, as megastudies add value to policy-makers by separating the wheat from the chaff, they are especially valuable when the targeted behaviour is of unambiguous consequence to individual and societal wellbeing. Finally, as megastudies reduce the downside of individual study failures, they may create incentives for scientists to design interventions with a low probability of a notable result, so they may be well-suited to environments where risk-taking could have a particularly large upside.
By enabling direct comparisons of diverse intervention ideas, megastudies can accelerate the generation and testing of new insights about human behaviour and the relevance of these insights for public policy.
Methods
Ethics approval
The Institutional Review Board at the University of Pennsylvania approved our study’s protocols, and this research was deemed to comply with all of the relevant ethical regulations. Informed consent was obtained from all of the study participants as part of the enrolment process. The reference number for the field experiment was 827107 and the reference number for the prediction accuracy studies was 833336.
Megastudy setting
We conducted our megastudy in partnership with 24 Hour Fitness, one of the largest gym chains in the United States. At the time of the study, 24 Hour Fitness had over four million members and 450 gym locations in 14 states (although some members of 24 Hour Fitness reside in states without a 24 Hour Fitness location, so our study participants came from more than 14 US states). The cost of a basic membership at 24 Hour Fitness varies by location, but ranges from approximately US$30 to US$60 per month. Members check in to 24 Hour Fitness gyms by either (1) giving their ID to a staff member at the front desk, (2) swiping or scanning a member card or (3) using a fingerprint reader and unique check-in code. We used 24 Hour Fitness check-in data to track gym attendance.
Participant recruitment and enrolment
All of the approximately 4 million adult members of 24 Hour Fitness gyms whose memberships were active between 21 March 2018 and 31 January 2019 were eligible to participate. Recruitment involved a multichannel marketing campaign advertising “a habit-building, science-based workout program” called StepUp, and 24 Hour Fitness members could sign up online anytime between 21 March 2018 and 31 January 2019. All of the recruitment materials informed members that they could sign up for free for the StepUp Program and earn Amazon cash rewards for exercising. Members were also told that they would earn a chance to receive a US$50 Amazon gift card by simply registering for the programme. Three participants were randomly selected to receive a US$50 gift card.
All of the recruitment materials included a URL that directed gym members to the StepUp Program website, which conveyed that StepUp was a 28-day digital experience being offered exclusively to 24 Hour Fitness members. Participants who visited the StepUp Program website were first prompted to consent to participate in research. Participants then provided their gym check-in code and date of birth to verify their gym membership. Finally, participants were prompted to provide their name, email address and phone number, and they were required to verify that their phone could receive text messages from StepUp (details are provided in the ‘Registration experience’ section of theSupplementary Information). After verifying that they could receive text messages, the participants were randomly assigned to one of twenty different preregistered substudies (all involving different versions of the StepUp Program) aimed at increasing gym visit frequency, and they were then randomly assigned to one of the 54 different experimental conditions within these studies. Participants were blind to study hypotheses.
Our initial, preregistered recruitment goal was to include at least 3,000 participants per experimental condition in our megastudy. However, shortly after launching recruitment, it became apparent that this would take nearly a decade. As a consequence, we updated our preregistrations early on in the 10 month study to reflect a more realistic stopping rule of recruiting at least 400 participants per condition.
In total, 62,746 participants were randomized to one of the 54 study conditions in our megastudy, with at least 455 participants in each condition (Extended Data Table 4). Participants were excluded from analyses if they requested to withdraw (n = 123), signed up more than once for the StepUp Program (n = 355) or experienced severe technology glitches (n = 975). Further details about these exclusions are provided inSupplementary Information 9 and10.
Thus, our final sample includesn = 61,293 study participants. 24 Hour Fitness shared a record of every gym visit made by study participants starting one year before each participant’s enrolment in the programme and continuing until one year after each participant’s programme participation concluded (for a total of 758 d of observations per participant).
As reported inExtended Data Table 6 andSupplementary Information 1 and7, balance checks suggest that randomization was successful. As we obtained informed consent to analyse data on study participants only, we unfortunately cannot determine how representative our final sample is of the 24 Hour Fitness membership.
Megastudy intervention content
After enrolling, participants in all 54 conditions of our megastudy were shown descriptions of the StepUp Program. All of the participants learned that they would receive points during the intervention period that were redeemable for an Amazon gift card after they completed the intervention. Participants in the 53 experimental conditions (that is, every condition except for the placebo control condition) received 100 points for registering and learned how they could earn incentives (through points that were redeemable for an Amazon gift card at the conclusion of the programme; notably, the conversion rate differed by experimental condition). Most conditions awarded points for gym visits. A number of the conditions offered additional bonuses based on the time of a participant’s gym visit or other observable behaviours (such as responding to text messages). Complete information about study stimuli and incentives in each condition is provided in the ‘Descriptions of the 54 conditions in the megastudy’ section of theSupplementary Information.
In 53 experimental conditions (all of the conditions except for the placebo control condition), the participants were prompted to create a weekly schedule of the days and times that they planned to work out during the four-week programme. The registration experience for the experimental conditions also included other content specific to the study condition (such as survey questions, instructions, images and videos). At the conclusion of the registration experience, all of the participants were informed that their four-week programme started the next day.
Participants across all 54 study conditions received a welcome text message shortly after they completed enrolment confirming the points that they received for registering, as well as a final text message on the last (28th) day of the programme confirming the programme’s end.
In all 53 experimental conditions, the participants received workout reminders by text 30 min before each scheduled workout (the language of these texts varied across conditions); most of the experimental conditions included additional text messages reinforcing intervention content. Moreover, the participants in all 53 experimental conditions received an email shortly after registration and once a week thereafter for four weeks. Each email confirmed the workout schedule that they had created and reinforced study-specific content.
The simplest experimental condition was the planning, reminders and microincentives to exercise condition. This condition included components that have previously been shown to increase exercise–prompts to plan workouts, reminders to exercise at planned times and microincentives for gym visits6. The study participants in this condition were prompted to create a weekly workout schedule after registering for StepUp. Over the next four weeks, the participants received text message reminders before each scheduled gym visit, weekly emails containing their workout schedules and 300 points (worth a total of US$0.22) each time they visited the gym that were redeemable for an Amazon gift card at the conclusion of the study.
To develop our study’s 52 other experimental conditions, members of an interdisciplinary group of 34 scientists who study behaviour change were invited to independently submit designs (‘tournament’ entries) along with additional collaborators of their choosing, and submissions were then revised in partnership with the project’s principal investigators (a process that required extensive coordination). The first and last author invited all of the scientists affiliated with the University of Pennsylvania’s Behaviour Change for Good Initiative (BCFG) to contribute submissions, and the 23 affiliated scientists who submitted study designs brought 13 of their own collaborators and graduate students to the project.
The participants in the placebo control condition received 1,500 points (US$1.08) when they signed up for our programme. This value was equivalent to the expected earnings of participants in our planning, reminders and microincentives condition, which was determined by calculating the mean historical gym attendance of the 24 Hour Fitness members and the point values that participants would earn in the planning, reminders and microincentives condition if they attended the gym at this frequency (100 points for registering and 300 points per gym visit × 1.17 expected gym visits per week for 4 weeks = 1,500 expected points). The participants in the placebo control condition did not create a workout schedule or receive any additional intervention content.
The other 52 experimental conditions in our megastudy involved augmentations to our planning, reminders and microincentives to exercise condition designed by scientists affiliated with BCFG. Scientists were invited to vary the (1) online registration experience delivered immediately after participants completed study enrolment, (2) text messages and emails sent during the four-week programme and (3) incentives for activities completed during the programme.
Megastudy randomization
The 54 conditions in our megastudy comprised 20 separate preregistered studies (links to all study preregistrations are provided in the ‘Full descriptions of each study condition’ section of theSupplementary Information). To offset the risk of underpowering all studies if we failed to reach our recruitment targets, megastudy participants were randomized using a weighted, time-varying algorithm as follows. At any given time, the plurality of participants (40–60%) was assigned with equal probability to conditions within one of the 20 studies noted above (the target study), 5% of participants were assigned to our placebo control condition and the remaining participants were randomly assigned with equal probability to treatment conditions in the other 19 studies. The randomization algorithm switched to a different target study after a predetermined number of participants enrolled, and this happened 26 times, creating 27 megastudy ‘stratification cohorts’. Our data analyses are weighted to account for these 27 different stratification cohorts, as described below. More details on randomization weighting are included inSupplementary Information 8.
Megastudy statistical analysis
Each of the 20 studies in our megastudy was preregistered on the Open Science Framework (details are provided in the ‘Data availability’ section). For analyses of our megastudy, we scaled up our standard, preregistered regression analysis strategy (including all of the study conditions in one giant regression model) to identify which of the 53 conditions across all 20 preregistered studies increased the frequency of gym visits during our intervention relative to our placebo control condition.
Although all 20 of the substudies in this megastudy were preregistered, the megastudy itself was not. This was an oversight on our part. We had planned to publish analyses on the totality of preregistered substudies within our megastudy, which is why we used a weighted random assignment scheme rather than sequential random assignment. Preregistering the individual substudies obviated concerns about selective inclusion of treatment arms in substudy analyses. We recommend that future megastudies are preregistered themselves.
To identify which experimental conditions were effective at increasing the frequency of gym visits during our megastudy’s four-week intervention period, we evaluated the mean estimated effect of each of the 53 experimental conditions compared with the placebo control condition. We used OLS regressions and weighted observations to account for the different probabilities of assignment across stratification cohorts.
Specifically, we used an OLS regression with participant fixed effects to estimate the following equation:
whereYict is the outcome (that is, gym attendance) of participanti from stratification cohortc in weekt,α is a constant, is an indicator for both whether participanti is in experimental conditiong and whether weekt is during the intervention period,βg is the effect of experimental conditiong during the intervention period,δct is a cohort-by-week fixed effect,vi is a participant fixed effect andεict is a random error term.G is the number of treatment conditions in the analysis (53 when estimating the treatment effect of experimental conditions relative to the placebo control reference group). We estimate the cohort-by-week fixed effects by including cohort-by-week indicator variables in the regression. To account for clustering, we estimated cluster-robust standard errors that allowed for arbitrary correlations of the error term within individuals over time31. This regression estimates the treatment effect of experimental conditiong relative to the reference group (either the placebo control, or the planning, reminders and microincentives treatment) across all of the cohorts. Participant fixed effects are not collinear with the indicators for whether an individual is in an experimental condition during the intervention period () because even though each individual can be in only one condition (which would normally create collinearity) our model includes data on participants’ preintervention gym visits for up to 52 weeks (fewer weeks are included when fewer are available for new gym members).
To adjust for the compositional differences across cohorts, we weighted each observation such that each condition is equally weighted within a cohort, and each cohort is weighted proportionally to the length of the cohort in days. This weighting, along with the inclusion of individual and cohort-by-week fixed effects described above, accounts for differences in cohort assignment and seasonality and ensures that our regression produces unbiased estimates of treatment effects. By design, the probability of assignment to each study condition differs by cohort, which would produce unbalanced estimates without the use of sample weighting and fixed effects in our regression specification. Thus, we included sample weights that ensure that, for each cohort, each experimental group is equally represented such that the estimates are equivalent to those from an experiment with equal probabilities of assignment and are therefore balanced estimates. Furthermore, to control for chance imbalances and improve statistical precision, our models include individual fixed effects and cohort-by-week fixed effects. As cohorts were determined by when participants signed up for the StepUp Program, these fixed effects should absorb any remaining seasonal variation in gym attendance. Our simulations, which are presented in the ‘Simulation to ensure validity of analyses’ section of theSupplementary Information, show that this approach yields unbiased estimates of the mean treatment effects and our balance tests reveal that experimental groups do not systematically differ in ways that could lead to biases in our estimates (details about our weighting strategy are provided inSupplementary Information 8). We rely on this statistical analysis strategy for additional regression analyses presented inSupplementary Information 5 and6.
Approximately 6.6% of the megastudy participants were not assigned to the experimental condition that they were intended to experience according to a predefined randomization matrix due to a bug that manifested when there was heavy traffic on our website (leading occasional skips or repeats in the conditions to which subsequent participants were assigned). Our weighting accounts for this error because it is based on the number of people who were actually assigned to each condition within a cohort, rather than the number of people to whom we intended to assign each condition within a cohort. Analyses based on the intended condition assignment are provided in theSupplementary Information (seeSupplementary Information 5a–g for robustness checks) and provide very similar results to those presented here.
In addition to estimating treatment effects during the four-week StepUp Program, we also estimated treatment effects during the four-week post-intervention period. To measure the mean estimated effect of experimental conditions on post-intervention gym attendance, we ran a similar regression with an additional indicator term for the post-intervention period:
Here, is an indicator for whether participanti is both in experimental conditiong and the weekt is during the four-week post-intervention period, is the mean effect of experimental conditiong during the intervention period, is the mean effect of experimental conditiong during the four-week post-intervention period and all of the other variables are as defined above.
Across all analyses, to identify the most effective interventions, we conducted Wald tests to compare effects across all of the experimental conditions. Specifically, each Wald test assessed the null hypothesis that the estimated treatment effect of experimental conditiong (βg) minus the estimated treatment effect of experimental conditionk (βk) equalled 0.
Prediction study participants
Study 1: lay participants.
We recruited 301 workers from Prolific to answer questions about different gym programmes in exchange for US$1.25. Participants each made predictions about the effects of three experimental conditions from our megastudy, producing a total of 903 predictions and a mean of 17 predictions per condition. The participants had the following demographic characteristics: mean age = 30.8 (s.d. = 10.5); 55% female; mean years of work experience = 10.9 (s.d. = 9.8); 66% reported having a gym membership in the past 10 years; degree level: high school or less = 11.3%, some college = 28.9%, associate’s degree = 9.6%, bachelor’s degree = 38.9%, master’s, doctoral or professional degree = 11.3%. This study was preregistered and the preregistration is available in the ‘Data availability’ section.
Study 2: public health school faculty.
We recruited faculty members from the top 50 public health schools according to the 2019 U.S. News & World Report to participate in this study. We contacted 1,037 faculty members (assistant, associate or full professors) from the department in each of the schools that most closely aligned with behavioural health (such as social and behavioural sciences, health promotion and behaviour, exercise science and health policy). If there was not a relevant department listed, we selected faculty members on the basis of whether one of their listed areas of expertise fell under behavioural health. Faculty members were emailed with a request to complete a short survey to identify techniques that scientists believe effectively promote exercise. They were offered a chance to win a US$50 Amazon gift card and provided with a link to our survey; a reminder email was sent 3 d later.
A total of 156 faculty members (mean age = 48.3, s.d. = 10.7; 68% female; academic title: assistant professor = 35.9%, associate professor = 39.1%, full professor = 25.0%; 79% reported having a gym membership in the past 10 years; research expertise: health education = 13.5%, health policy = 11.5%, mental health = 12.2%, nutrition = 9.6%, physical activity = 10.9%, other = 42.3%) responded to our survey. They made a total of 465 predictions about the effects of experimental conditions from our megastudy, giving a mean of 9 predictions per experimental condition. The study was preregistered and the preregistration is available in the ‘Data availability’ section.
Study 3: behavioural science practitioners.
We recruited practitioners at leading for-profit and non-profit organizations with a specialty in the application of behavioural science to real world issues to participate in this study. Leaders at 15 different organizations were emailed a request to forward an invitation to participate in a short survey to their colleagues on a strictly volunteer basis. The email described the survey as asking for predictions about the efficacy of a random sample of three nudges designed to increase gym visits. A total of 90 practitioners (mean age = 33.2, s.d. = 7.2; 62% female; 85% reported having a gym membership in the past 10 years; mean years of work experience = 10.1, s.d. = 7.6; 71% reported a degree in behavioural science; reported frequency of using behavioural science at work: every day: 69.7%, often: 16.9%, sometimes: 10.1%, rarely: 2.3%, never: 1.1%) responded to our survey. They made a total of 270 predictions about the effects of the experimental conditions from our megastudy, giving a mean of 5 forecasts per experimental condition. The study was preregistered and the preregistration is available in the ‘Data availability’ section.
Prediction study content
Before beginning the survey (which was the same for all participant populations with the exception of the demographic questions asked at the end), potential participants were screened out if they reported being familiar with any of the results from the megastudy (which were featured on an episode of the Freakonomics Radio podcast32). The participants were first shown an overall description of the StepUp Program, and they were then asked to compare three of the megastudy’s experimental conditions with the placebo control condition (one at a time). The three conditions that the participants reviewed were randomly selected from the megastudy’s 53 experimental conditions and were presented in a random order.
For each experimental condition that they were prompted to examine, the participants were presented with a summary table comparing the key features of the experimental condition with the placebo control condition. The participants next viewed screenshots of the registration experience and a summary of the text messages and emails sent during the programme in both the experimental condition and the placebo control condition. Sample stimuli comparing the planning, reminders and microincentives to exercise condition with the placebo control condition are available in Prediction Study Stimuli on the Open Science Framework (https://osf.io/kyt7d/?view_only=8bb9282111c24f81a19c2237e7d7eba3). The participants were informed of how many days per week an average participant in the placebo control condition visited the gym during the StepUp Program as well as how likely a participant was to visit the gym in a given week, on average, in the placebo control condition. The participants were then asked to forecast the average number of days per week that gym members would visit the gym and the percentage of the time that members would visit the gym at least once in a given week in the StepUp Program experimental condition that they had just reviewed. Specifically, participants answered these two questions:
On average, how many days per week do you think members in the enhanced version of StepUp went to the gym? (For reference, people in the basic version went to the gym 1.5 days per week.)
In an average week, what percent of the time do you think members in the enhanced version of StepUp made it to the gym? (For reference, in a given week, members in the basic version of StepUp made it to the gym at least once 57% of the time)
For each study, our key dependent variable was the predicted increase in gym attendance induced by a given experimental condition (compared with the placebo control condition). To determine the extra number of gym visits per week that a participant predicted a condition would induce, we subtracted the placebo control condition’s mean of 1.5 d of gym visits per week from the participants’ estimated total weekly gym visits for a given experimental condition (the possible range of values was −1.5 to 5.5, as weeks include only 7 d). To determine the added likelihood of visiting the gym at least once in a given week that a participant predicted a condition would induce, we subtracted the placebo control condition’s mean visit likelihood of 57% from the participants’ estimated weekly visit likelihood for a given experimental condition (the possible range of values was −57% to 43% as the maximum likelihood was 100%). As any weekly gym attendance is not our primary focus, we present these results inExtended Data Fig. 1,Extended Data Tables 1–3 and7 andSupplementary Information 2. Finally, we computed an unweighted correlation between the actual regression-estimated change in gym attendance induced by a given experimental condition in our megastudy (see estimates inExtended Data Tables 6 and7) and the mean predicted change in gym attendance induced by that same experimental condition.
Extended Data
Extended Data Fig. 1|. Measured vs. predicted change in likelihood of gym visit in a given week.
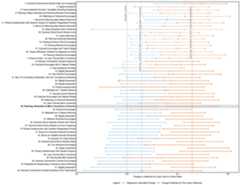
The measured change (blue) vs. change predicted by third-party observers (gold) in whether participants visited the gym that was induced by each of our megastudy’s 53 experimental conditions compared to a Placebo Control condition during a four-week intervention period is depicted here. Error bars represent 95% confidence intervals. SeeExtended Data Table 7 for complete OLS regression results graphed here in blue,Supplementary Information 11 for more details about the prediction data graphed here in gold, andSupplementary Table 1 for full descriptions of each treatment condition in our megastudy. Sample weights were included in the pooled third-party prediction data to ensure equal weighting of each of our three participant samples (professors, practitioners and prolific respondents). The superscripts a–e denote the different incentive amounts offered in different versions of the bonus for returning after missed workouts, higher incentives and rigidity rewarded conditions, which are described inSupplementary Table 1. In conditions with the same name, superscripts that come earlier in the alphabet indicate larger incentives.
Extended Data Table 1 |.
Regression-estimated effects of each experimental condition on whether participants visited the gym in a given week during the four-week intervention period relative to the Planning, Reminders and Micro-Incentives to Exercise condition
| Experimental Condition | b | SE | p-value | N |
|---|---|---|---|---|
| 03. Exercise Social Norms Shared (High and Increasing) | 0.071 | 0.026 | 0.006 | 798 |
| 02. Higher Incentivesa | 0.068 | 0.021 | 0.001 | 1,750 |
| 09. Free Audiobook Provided, Temptation Bundling Explained | 0.068 | 0.025 | 0.007 | 1,685 |
| 06. Planning Fallacy Described and Planning Revision Encouraged | 0.053 | 0.041 | 0.200 | 811 |
| 35. Reflecting on Workouts Encouraged | 0.051 | 0.026 | 0.051 | 517 |
| 01. Bonus for Returning after Missed Workoutsb | 0.050 | 0.024 | 0.038 | 1,633 |
| 11. Fitness Questionnaire with Decision Support & Cognitive Reappraisal Prompt | 0.047 | 0.031 | 0.123 | 825 |
| 05. Bonus for Returning after Missed Workoutsa | 0.045 | 0.027 | 0.099 | 1,719 |
| 13. Asked Questions about Workouts | 0.038 | 0.026 | 0.147 | 1,191 |
| 20. Exercise Social Norms Shared (Low) | 0.036 | 0.023 | 0.114 | 821 |
| 12. Values Affirmation | 0.025 | 0.028 | 0.364 | 824 |
| 36. Planning Workouts Rewarded | 0.025 | 0.026 | 0.340 | 1,466 |
| 10. Following Workout Plan Encouraged | 0.025 | 0.026 | 0.338 | 805 |
| 19. Planning Revision Encouraged | 0.024 | 0.024 | 0.328 | 860 |
| 21. Exercise Encouraged with Typed Pledge | 0.023 | 0.027 | 0.382 | 849 |
| 26. Values Affirmation Followed by Diagnosis as Gritty | 0.023 | 0.024 | 0.346 | 804 |
| 33. Planning Workouts Encouraged | 0.022 | 0.024 | 0.371 | 1,499 |
| 07. Choice of Gain- or Loss-Framed Micro-Incentives | 0.021 | 0.020 | 0.294 | 1,652 |
| 08. Exercise Commitment Contract Explained | 0.020 | 0.030 | 0.504 | 810 |
| 42. Exercise Encouraged with E-Signed Pledge | 0.016 | 0.029 | 0.586 | 878 |
| 04. Free Audiobook Provided | 0.014 | 0.037 | 0.701 | 1,604 |
| 14. Rigidity Rewardeda | 0.011 | 0.025 | 0.653 | 1,816 |
| 34. Gym Routine Encouraged | 0.009 | 0.029 | 0.755 | 820 |
| 41. Mon-Fri Consistency Rewarded, Sat-Sun Consistency Rewarded | 0.008 | 0.022 | 0.727 | 564 |
| 24. Rigidity Rewardede | 0.006 | 0.028 | 0.831 | 548 |
| 28. Rigidity Rewardedc | 0.005 | 0.026 | 0.836 | 1,701 |
| 18. Fitness Questionnaire | 0.004 | 0.023 | 0.864 | 799 |
| 46. Defaulted into 1 Weekly Workout | 0.003 | 0.025 | 0.891 | 455 |
| 17. Exercise Advice Solicited | 0.003 | 0.025 | 0.903 | 749 |
| 25. Exercise Encouraged with Signed Pledge | 0.003 | 0.031 | 0.924 | 802 |
| 39. Reflecting on Workouts Rewarded | 0.002 | 0.022 | 0.927 | 469 |
| 22. Gain-Framed Micro-Incentives | 0.000 | 0.027 | 0.986 | 783 |
| 32. Exercise Encouraged | −0.001 | 0.028 | 0.973 | 806 |
| 15. Defaulted into 3 Weekly Workouts | −0.001 | 0.023 | 0.965 | 477 |
| 48. Rigidity Rewardedd | −0.004 | 0.024 | 0.880 | 1,613 |
| 37. Effective Workouts Encouraged | −0.007 | 0.023 | 0.768 | 852 |
| 52. Exercise Advice Solicited, Shared with Others | −0.009 | 0.031 | 0.780 | 707 |
| 47. Exercise Social Norms Shared (Low but Increasing) | −0.009 | 0.026 | 0.723 | 835 |
| 31. Fitness Questionnaire with Cognitive Reappraisal Prompt | −0.011 | 0.026 | 0.680 | 868 |
| 27. Bonus for Consistent Exercise Schedule | −0.013 | 0.027 | 0.635 | 798 |
| 43. Bonus for Variable Exercise Schedule | −0.016 | 0.026 | 0.529 | 865 |
| 16. Exercise Fun Facts Shared | −0.019 | 0.027 | 0.478 | 836 |
| 53. Exercise Social Norms Shared (High) | −0.022 | 0.023 | 0.340 | 841 |
| 40. Fun Workouts Encouraged | −0.023 | 0.026 | 0.381 | 770 |
| 23. Higher Incentivesb | −0.024 | 0.027 | 0.379 | 1,910 |
| 50. Fitness Questionnaire with Decision Support | −0.024 | 0.027 | 0.374 | 893 |
| 29. Loss-Framed Micro-Incentives | −0.025 | 0.025 | 0.309 | 872 |
| 38. Planning Benefits Explained | −0.025 | 0.035 | 0.473 | 859 |
| 54. Placebo Control | −0.029 | 0.015 | 0.055 | 4,992 |
| 49. Exercise Commitment Contract Encouraged | −0.031 | 0.030 | 0.301 | 812 |
| 45. Rewarded for Responding to Questions about Workouts | −0.036 | 0.028 | 0.208 | 1,199 |
| 51. Rigidity Rewardedb | −0.042 | 0.032 | 0.188 | 1,850 |
| 44. Exercise Commitment Contract Explained Post-Intervention | −0.056 | 0.032 | 0.074 | 828 |
| Number of observations | 2,397,729 | |||
| Number of participants | 61,293 | |||
| R2 | 0.445 | |||
The table reports the results of an ordinary least squares regression predicting whether participants visited the gym in a given week during the four-week intervention period with indicators for experimental condition during the four-week intervention period, participants fixed effects, and cohort-week interactions. Robust standard errors were clustered by participant. Observations in the regression were weighted to ensure that each condition was equally weighted within a cohort and each cohort was weighted proportionally to its length. The reference group was the Planning, Reminders, and Micro-Incentives to Exercise condition. SeeTable S1 in theSupplementary Information for descriptions of each experimental condition.
These superscripts denote the different incentive amounts offered in different versions of the Bonus for Returning after Missed Workouts, Higher Incentives, and Rigidity Rewarded conditions, which are detailed inTable S1 in theSupplementary Information. In conditions with the same name, superscripts that come earlier in the alphabet indicate larger incentives.
Extended Data Table 2 |.
Regression-estimated effects of each experimental condition on whether participants visited the gym in a given week during the four-week post-intervention period relative to the Placebo Control condition
| Experimental Condition | b | SE | p-value | N |
|---|---|---|---|---|
| 01. Bonus for Returning after Missed Workoutsb | 0.085 | 0.026 | 0.001 | 1,633 |
| 03. Exercise Social Norms Shared (High and Increasing) | 0.077 | 0.027 | 0.005 | 798 |
| 06. Planning Fallacy Described and Planning Revision Encouraged | 0.061 | 0.036 | 0.091 | 811 |
| 04. Free Audiobook Provided | 0.058 | 0.031 | 0.060 | 1,604 |
| 20. Exercise Social Norms Shared (Low) | 0.048 | 0.023 | 0.042 | 821 |
| 02. Higher Incentivesa | 0.046 | 0.025 | 0.065 | 1,750 |
| 11. Fitness Questionnaire with Decision Support & Cognitive Reappraisal Prompt | 0.045 | 0.024 | 0.054 | 825 |
| 09. Free Audiobook Provided, Temptation Bundling Explained | 0.045 | 0.025 | 0.071 | 1,685 |
| 10. Following Workout Plan Encouraged | 0.044 | 0.026 | 0.086 | 805 |
| 26. Values Affirmation Followed by Diagnosis as Gritty | 0.039 | 0.023 | 0.092 | 804 |
| 18. Fitness Questionnaire | 0.038 | 0.025 | 0.127 | 799 |
| 33. Planning Workouts Encouraged | 0.037 | 0.020 | 0.063 | 1,499 |
| 25. Exercise Encouraged with Signed Pledge | 0.034 | 0.026 | 0.196 | 802 |
| 52. Exercise Advice Solicited, Shared with Others | 0.032 | 0.035 | 0.371 | 707 |
| 24. Rigidity Rewardede | 0.027 | 0.021 | 0.208 | 548 |
| 43. Bonus for Variable Exercise Schedule | 0.026 | 0.025 | 0.301 | 865 |
| 12. Values Affirmation | 0.024 | 0.024 | 0.326 | 824 |
| 37. Effective Workouts Encouraged | 0.022 | 0.024 | 0.364 | 852 |
| 28. Rigidity Rewardedc | 0.020 | 0.023 | 0.385 | 1,701 |
| 47. Exercise Social Norms Shared (Low but Increasing) | 0.020 | 0.025 | 0.427 | 835 |
| 16. Exercise Fun Facts Shared | 0.017 | 0.026 | 0.510 | 836 |
| 41. Mon-Fri Consistency Rewarded, Sat-Sun Consistency Rewarded | 0.013 | 0.022 | 0.550 | 564 |
| 22. Gain-Framed Micro-Incentives | 0.013 | 0.025 | 0.608 | 783 |
| 05. Bonus for Returning after Missed Workoutsa | 0.012 | 0.026 | 0.655 | 1,719 |
| 13. Asked Questions about Workouts | 0.009 | 0.022 | 0.673 | 1,191 |
| 21. Exercise Encouraged with Typed Pledge | 0.008 | 0.027 | 0.780 | 849 |
| 35. Reflecting on Workouts Encouraged | 0.007 | 0.022 | 0.748 | 517 |
| 46. Defaulted into 1 Weekly Workout | 0.006 | 0.029 | 0.832 | 455 |
| 42. Exercise Encouraged with E-Signed Pledge | 0.006 | 0.023 | 0.790 | 878 |
| 50. Fitness Questionnaire with Decision Support | 0.004 | 0.024 | 0.866 | 893 |
| 49. Exercise Commitment Contract Encouraged | 0.004 | 0.028 | 0.889 | 812 |
| 17. Exercise Advice Solicited | 0.003 | 0.025 | 0.891 | 749 |
| 27. Bonus for Consistent Exercise Schedule | 0.002 | 0.025 | 0.924 | 798 |
| 31. Fitness Questionnaire with Cognitive Reappraisal Prompt | 0.000 | 0.025 | 0.999 | 868 |
| 15. Defaulted into 3 Weekly Workouts | 0.000 | 0.023 | 0.999 | 477 |
| 07. Choice of Gain- or Loss-Framed Micro-Incentives | 0.000 | 0.017 | 0.991 | 1,652 |
| 36. Planning Workouts Rewarded | −0.001 | 0.026 | 0.978 | 1,466 |
| 23. Higher Incentivesb | −0.002 | 0.022 | 0.931 | 1,910 |
| 19. Planning Revision Encouraged | −0.004 | 0.025 | 0.886 | 860 |
| 40. Fun Workouts Encouraged | −0.004 | 0.026 | 0.891 | 770 |
| 48. Rigidity Rewardedd | −0.005 | 0.022 | 0.827 | 1,613 |
| 14. Rigidity Rewardeda | −0.008 | 0.025 | 0.746 | 1,816 |
| 45. Rewarded for Responding to Questions about Workouts | −0.008 | 0.029 | 0.775 | 1,199 |
| 32. Exercise Encouraged | −0.014 | 0.024 | 0.569 | 806 |
| 34. Gym Routine Encouraged | −0.015 | 0.032 | 0.647 | 820 |
| 08. Exercise Commitment Contract Explained | −0.017 | 0.028 | 0.533 | 810 |
| 30. Planning, Reminders & Micro-Incentives to Exercise | −0.021 | 0.016 | 0.181 | 3,503 |
| 39. Reflecting on Workouts Rewarded | −0.027 | 0.027 | 0.314 | 469 |
| 51. Rigidity Rewardedb | −0.030 | 0.028 | 0.296 | 1,850 |
| 44. Exercise Commitment Contract Explained Post-Intervention | −0.040 | 0.029 | 0.162 | 828 |
| 38. Planning Benefits Explained | −0.048 | 0.028 | 0.089 | 859 |
| 29. Loss-Framed Micro-Incentives | −0.051 | 0.024 | 0.033 | 872 |
| 53. Exercise Social Norms Shared (High) | −0.063 | 0.024 | 0.008 | 841 |
| Number of observations | 2,642,901 | |||
| Number of participants | 61,293 | |||
| R2 | 0.426 | |||
The table reports the results of an ordinary least squares regression predicting whether participants visited the gym during a given week in the first four weeks after the intervention period with indicators for experimental condition during the four-week intervention period, indicators for experimental condition during the first four weeks post-intervention, participants fixed effects, and cohort-week interactions. Robust standard errors were clustered by participant. Observations in the regression were weighted to ensure that each condition was equally weighted within a cohort and each cohort was weighted proportionally to its length. The reference group was the Placebo Control condition. SeeTable S1 in theSupplementary Information for descriptions of each experimental condition.
These superscripts denote the different incentive amounts offered in different versions of the Bonus for Returning after Missed Workouts, Higher Incentives, and Rigidity Rewarded conditions, which are detailed inTable S1 in theSupplementary Information. In conditions with the same name, superscripts that come earlier in the alphabet indicate larger incentives.
Extended Data Table 3 |.
The percentage of other conditions that each experimental condition outperformed for our dependent variable measuring whether participants visited the gym in a given week at p < .05 during the four-week intervention period
| Experimental Condition | % of Conditions Outperformed (p<.05) | List of Conditions Outperformed |
|---|---|---|
| 01. Bonus for Returning after Missed Workoutsb | 30% | 17*, 23*, 27*, 29-31*, 37*, 40*, 43*, 49*, 50*, 53*; 44**, 45**, 51**; 54*** |
| 02. Higher Incentivesa | 62% | 7*, 14*, 16*, 18*, 22*, 24*, 25*, 28*, 32*, 38*, 41*, 46*, 52*; 15**, 17**, 23**, 27**, 31**, 37**, 39**, 40**, 43**, 47-50**; 29***, 30***, 44***, 45***, 51***, 53***, 54*** |
| 03. Exercise Social Norms Shared (High and Increasing) | 55% | 15*, 16*, 18*, 22*, 27*, 28*, 31*, 32*, 38*, 39*, 41*, 46-48*, 52*; 17**, 23**, 29**, 30**, 37**, 40**, 43**, 45**, 49-51**, 53**; 44***, 54*** |
| 04. Free Audiobook Provided | 0% | |
| 05. Bonus for Returning after Missed Workoutsa | 19% | 23*, 29*, 40*, 45*, 49-51*, 53*; 44**, 54** |
| 06. Planning Fallacy Described and Planning Revision Encouraged | 4% | 44*, 54* |
| 07. Choice of Gain- or Loss-Framed Micro-Incentives | 4% | 44*; 54** |
| 08. Exercise Commitment Contract Explained | 0% | |
| 09. Free Audiobook Provided, Temptation Bundling Explained | 55% | 15*, 16*, 18*, 22*, 27*, 28*, 31*, 32*, 38*, 39*, 41*, 46-48*, 52*; 17**, 23**, 29**, 30**, 37**, 40**, 43**, 45**, 49-51**, 53**; 44***, 54*** |
| 10. Following Workout Plan Encouraged | 4% | 44*, 54* |
| 11. Fitness Questionnaire with Decision Support & Cognitive Reappraisal Prompt | 13% | 29*, 45*, 49*, 51*, 53*; 44**, 54** |
| 12. Values Affirmation | 4% | 44*, 54* |
| 13. Asked Questions about Workouts | 11% | 29*, 44*, 45*, 51*, 53*; 54** |
| 14. Rigidity Rewardeda | 0% | |
| 15. Defaulted into 3 Weekly Workouts | 0% | |
| 16. Exercise Fun Facts Shared | 0% | |
| 17. Exercise Advice Solicited | 0% | |
| 18. Fitness Questionnaire | 0% | |
| 19. Planning Revision Encouraged | 4% | 44*, 54* |
| 20. Exercise Social Norms Shared (Low) | 19% | 23*, 29*, 40*, 45*, 49-51*, 53*; 44**, 54** |
| 21. Exercise Encouraged with Typed Pledge | 4% | 44*, 54* |
| 22. Gain-Framed Micro-Incentives | 0% | |
| 23. Higher Incentivesb | 0% | |
| 24. Rigidity Rewardede | 0% | |
| 25. Exercise Encouraged with Signed Pledge | 0% | |
| 26. Values Affirmation Followed by Diagnosis as Gritty | 4% | 44*, 54* |
| 27. Bonus for Consistent Exercise Schedule | 0% | |
| 28. Rigidity Rewardedc | 0% | |
| 29. Loss-Framed Micro-Incentives | 0% | |
| 30. Planning, Reminders & Micro-Incentives to Exercise | 0% | |
| 31. Fitness Questionnaire with Cognitive Reappraisal Prompt | 0% | |
| 32. Exercise Encouraged | 0% | |
| 33. Planning Workouts Encouraged | 4% | 44*, 54* |
| 34. Gym Routine Encouraged | 0% | |
| 35. Reflecting on Workouts Encouraged | 25% | 17*, 23*, 29*, 37*, 40*, 43*, 45*, 49-51*, 53*; 44**; 54*** |
| 36. Planning Workouts Rewarded | 4% | 44*, 54* |
| 37. Effective Workouts Encouraged | 0% | |
| 38. Planning Benefits Explained | 0% | |
| 39. Reflecting on Workouts Rewarded | 0% | |
| 40. Fun Workouts Encouraged | 0% | |
| 41. Mon-Fri Consistency Rewarded, Sat-Sun Consistency Rewarded | 0% | |
| 42. Exercise Encouraged with E-Signed Pledge | 0% | |
| 43. Bonus for Variable Exercise Schedule | 0% | |
| 44. Exercise Commitment Contract Explained Post-Intervention | 0% | |
| 45. Rewarded for Responding to Questions about Workouts | 0% | |
| 46. Defaulted into 1 Weekly Workout | 0% | |
| 47. Exercise Social Norms Shared (Low but Increasing) | 0% | |
| 48. Rigidity Rewardedd | 0% | |
| 49. Exercise Commitment Contract Encouraged | 0% | |
| 50. Fitness Questionnaire with Decision Support | 0% | |
| 51. Rigidity Rewardedb | 0% | |
| 52. Exercise Advice Solicited, Shared with Others | 0% | |
| 53. Exercise Social Norms Shared (High) | 0% | |
| 54. Placebo Control | 0% |
The percentage of conditions outperformed (p < .05) was obtained from conducting pairwise Wald tests to assess whether paired regression coefficients significantly differed from one another in the regression presented inExtended Data Table 7.
These superscripts denote the different incentive amounts offered in different versions of the Bonus for Returning after Missed Workouts, Higher Incentives, and Rigidity Rewarded conditions, which are detailed inTable S1 in theSupplementary Information. In conditions with the same name, superscripts that come earlier in the alphabet indicate larger incentives.
Extended Data Table 4 |.
Participants’ mean age (in years), gender, length of gym membership (in weeks), and mean weekly gym visits in the four-week pre-intervention period across the 54 study conditions
| Experimental Condition | Sample Size | Age | Female (%) | White (%) | Weeks since Joining 24HF | Weekly Gym Visits Four Weeks before Intervention |
|---|---|---|---|---|---|---|
| 1. Bonus for Returning after Missed Workoutsb | 1,633 | 40.0 (13.6) | 64.7% | 48.9% | 35.9 (20.3) | 1.1 (1.4) |
| 2. Higher Incentivesa | 1,750 | 39.7 (13.1) | 65.4% | 47.1% | 36.6 (20.2) | 1.3 (1.5) |
| 3. Exercise Social Norms Shared (High and Increasing) | 798 | 38.8 (13.4) | 66.3% | 50.3% | 34.8 (20.6) | 1.3 (1.5) |
| 4. Free Audiobook Provided | 1,604 | 39.6 (13.4) | 63.5% | 50.7% | 35.9 (20.3) | 1.2 (1.5) |
| 5. Bonus for Returning after Missed Workoutsa | 1,719 | 39.8 (13.9) | 65.6% | 48.8% | 35.5 (20.5) | 1.1 (1.4) |
| 6. Planning Fallacy Described and Planning Revision Encouraged | 811 | 40.4 (13.9) | 67.2% | 49.1% | 36.4 (20.0) | 1.3 (1.5) |
| 7. Choice of Gain- or Loss-Framed Micro-Incentives | 1,652 | 38.1 (12.8) | 66.5% | 46.7% | 33.8 (21.5) | 1.3 (1.4) |
| 8. Exercise Commitment Contract Explained | 810 | 40.9 (13.5) | 69.0% | 52.8% | 34.9 (20.5) | 1.1 (1.4) |
| 9. Free Audiobook Provided, Temptation Bundling Explained | 1,685 | 39.6 (13.3) | 63.6% | 49.8% | 36.9 (19.9) | 1.2 (1.4) |
| 10. Following Workout Plan Encouraged | 805 | 38.6 (13.0) | 60.9% | 49.8% | 31.7 (21.9) | 1.2 (1.5) |
| 11. Fitness Questionnaire with Decision Support & Cognitive Reappraisal Prompt | 825 | 39.3 (13.2) | 67.5% | 50.3% | 35.2 (20.5) | 1.4 (1.5) |
| 12. Values Affirmation | 824 | 38.1 (12.8) | 64.9% | 51.8% | 34.5 (20.8) | 1.4 (1.6) |
| 13. Asked Questions about Workouts | 1,191 | 37.6 (12.3) | 69.6% | 49.0% | 32.3 (21.5) | 1.3 (1.5) |
| 14. Rigidity Rewardeda | 1,816 | 38.9 (13.2) | 65.9% | 48.7% | 34.8 (20.8) | 1.3 (1.5) |
| 15. Defaulted into 3 Weekly Workouts | 477 | 39.0 (13.1) | 68.1% | 48.8% | 34.7 (20.6) | 1.3 (1.4) |
| 16. Exercise Fun Facts Shared | 836 | 38.0 (13.0) | 65.8% | 48.7% | 35.3 (20.3) | 1.4 (1.5) |
| 17. Exercise Advice Solicited | 749 | 39.9 (13.4) | 66.2% | 51.0% | 34.8 (20.6) | 1.3 (1.5) |
| 18. Fitness Questionnaire | 799 | 39.4 (13.6) | 66.0% | 47.7% | 35.3 (20.9) | 1.3 (1.5) |
| 19. Planning Revision Encouraged | 860 | 39.5 (13.2) | 64.4% | 47.3% | 36.3 (20.2) | 1.3 (1.5) |
| 20. Exercise Social Norms Shared (Low) | 821 | 39.0 (13.1) | 65.2% | 50.3% | 35.2 (20.5) | 1.4 (1.5) |
| 21. Exercise Encouraged with Typed Pledge | 849 | 39.2 (13.2) | 68.7% | 53.1% | 34.3 (21.1) | 1.3 (1.5) |
| 22. Gain-Framed Micro-Incentives | 783 | 38.7 (12.9) | 69.2% | 48.9% | 33.7 (21.0) | 1.3 (1.5) |
| 23. Higher Incentivesb | 1,910 | 39.5 (13.1) | 64.9% | 50.8% | 35.6 (20.6) | 1.3 (1.5) |
| 24. Rigidity Rewardede | 548 | 38.8 (13.2) | 62.8% | 50.7% | 35.3 (20.8) | 1.2 (1.5) |
| 25. Exercise Encouraged with Signed Pledge | 802 | 38.6 (13.1) | 65.2% | 50.9% | 33.7 (21.2) | 1.3 (1.5) |
| 26. Values Affirmation Followed by Diagnosis as Gritty | 804 | 37.3 (12.1) | 68.5% | 49.4% | 35.1 (20.3) | 1.3 (1.5) |
| 27. Bonus for Consistent Exercise Schedule | 798 | 39.4 (13.4) | 65.9% | 51.4% | 34.7 (21.0) | 1.2 (1.4) |
| 28. Rigidity Rewardedc | 1,701 | 39.7 (13.3) | 67.6% | 51.5% | 37.1 (19.9) | 1.2 (1.4) |
| 29. Loss-Framed Micro-Incentives | 872 | 38.6 (12.8) | 67.7% | 46.6% | 32.7 (21.6) | 1.3 (1.5) |
| 30. Planning, Reminders & Micro-Incentives to Exercise | 3,503 | 39.2 (13.3) | 66.5% | 51.2% | 35.4 (20.3) | 1.3 (1.5) |
| 31. Fitness Questionnaire with Cognitive Reappraisal Prompt | 868 | 39.9 (13.8) | 65.2% | 50.2% | 34.6 (20.9) | 1.3 (1.5) |
| 32. Exercise Encouraged | 806 | 38.2 (12.7) | 66.7% | 49.3% | 34.9 (20.5) | 1.3 (1.5) |
| 33. Planning Workouts Encouraged | 1,499 | 40.5 (13.9) | 65.1% | 51.2% | 35.6 (20.6) | 1.2 (1.4) |
| 34. Gym Routine Encouraged | 820 | 39.2 (13.1) | 66.6% | 48.2% | 35.2 (20.9) | 1.3 (1.5) |
| 35. Reflecting on Workouts Encouraged | 517 | 38.3 (12.8) | 64.0% | 47.4% | 35.4 (20.6) | 1.2 (1.4) |
| 36. Planning Workouts Rewarded | 1,466 | 40.2 (13.9) | 66.4% | 50.1% | 35.5 (20.9) | 1.2 (1.4) |
| 37. Effective Workouts Encouraged | 852 | 37.8 (12.8) | 63.7% | 47.5% | 33.0 (21.6) | 1.4 (1.5) |
| 38. Planning Benefits Explained | 859 | 38.2 (13.3) | 66.2% | 49.4% | 33.1 (21.7) | 1.3 (1.4) |
| 39. Reflecting on Workouts Rewarded | 469 | 37.6 (12.0) | 67.4% | 44.1% | 34.2 (21.3) | 1.3 (1.5) |
| 40. Fun Workouts Encouraged | 770 | 38.2 (13.3) | 64.9% | 49.0% | 32.8 (21.5) | 1.5 (1.6) |
| 41. Mon-Fri Consistency Rewarded, Sat-Sun Consistency Rewarded | 564 | 39.0 (13.5) | 62.4% | 53.2% | 36.4 (20.5) | 1.3 (1.6) |
| 42. Exercise Encouraged with E-Signed Pledge | 878 | 38.4 (13.2) | 64.8% | 49.7% | 33.5 (20.7) | 1.3 (1.5) |
| 43. Bonus for Variable Exercise Schedule | 865 | 39.9 (13.6) | 67.3% | 48.2% | 34.5 (21.1) | 1.3 (1.5) |
| 44. Exercise Commitment Contract Explained Post-Intervention | 828 | 40.3 (13.6) | 67.4% | 54.1% | 35.8 (20.1) | 1.2 (1.4) |
| 45. Rewarded for Responding to Questions about Workouts | 1,199 | 38.1 (12.9) | 66.9% | 50.8% | 33.4 (21.4) | 1.4 (1.6) |
| 46. Defaulted into 1 Weekly Workout | 455 | 38.6 (13.0) | 64.6% | 56.5% | 34.8 (20.7) | 1.3 (1.6) |
| 47. Exercise Social Norms Shared (Low but Increasing) | 835 | 38.3 (12.7) | 65.4% | 47.2% | 35.4 (20.5) | 1.4 (1.6) |
| 48. Rigidity Rewardedd | 1,613 | 39.9 (13.5) | 64.6% | 52.3% | 36.5 (20.5) | 1.2 (1.5) |
| 49. Exercise Commitment Contract Encouraged | 812 | 40.4 (14.4) | 65.9% | 51.1% | 35.6 (20.4) | 1.3 (1.5) |
| 50. Fitness Questionnaire with Decision Support | 893 | 39.5 (13.5) | 65.7% | 49.2% | 36.2 (20.5) | 1.2 (1.5) |
| 51. Rigidity Rewardedb | 1,850 | 39.1 (13.1) | 64.9% | 50.4% | 36.5 (20.1) | 1.3 (1.5) |
| 52. Exercise Advice Solicited, Shared with Others | 707 | 38.7 (12.9) | 65.3% | 49.4% | 33.2 (21.9) | 1.2 (1.5) |
| 53. Exercise Social Norms Shared (High) | 841 | 38.3 (13.4) | 68.1% | 46.8% | 36.3 (19.6) | 1.4 (1.6) |
| 54. Placebo Control | 4,992 | 38.9 (13.0) | 66.0% | 49.6% | 35.3 (20.6) | 1.3 (1.5) |
| Overall | 61,293 | 39.1 (13.3) | 65.9% | 49.8% | 35.1 (20.7) | 1.3 (1.5) |
Standard deviations for means are reported in parentheses. For summary statistics in this table, mean weekly gym visits prior to the intervention were calculated with a balanced panel constructed by inserting 0’s for weeks with no recorded gym visits. Conditions are numbered in descending order based on the beta coefficients from our primary analysis reported in the paper and inExtended Data Table 6, and the Placebo Control is always labeled 54. The values shown in the table are unweighted.
These superscripts denote the different incentive amounts offered in different versions of the Bonus for Returning after Missed Workouts, Higher Incentives, and Rigidity Rewarded conditions, which are detailed inTable S1 in theSupplementary Information. In conditions with the same name, superscripts that come earlier in the alphabet indicate larger incentives.
Extended Data Table 5 |.
Percentage of significant p-values and absolute difference in coefficients from pairwise comparisons of the 54 study conditions in our megastudy on each variable listed (alpha = .05)
| Percentage of Paired Tests Yielding Significant Results | F-testp-value | Average Absolute Difference in Pairwise Coefficients | |
|---|---|---|---|
| Age (years) | 7.1% | 0.21 | 0.91 |
| Membership Tenure at 24 Hour Fitness (weeks) | 2.8% | 0.85 | 1.26 |
| Average Weekly Gym Visits in 4 Weeks Before Intervention | 1.9% | 0.98 | 0.08 |
| Percent Female | 4.1% | 0.74 | 0.03 |
| Overall | 4.0% | ||
The table summarizes the results of Wald tests of equality for all pairwise comparisons of the 54 megastudy conditions based on ordinary least squares regressions testing if the composition of participants in these experimental conditions differed by age, membership tenure at 24 Hour Fitness, mean weekly gym visits in the four weeks prior to the start of the intervention, and gender. Regressions included robust standard errors. Observations in the regressions were weighted to ensure that each condition was weighted equally within a cohort and each cohort was weighted proportionally to its length.
Extended Data Table 6 |.
Regression-estimated effects of each experimental condition on total weekly gym visits during the four-week intervention period relative to the Placebo Control condition
| Experimental Condition | b | SE | p-value | N |
|---|---|---|---|---|
| 01. Bonus for Returning after Missed Workoutsb | 0.403 | 0.098 | <0.001 | 1,633 |
| 02. Higher Incentivesa | 0.365 | 0.092 | <0.001 | 1,750 |
| 03. Exercise Social Norms Shared (High and Increasing) | 0.345 | 0.083 | <0.001 | 798 |
| 04. Free Audiobook Provided | 0.343 | 0.123 | 0.005 | 1,604 |
| 05. Bonus for Returning after Missed Workoutsa | 0.336 | 0.081 | <0.001 | 1,719 |
| 06. Planning Fallacy Described and Planning Revision Encouraged | 0.325 | 0.122 | 0.008 | 811 |
| 07. Choice of Gain- or Loss-Framed Micro-Incentives | 0.284 | 0.055 | <0.001 | 1,652 |
| 08. Exercise Commitment Contract Explained | 0.279 | 0.095 | 0.003 | 810 |
| 09. Free Audiobook Provided, Temptation Bundling Explained | 0.278 | 0.077 | <0.001 | 1,685 |
| 10. Following Workout Plan Encouraged | 0.268 | 0.083 | 0.001 | 805 |
| 11. Fitness Questionnaire with Decision Support & Cognitive Reappraisal Prompt | 0.255 | 0.081 | 0.002 | 825 |
| 12. Values Affirmation | 0.243 | 0.095 | 0.011 | 824 |
| 13. Asked Questions about Workouts | 0.236 | 0.112 | 0.036 | 1,191 |
| 14. Rigidity Rewardeda | 0.230 | 0.080 | 0.004 | 1,816 |
| 15. Defaulted into 3 Weekly Workouts | 0.213 | 0.085 | 0.012 | 477 |
| 16. Exercise Fun Facts Shared | 0.207 | 0.084 | 0.013 | 836 |
| 17. Exercise Advice Solicited | 0.207 | 0.084 | 0.014 | 749 |
| 18. Fitness Questionnaire | 0.206 | 0.080 | 0.009 | 799 |
| 19. Planning Revision Encouraged | 0.196 | 0.087 | 0.025 | 860 |
| 20. Exercise Social Norms Shared (Low) | 0.193 | 0.077 | 0.012 | 821 |
| 21. Exercise Encouraged with Typed Pledge | 0.191 | 0.108 | 0.076 | 849 |
| 22. Gain-Framed Micro-Incentives | 0.180 | 0.090 | 0.045 | 783 |
| 23. Higher Incentivesb | 0.175 | 0.078 | 0.025 | 1,910 |
| 24. Rigidity Rewardede | 0.167 | 0.083 | 0.043 | 548 |
| 25. Exercise Encouraged with Signed Pledge | 0.156 | 0.099 | 0.115 | 802 |
| 26. Values Affirmation Followed by Diagnosis as Gritty | 0.155 | 0.082 | 0.060 | 804 |
| 27. Bonus for Consistent Exercise Schedule | 0.151 | 0.088 | 0.087 | 798 |
| 28. Rigidity Rewardedc | 0.142 | 0.076 | 0.060 | 1,701 |
| 29. Loss-Framed Micro-Incentives | 0.139 | 0.077 | 0.071 | 872 |
| 30. Planning, Reminders & Micro-Incentives to Exercise | 0.136 | 0.049 | 0.006 | 3,503 |
| 31. Fitness Questionnaire with Cognitive Reappraisal Prompt | 0.134 | 0.079 | 0.088 | 868 |
| 32. Exercise Encouraged | 0.132 | 0.088 | 0.135 | 806 |
| 33. Planning Workouts Encouraged | 0.131 | 0.071 | 0.064 | 1,499 |
| 34. Gym Routine Encouraged | 0.129 | 0.086 | 0.135 | 820 |
| 35. Reflecting on Workouts Encouraged | 0.122 | 0.084 | 0.146 | 517 |
| 36. Planning Workouts Rewarded | 0.118 | 0.078 | 0.129 | 1,466 |
| 37. Effective Workouts Encouraged | 0.112 | 0.069 | 0.104 | 852 |
| 38. Planning Benefits Explained | 0.111 | 0.096 | 0.248 | 859 |
| 39. Reflecting on Workouts Rewarded | 0.109 | 0.083 | 0.190 | 469 |
| 40. Fun Workouts Encouraged | 0.100 | 0.072 | 0.167 | 770 |
| 41. Mon-Fri Consistency Rewarded, Sat-Sun Consistency Rewarded | 0.095 | 0.075 | 0.203 | 564 |
| 42. Exercise Encouraged with E-Signed Pledge | 0.088 | 0.089 | 0.321 | 878 |
| 43. Bonus for Variable Exercise Schedule | 0.083 | 0.093 | 0.373 | 865 |
| 44. Exercise Commitment Contract Explained Post-Intervention | 0.076 | 0.081 | 0.346 | 828 |
| 45. Rewarded for Responding to Questions about Workouts | 0.066 | 0.084 | 0.432 | 1,199 |
| 46. Defaulted into 1 Weekly Workout | 0.062 | 0.094 | 0.510 | 455 |
| 47. Exercise Social Norms Shared (Low but Increasing) | 0.052 | 0.078 | 0.509 | 835 |
| 48. Rigidity Rewardedd | 0.045 | 0.079 | 0.568 | 1,613 |
| 49. Exercise Commitment Contract Encouraged | 0.035 | 0.083 | 0.671 | 812 |
| 50. Fitness Questionnaire with Decision Support | 0.025 | 0.080 | 0.757 | 893 |
| 51. Rigidity Rewardedb | 0.003 | 0.083 | 0.967 | 1,850 |
| 52. Exercise Advice Solicited, Shared with Others | 0.001 | 0.089 | 0.987 | 707 |
| 53. Exercise Social Norms Shared (High) | −0.030 | 0.137 | 0.827 | 841 |
| Number of observations | 2,397,729 | |||
| Number of participants | 61,293 | |||
| R2 | 0.574 | |||
The table reports the results of an ordinary least squares regression predicting participants’ weekly gym visits during the four-week intervention period with indicators for experimental condition during the four-week intervention period, participants fixed effects, and cohort-week interactions. Robust standard errors were clustered by participant. Observations in the regression were weighted to ensure that each condition was equally weighted within a cohort and each cohort was weighted proportionally to its length. The reference group was the Placebo Control condition. SeeTable S1 in theSupplementary Information for descriptions of each experimental condition.
These superscripts denote the different incentive amounts offered in different versions of the Bonus for Returning after Missed Workouts, Higher Incentives, and Rigidity Rewarded conditions, which are detailed inTable S1 in theSupplementary Information. In conditions with the same name, superscripts that come earlier in the alphabet indicate larger incentives.
Extended Data Table 7 |.
Regression-estimated effects of each experimental condition on whether participants visited the gym in a given week during the four-week intervention period relative to the Placebo Control condition
| Experimental Condition | b | SE | p-value | N |
|---|---|---|---|---|
| 03. Exercise Social Norms Shared (High and Increasing) | 0.100 | 0.024 | <0.001 | 798 |
| 02. Higher Incentivesa | 0.097 | 0.018 | <0.001 | 1,750 |
| 09. Free Audiobook Provided, Temptation Bundling Explained | 0.097 | 0.023 | <0.001 | 1,685 |
| 06. Planning Fallacy Described and Planning Revision Encouraged | 0.082 | 0.040 | 0.040 | 811 |
| 35. Reflecting on Workouts Encouraged | 0.080 | 0.024 | 0.001 | 517 |
| 01. Bonus for Returning after Missed Workoutsb | 0.079 | 0.022 | <0.001 | 1,633 |
| 11. Fitness Questionnaire with Decision Support & Cognitive Reappraisal Prompt | 0.076 | 0.029 | 0.008 | 825 |
| 05. Bonus for Returning after Missed Workoutsa | 0.074 | 0.025 | 0.004 | 1,719 |
| 13. Asked Questions about Workouts | 0.067 | 0.024 | 0.005 | 1,191 |
| 20. Exercise Social Norms Shared (Low) | 0.065 | 0.020 | 0.001 | 821 |
| 12. Values Affirmation | 0.054 | 0.026 | 0.037 | 824 |
| 36. Planning Workouts Rewarded | 0.054 | 0.024 | 0.026 | 1,466 |
| 10. Following Workout Plan Encouraged | 0.054 | 0.024 | 0.024 | 805 |
| 19. Planning Revision Encouraged | 0.053 | 0.022 | 0.017 | 860 |
| 21. Exercise Encouraged with Typed Pledge | 0.052 | 0.025 | 0.034 | 849 |
| 26. Values Affirmation Followed by Diagnosis as Gritty | 0.052 | 0.022 | 0.018 | 804 |
| 33. Planning Workouts Encouraged | 0.051 | 0.022 | 0.021 | 1,499 |
| 07. Choice of Gain- or Loss-Framed Micro-Incentives | 0.050 | 0.017 | 0.004 | 1,652 |
| 08. Exercise Commitment Contract Explained | 0.049 | 0.028 | 0.079 | 810 |
| 42. Exercise Encouraged with E-Signed Pledge | 0.045 | 0.027 | 0.099 | 878 |
| 04. Free Audiobook Provided | 0.043 | 0.036 | 0.225 | 1,604 |
| 14. Rigidity Rewardeda | 0.040 | 0.023 | 0.083 | 1,816 |
| 34. Gym Routine Encouraged | 0.038 | 0.027 | 0.165 | 820 |
| 41. Mon-Fri Consistency Rewarded, Sat-Sun Consistency Rewarded | 0.037 | 0.019 | 0.056 | 564 |
| 24. Rigidity Rewardede | 0.035 | 0.027 | 0.188 | 548 |
| 28. Rigidity Rewardedc | 0.034 | 0.024 | 0.155 | 1,701 |
| 18. Fitness Questionnaire | 0.033 | 0.021 | 0.113 | 799 |
| 46. Defaulted into 1 Weekly Workout | 0.032 | 0.023 | 0.152 | 455 |
| 17. Exercise Advice Solicited | 0.032 | 0.023 | 0.165 | 749 |
| 25. Exercise Encouraged with Signed Pledge | 0.032 | 0.029 | 0.275 | 802 |
| 39. Reflecting on Workouts Rewarded | 0.031 | 0.019 | 0.111 | 469 |
| 22. Gain-Framed Micro-Incentives | 0.029 | 0.025 | 0.235 | 783 |
| 30. Planning, Reminders & Micro-Incentives to Exercise | 0.029 | 0.015 | 0.055 | 3,503 |
| 32. Exercise Encouraged | 0.028 | 0.026 | 0.287 | 806 |
| 15. Defaulted into 3 Weekly Workouts | 0.028 | 0.020 | 0.170 | 477 |
| 48. Rigidity Rewardedd | 0.025 | 0.022 | 0.242 | 1,613 |
| 37. Effective Workouts Encouraged | 0.022 | 0.020 | 0.267 | 852 |
| 52. Exercise Advice Solicited, Shared with Others | 0.020 | 0.029 | 0.488 | 707 |
| 47. Exercise Social Norms Shared (Low but Increasing) | 0.020 | 0.024 | 0.407 | 835 |
| 31. Fitness Questionnaire with Cognitive Reappraisal Prompt | 0.018 | 0.024 | 0.451 | 868 |
| 27. Bonus for Consistent Exercise Schedule | 0.016 | 0.025 | 0.527 | 798 |
| 43. Bonus for Variable Exercise Schedule | 0.012 | 0.024 | 0.605 | 865 |
| 16. Exercise Fun Facts Shared | 0.010 | 0.025 | 0.696 | 836 |
| 53. Exercise Social Norms Shared (High) | 0.007 | 0.021 | 0.727 | 841 |
| 40. Fun Workouts Encouraged | 0.006 | 0.024 | 0.796 | 770 |
| 23. Higher Incentivesb | 0.005 | 0.025 | 0.827 | 1,910 |
| 50. Fitness Questionnaire with Decision Support | 0.005 | 0.024 | 0.826 | 893 |
| 29. Loss-Framed Micro-Incentives | 0.004 | 0.022 | 0.858 | 872 |
| 38. Planning Benefits Explained | 0.004 | 0.034 | 0.914 | 859 |
| 49. Exercise Commitment Contract Encouraged | −0.002 | 0.028 | 0.953 | 812 |
| 45. Rewarded for Responding to Questions about Workouts | −0.007 | 0.026 | 0.800 | 1,199 |
| 51. Rigidity Rewardedb | −0.013 | 0.030 | 0.669 | 1,850 |
| 44. Exercise Commitment Contract Explained Post-Intervention | −0.027 | 0.030 | 0.357 | 828 |
| Number of observations | 2,397,729 | |||
| Number of participants | 61,293 | |||
| R2 | 0.445 | |||
The table reports the results of an ordinary least squares regression predicting whether participants visited the gym in a given week during the four-week intervention period with indicators for experimental condition during the four-week intervention period, participants fixed effects, and cohort-week interactions. Robust standard errors were clustered by participant. Observations in the regression were weighted to ensure that each condition was equally weighted within a cohort and each cohort was weighted proportionally to its length. The reference group was the Placebo Control condition. SeeTable S1 in theSupplementary Information for descriptions of each experimental condition.
These superscripts denote the different incentive amounts offered in different versions of the Bonus for Returning after Missed Workouts, Higher Incentives, and Rigidity Rewarded conditions, which are detailed inTable S1 in theSupplementary Information. In conditions with the same name, superscripts that come earlier in the alphabet indicate larger incentives.
Extended Data Table 8 |.
Regression-estimated effects of each experimental condition on total weekly gym visits during the four-week intervention period relative to the Planning, Reminders, and Micro-Incentives to Exercise condition
| Experimental Condition | b | SE | p-value | N |
|---|---|---|---|---|
| 01. Bonus for Returning after Missed Workoutsb | 0.266 | 0.103 | 0.010 | 1,633 |
| 02. Higher Incentivesa | 0.229 | 0.098 | 0.020 | 1,750 |
| 03. Exercise Social Norms Shared (High and Increasing) | 0.209 | 0.090 | 0.020 | 798 |
| 04. Free Audiobook Provided | 0.206 | 0.128 | 0.106 | 1,604 |
| 05. Bonus for Returning after Missed Workoutsa | 0.200 | 0.087 | 0.022 | 1,719 |
| 06. Planning Fallacy Described and Planning Revision Encouraged | 0.188 | 0.126 | 0.135 | 811 |
| 07. Choice of Gain- or Loss-Framed Micro-Incentives | 0.147 | 0.064 | 0.021 | 1,652 |
| 08. Exercise Commitment Contract Explained | 0.143 | 0.101 | 0.156 | 810 |
| 09. Free Audiobook Provided, Temptation Bundling Explained | 0.141 | 0.084 | 0.092 | 1,685 |
| 10. Following Workout Plan Encouraged | 0.131 | 0.089 | 0.142 | 805 |
| 11. Fitness Questionnaire with Decision Support & Cognitive Reappraisal Prompt | 0.119 | 0.088 | 0.177 | 825 |
| 12. Values Affirmation | 0.106 | 0.100 | 0.290 | 824 |
| 13. Asked Questions about Workouts | 0.099 | 0.117 | 0.396 | 1,191 |
| 14. Rigidity Rewardeda | 0.093 | 0.087 | 0.281 | 1,816 |
| 15. Defaulted into 3 Weekly Workouts | 0.076 | 0.091 | 0.400 | 477 |
| 16. Exercise Fun Facts Shared | 0.071 | 0.090 | 0.430 | 836 |
| 17. Exercise Advice Solicited | 0.071 | 0.090 | 0.433 | 749 |
| 18. Fitness Questionnaire | 0.070 | 0.086 | 0.416 | 799 |
| 19. Planning Revision Encouraged | 0.059 | 0.093 | 0.524 | 860 |
| 20. Exercise Social Norms Shared (Low) | 0.057 | 0.084 | 0.497 | 821 |
| 21. Exercise Encouraged with Typed Pledge | 0.055 | 0.113 | 0.626 | 849 |
| 22. Gain-Framed Micro-Incentives | 0.043 | 0.095 | 0.652 | 783 |
| 23. Higher Incentivesb | 0.038 | 0.085 | 0.653 | 1,910 |
| 24. Rigidity Rewardede | 0.031 | 0.089 | 0.727 | 548 |
| 25. Exercise Encouraged with Signed Pledge | 0.020 | 0.105 | 0.848 | 802 |
| 26. Values Affirmation Followed by Diagnosis as Gritty | 0.018 | 0.089 | 0.836 | 804 |
| 27. Bonus for Consistent Exercise Schedule | 0.015 | 0.094 | 0.876 | 798 |
| 28. Rigidity Rewardedc | 0.006 | 0.082 | 0.945 | 1,701 |
| 29. Loss-Framed Micro-Incentives | 0.002 | 0.084 | 0.977 | 872 |
| 31. Fitness Questionnaire with Cognitive Reappraisal Prompt | −0.002 | 0.085 | 0.979 | 868 |
| 32. Exercise Encouraged | −0.004 | 0.094 | 0.962 | 806 |
| 33. Planning Workouts Encouraged | −0.005 | 0.078 | 0.947 | 1,499 |
| 34. Gym Routine Encouraged | −0.007 | 0.092 | 0.936 | 820 |
| 35. Reflecting on Workouts Encouraged | −0.014 | 0.090 | 0.875 | 517 |
| 36. Planning Workouts Rewarded | −0.018 | 0.084 | 0.828 | 1,466 |
| 37. Effective Workouts Encouraged | −0.024 | 0.076 | 0.749 | 852 |
| 38. Planning Benefits Explained | −0.025 | 0.102 | 0.805 | 859 |
| 39. Reflecting on Workouts Rewarded | −0.028 | 0.089 | 0.754 | 469 |
| 40. Fun Workouts Encouraged | −0.037 | 0.079 | 0.641 | 770 |
| 41. Mon-Fri Consistency Rewarded, Sat-Sun Consistency Rewarded | −0.041 | 0.082 | 0.613 | 564 |
| 42. Exercise Encouraged with E-Signed Pledge | −0.048 | 0.095 | 0.612 | 878 |
| 43. Bonus for Variable Exercise Schedule | −0.054 | 0.099 | 0.586 | 865 |
| 44. Exercise Commitment Contract Explained Post-Intervention | −0.060 | 0.087 | 0.489 | 828 |
| 45. Rewarded for Responding to Questions about Workouts | −0.070 | 0.091 | 0.438 | 1,199 |
| 46. Defaulted into 1 Weekly Workout | −0.075 | 0.099 | 0.453 | 455 |
| 47. Exercise Social Norms Shared (Low but Increasing) | −0.085 | 0.085 | 0.318 | 835 |
| 48. Rigidity Rewardedd | −0.092 | 0.085 | 0.282 | 1,613 |
| 49. Exercise Commitment Contract Encouraged | −0.101 | 0.089 | 0.255 | 812 |
| 50. Fitness Questionnaire with Decision Support | −0.112 | 0.086 | 0.196 | 893 |
| 51. Rigidity Rewardedb | −0.133 | 0.089 | 0.136 | 1,850 |
| 52. Exercise Advice Solicited, Shared with Others | −0.135 | 0.095 | 0.156 | 707 |
| 53. Exercise Social Norms Shared (High) | −0.166 | 0.141 | 0.237 | 841 |
| 54. Placebo Control | −0.136 | 0.049 | 0.006 | 4,992 |
| Number of observations | 2,397,729 | |||
| Number of participants | 61,293 | |||
| R2 | 0.574 | |||
The table reports the results of an ordinary least squares regression predicting participants’ weekly gym visits during the four-week intervention period with indicators for experimental condition during the four-week intervention period, participants fixed effects, and cohort-week interactions. Robust standard errors were clustered by participant. Observations in the regression were weighted to ensure that each condition was equally weighted within a cohort and each cohort was weighted proportionally to its length. The reference group was the Planning, Reminders, and Micro-Incentives to Exercise condition. SeeTable S1 in theSupplementary Information for descriptions of each experimental condition.
These superscripts denote the different incentive amounts offered in different versions of the Bonus for Returning after Missed Workouts, Higher Incentives, and Rigidity Rewarded conditions, which are detailed inTable S1 in theSupplementary Information. In conditions with the same name, superscripts that come earlier in the alphabet indicate larger incentives.
Extended Data Table 9 |.
Regression-estimated effects of each experimental condition on total weekly gym visits during the four-week post-intervention period relative to the Placebo Control condition
| Experimental Condition | b | SE | p-value | N |
|---|---|---|---|---|
| 01. Bonus for Returning after Missed Workoutsb | 0.249 | 0.110 | 0.024 | 1,633 |
| 04. Free Audiobook Provided | 0.213 | 0.098 | 0.030 | 1,604 |
| 03. Exercise Social Norms Shared (High and Increasing) | 0.173 | 0.087 | 0.047 | 798 |
| 06. Planning Fallacy Described and Planning Revision Encouraged | 0.170 | 0.111 | 0.124 | 811 |
| 20. Exercise Social Norms Shared (Low) | 0.165 | 0.085 | 0.052 | 821 |
| 05. Bonus for Returning after Missed Workoutsa | 0.136 | 0.091 | 0.134 | 1,719 |
| 10. Following Workout Plan Encouraged | 0.131 | 0.086 | 0.125 | 805 |
| 09. Free Audiobook Provided, Temptation Bundling Explained | 0.130 | 0.075 | 0.084 | 1,685 |
| 33. Planning Workouts Encouraged | 0.129 | 0.062 | 0.038 | 1,499 |
| 43. Bonus for Variable Exercise Schedule | 0.121 | 0.082 | 0.137 | 865 |
| 26. Values Affirmation Followed by Diagnosis as Gritty | 0.120 | 0.080 | 0.136 | 804 |
| 22. Gain-Framed Micro-Incentives | 0.106 | 0.074 | 0.151 | 783 |
| 18. Fitness Questionnaire | 0.105 | 0.080 | 0.187 | 799 |
| 11. Fitness Questionnaire with Decision Support & Cognitive Reappraisal Prompt | 0.084 | 0.079 | 0.290 | 825 |
| 25. Exercise Encouraged with Signed Pledge | 0.083 | 0.080 | 0.299 | 802 |
| 12. Values Affirmation | 0.070 | 0.100 | 0.481 | 824 |
| 02. Higher Incentivesa | 0.052 | 0.091 | 0.569 | 1,750 |
| 17. Exercise Advice Solicited | 0.049 | 0.078 | 0.527 | 749 |
| 07. Choice of Gain- or Loss-Framed Micro-Incentives | 0.045 | 0.054 | 0.401 | 1,652 |
| 08. Exercise Commitment Contract Explained | 0.044 | 0.085 | 0.605 | 810 |
| 27. Bonus for Consistent Exercise Schedule | 0.040 | 0.086 | 0.644 | 798 |
| 45. Rewarded for Responding to Questions about Workouts | 0.039 | 0.070 | 0.581 | 1,199 |
| 15. Defaulted into 3 Weekly Workouts | 0.034 | 0.083 | 0.682 | 477 |
| 28. Rigidity Rewardedc | 0.034 | 0.071 | 0.636 | 1,701 |
| 31. Fitness Questionnaire with Cognitive Reappraisal Prompt | 0.032 | 0.083 | 0.705 | 868 |
| 47. Exercise Social Norms Shared (Low but Increasing) | 0.030 | 0.099 | 0.760 | 835 |
| 41. Mon-Fri Consistency Rewarded, Sat-Sun Consistency Rewarded | 0.014 | 0.083 | 0.862 | 564 |
| 37. Effective Workouts Encouraged | 0.012 | 0.068 | 0.858 | 852 |
| 19. Planning Revision Encouraged | 0.012 | 0.091 | 0.896 | 860 |
| 16. Exercise Fun Facts Shared | 0.004 | 0.083 | 0.966 | 836 |
| 49. Exercise Commitment Contract Encouraged | −0.002 | 0.091 | 0.982 | 812 |
| 44. Exercise Commitment Contract Explained Post-Intervention | −0.004 | 0.073 | 0.954 | 828 |
| 52. Exercise Advice Solicited, Shared with Others | −0.019 | 0.122 | 0.875 | 707 |
| 24. Rigidity Rewardede | −0.023 | 0.080 | 0.773 | 548 |
| 51. Rigidity Rewardedb | −0.029 | 0.074 | 0.699 | 1,850 |
| 23. Higher Incentivesb | −0.029 | 0.069 | 0.677 | 1,910 |
| 30. Planning, Reminders & Micro-Incentives to Exercise | −0.031 | 0.050 | 0.527 | 3,503 |
| 32. Exercise Encouraged | −0.032 | 0.070 | 0.642 | 806 |
| 50. Fitness Questionnaire with Decision Support | −0.041 | 0.071 | 0.557 | 893 |
| 36. Planning Workouts Rewarded | −0.050 | 0.085 | 0.557 | 1,466 |
| 13. Asked Questions about Workouts | −0.053 | 0.077 | 0.494 | 1,191 |
| 34. Gym Routine Encouraged | −0.068 | 0.073 | 0.352 | 820 |
| 40. Fun Workouts Encouraged | −0.069 | 0.076 | 0.365 | 770 |
| 46. Defaulted into 1 Weekly Workout | −0.070 | 0.090 | 0.435 | 455 |
| 14. Rigidity Rewardeda | −0.078 | 0.081 | 0.337 | 1,816 |
| 35. Reflecting on Workouts Encouraged | −0.080 | 0.078 | 0.302 | 517 |
| 42. Exercise Encouraged with E-Signed Pledge | −0.081 | 0.074 | 0.274 | 878 |
| 29. Loss-Framed Micro-Incentives | −0.110 | 0.075 | 0.142 | 872 |
| 39. Reflecting on Workouts Rewarded | −0.123 | 0.079 | 0.117 | 469 |
| 48. Rigidity Rewardedd | −0.124 | 0.077 | 0.105 | 1,613 |
| 21. Exercise Encouraged with Typed Pledge | −0.147 | 0.110 | 0.182 | 849 |
| 38. Planning Benefits Explained | −0.191 | 0.116 | 0.100 | 859 |
| 53. Exercise Social Norms Shared (High) | −0.377 | 0.213 | 0.077 | 841 |
| Number of observations | 2,642,901 | |||
| Number of participants | 61,293 | |||
| R2 | 0.553 | |||
The table reports the results of an ordinary least squares regression predicting participants’ weekly gym visits during the first four weeks after the intervention period with indicators for experimental condition during the four-week intervention period, indicators for experimental condition during the first four weeks post-intervention, participants fixed effects, and cohort-week interactions. Robust standard errors were clustered by participant. Observations in the regression were weighted to ensure that each condition was equally weighted within a cohort and each cohort was weighted proportionally to its length. The reference group was the Placebo Control condition. SeeTable S1 in theSupplementary Information for descriptions of each experimental condition.
These superscripts denote the different incentive amounts offered in different versions of the Bonus for Returning after Missed Workouts, Higher Incentives, and Rigidity Rewarded conditions, which are detailed inTable S1 in theSupplementary Information. In conditions with the same name, superscripts that come earlier in the alphabet indicate larger incentives.
Supplementary Material
Acknowledgements
Support for this research was provided in part by the Robert Wood Johnson Foundation, the AKO Foundation, J. Alexander, M. J. Leder, W. G. Lichtenstein, the Pershing Square Fund for Research on the Foundations of Human Behavior from Harvard University and by Roybal Center grants (P30AG034546 and 5P30AG034532) from the National Institute on Aging. The views expressed here do not necessarily reflect the views of any of these individuals or entities. We thank 24 Hour Fitness for partnering with the Behavior Change for Good Initiative at the University of Pennsylvania to make this research possible.
Footnotes
Online content
Any methods, additional references, Nature Research reporting summaries, source data, extended data,supplementary information, acknowledgements, peer review information; details of author contributions and competing interests; and statements of data and code availability are available athttps://doi.org/10.1038/s41586-021-04128-4.
Competing interests The authors declare no competing interests. The authors did not receive commercial benefits from the fitness chain or speaking/consulting fees related to any of the interventions presented here.
Supplementary information The online version containssupplementary material available athttps://doi.org/10.1038/s41586-021-04128-4.
Reporting summary
Further information on research design is available in the Nature Research Reporting Summary linked to this paper.
Code availability
The code to replicate the analyses and figures in the paper andSupplementary Information is available online (https://osf.io/9av87/?view_only=8bb9282111c24f81a19c2237e7d7eba3).
Data availability
The data analysed in this paper were provided by 24 Hour Fitness and we have their legal permission to share the deidentified data. We have therefore made deidentified data available athttps://osf.io/9av87/?view_only=8bb9282111c24f81a19c2237e7d7eba3. Furthermore, tables of all of the preregistration links for each of the substudies with the interventions and the prediction studies are available inSupplementary Tables 2 and30.
References
- 1.Behavioural Insights and Public Policy: Lessons from Around the World (OECD Publishing, 2017).
- 2.Benartzi Set al. Should governments invest more in nudging?Psychol. Sci28, 1041–1055 (2017). [DOI] [PMC free article] [PubMed] [Google Scholar]
- 3.Charness G & Gneezy UIncentives to EXercise. Econometrica77, 909–931 (2009). [Google Scholar]
- 4.Acland D & Levy MRNaiveté, projection bias, and habit formation in gym attendance. Manage. Sci61, 146–160 (2015). [Google Scholar]
- 5.Royer H, Stehr M & Sydnor JIncentives, commitments, and habit formation in exercise: evidence from a field experiment with workers at a Fortune-500 company. Am. Econ. J. Appl. Econ7, 51–84 (2015). [Google Scholar]
- 6.Beshears J, Lee HN, Milkman KL, Mislavsky R & Wisdom JCreating exercise habits using incentives: the tradeoff between flexibility and routinization. Manage. Sci67, 4139–4171 (2020). [DOI] [PMC free article] [PubMed] [Google Scholar]
- 7.DellaVigna S & Linos ERCTs to Scale: Comprehensive Evidence from Two Nudge Units 65 (National Bureau of Economic Research, 2020). [Google Scholar]
- 8.DellaVigna S & Pope DWhat motivates effort? Evidence and expert forecasts. Rev. Econ. Stud85, 1029–1069 (2018). [Google Scholar]
- 9.DellaVigna S & Pope DPredicting experimental results: who knows what?J. Polit. Econ126, 2410–2456 (2018). [Google Scholar]
- 10.DellaVigna S, Pope D & Vivalt EPredict science to improve science. Science366, 428–429 (2019). [DOI] [PubMed] [Google Scholar]
- 11.Kristal AS & Whillans AVWhat we can learn from five naturalistic field experiments that failed to shift commuter behaviour. Nat. Hum. Behav4, 169–176 (2020). [DOI] [PubMed] [Google Scholar]
- 12.Donoho D50 years of data science. J. Comput. Graph. Stat26, 745–766 (2017). [Google Scholar]
- 13.Liberman MFred Jelinek. Comput. Linguist36, 595–599 (2010). [Google Scholar]
- 14.Lai CKet al. Reducing implicit racial preferences: I. A comparative investigation of 17 interventions. J. Exp. Psychol. Gen143, 1765–1785 (2014). [DOI] [PubMed] [Google Scholar]
- 15.Lai CKet al. Reducing implicit racial preferences: II. Intervention effectiveness across time. J. Exp. Psychol. Gen145, 1001–1016 (2016). [DOI] [PubMed] [Google Scholar]
- 16.Mellers Bet al. Psychological strategies for winning a geopolitical forecasting tournament. Psychol. Sci25, 1106–1115 (2014). [DOI] [PubMed] [Google Scholar]
- 17.Open Science Collaboration Estimating the reproducibility of psychological science. Science349, aac4716 (2015). [DOI] [PubMed] [Google Scholar]
- 18.Milkman KL, Minson JA & Volpp KGMHolding the hunger games hostage at the gym: an evaluation of temptation bundling. Manage. Sci60, 283–299 (2014). [DOI] [PMC free article] [PubMed] [Google Scholar]
- 19.Ward BW, Clarke TC, Nugent CN & Schiller JSEarly Release of Selected Estimates Based on Data From the 2015 National Health Interview Survey 120 (National Center for Health Statistics, 2015). [Google Scholar]
- 20.Lee I-Met al. Effect of physical inactivity on major non-communicable diseases worldwide: an analysis of burden of disease and life expectancy. Lancet380, 219–229 (2012). [DOI] [PMC free article] [PubMed] [Google Scholar]
- 21.Gollwitzer PMImplementation intentions: strong effects of simple plans. Am. Psychol54, 493–503 (1999). [Google Scholar]
- 22.Milkman KL, Beshears J, Choi JJ, Laibson D & Madrian BCUsing implementation intentions prompts to enhance influenza vaccination rates. Proc. Natl Acad. Sci. USA108, 10415–10420 (2011). [DOI] [PMC free article] [PubMed] [Google Scholar]
- 23.Rogers T, Milkman KL, John LK & Norton MIBeyond good intentions: prompting people to make plans improves follow-through on important tasks. Behav. Sci. Pol1, 33–41 (2015). [Google Scholar]
- 24.Karlan D, McConnell M, Mullainathan S & Zinman JGetting to the top of mind: how reminders increase saving. Manage. Sci62, 3393–3411 (2016). [Google Scholar]
- 25.Homonoff TACan small incentives have large effects? The impact of taxes versus bonuses on disposable bag use. Am. Econ. J. Econ. Pol10, 177–210 (2018). [Google Scholar]
- 26.Storey JD & Tibshirani RStatistical significance for genomewide studies. Proc. Natl Acad. Sci. USA100, 9440–9445 (2003). [DOI] [PMC free article] [PubMed] [Google Scholar]
- 27.Allcott HSocial norms and energy conservation. J. Publ. Econ95, 1082–1095 (2011). [Google Scholar]
- 28.Chapman GB, Li M, Colby H & Yoon HOpting in vs opting out of influenza vaccination. JAMA304, 43–44 (2010). [DOI] [PubMed] [Google Scholar]
- 29.Milkman KL, et al. A megastudy of text-based nudges encouraging patients to get vaccinated at an upcoming doctor’s appointment. Proc. Natl Acad. Sci. USA118, e2101165118 (2021). [DOI] [PMC free article] [PubMed] [Google Scholar]
- 30.Lee MR & Shen MWinner’s curse: bias estimation for total effects of features in online controlled experiments In Proc. 24th ACM SIGKDD International Conference on Knowledge Discovery & Data Mining491–499 (ACM, 2018). [Google Scholar]
- 31.White HAsymptotic Theory for Econometricians (Elsevier, 1984). [Google Scholar]
- 32.Dubner SJHow goes the behavior-change revolution? (Ep. 382). Freakonomicshttps://freakonomics.com/podcast/live-philadelphia/ (2019).
Associated Data
This section collects any data citations, data availability statements, or supplementary materials included in this article.
Supplementary Materials
Data Availability Statement
The data analysed in this paper were provided by 24 Hour Fitness and we have their legal permission to share the deidentified data. We have therefore made deidentified data available athttps://osf.io/9av87/?view_only=8bb9282111c24f81a19c2237e7d7eba3. Furthermore, tables of all of the preregistration links for each of the substudies with the interventions and the prediction studies are available inSupplementary Tables 2 and30.