


Studies of the Biogenic Amine Transporters. 14. Identification of Low-Efficacy “Partial” Substrates for the Biogenic Amine Transporters
Richard B Rothman
John S Partilla
Michael H Baumann
Catrissa Lightfoot-Siordia
Bruce E Blough
Address correspondence to: Dr. Richard B. Rothman, Translational Pharmacology Section, Intramural Research Program, National Institute on Drug Abuse, 333 Cassell Drive, Suite 4500, Baltimore, MD 21224. E-mail:rrothman@mail.nih.gov
Corresponding author.
Received 2011 Oct 10; Accepted 2011 Dec 19.
Abstract
Several compounds have been identified that display low-efficacy, “partial substrate” activity. Here, we tested the hypothesis that the mechanism of this effect is a slower rate of induced neurotransmitter efflux than that produced by full substrates. Biogenic amine transporter release assays were carried out in rat brain synaptosomes and followed published procedures. [3H]1-methyl-4-phenylpyridinium (MPP+) was used to assess release from dopamine (DA) and norepinephrine nerve terminals, whereas [3H]5-hydroxytryptamine (5-HT) was used to assess release from 5-HT nerve terminals. A detailed time-course evaluation of DA transporter (DAT)-mediated efflux was conducted by measuring the efflux of [3H]MPP+ after the addition of various test compounds. In vivo microdialysis experiments compared the effects of the full substrates [(±)-1-(2-naphthyl)propan-2-amine (PAL-287) and (S)-N-methyl-1-(2-naphthyl)propan-2-amine (PAL-1046)], to that of a partial DAT/5-HT transporter substrate [(S)-N-ethyl-1-(2-naphthyl)propan-2-amine (PAL-1045)] on extracellular DA and 5-HT in the nucleus accumbens of the rat. The in vitro release assays demonstrated that partial substrate activity occurs at all three transporters. In the DAT efflux experiments,d-amphetamine (full substrate) promoted a fast efflux (K1 = 0.24 min−1) and a slow efflux (K2 = 0.008 min−1). For the partial DAT substrates, K1 = ∼0.04 min−1, and K2 approximated zero. The in vivo microdialysis experiments showed that the partial substrate (PAL-1045) was much less effective in elevating extracellular DA and 5-HT than the comparator full substrates. We conclude that low-efficacy partial DAT substrates promote efflux at a slower rate than full substrates, and “partiality” reflects the ultra-slow K2 constant, which functionally limits the ability of these compounds to increase extracellular DA. We speculate that partial biogenic amine transporter substrates bind to the transporter but are less effective in inducing conformational changes required for reverse transport activity.
Introduction
The biogenic amine transporters (BATs) that translocate dopamine (DA), norepinephrine (NE), and serotonin belong to the sodium-dependent symporter family of transporters and are the subject of numerous comprehensive reviews, two of which are cited here (Torres et al., 2003;Kanner and Zomot, 2008). The main function of these transporters is to help terminate the action of neurotransmitters released via exocytosis in response to nerve impulses. Drugs that interact with the BATs can be broadly categorized as either uptake inhibitors or releasers. Uptake inhibitors, also described as BAT inhibitors, bind to the transporter, are not transported into the nerve terminal, but block the transport of endogenous substrates, such as the neurotransmitter. Releasers, on the other hand, are transporter substrates. These drugs, like the endogenous neurotransmitters, are transported into the nerve terminal and, as a result, cytoplasmic neurotransmitters are countertransported out of the nerve terminal.
The mechanisms of countertransport, originally described as the alternating access model (Jardetzky, 1966), are complex and not completely understood. Studies of the crystallized bacterial transporter for LeuTAa have provided new information as to how this process likely functions (Yamashita et al., 2005). As described elsewhere (Shi et al., 2008;Nyola et al., 2010) Na+ binds to the transporter, helping to maintain the transporter in an outward-facing conformation. The subsequent binding of a substrate to an S1 site leads to an intermediate “occluded” transporter state. The binding of substrate to a second S2 site promotes a conformation change to an inward-facing transporter conformation and the intracellular release of substrate and Na+. The increased concentration of internal cellular sodium at the transporter also facilitates reverse transport of dopamine (Goodwin et al., 2009;Pifl et al., 2009). Recent data suggest that the model developed on the basis of the LeuTAa transporter may also apply to the biogenic amine transporters (Schmitt et al., 2010). In addition, other mechanisms, such as receptor phosphorylation and substrate-induced currents, can affect substrate-mediated neurotransmitter efflux (Sitte and Freissmuth, 2010).
These considerations, and the fact that BATs can adopt different functionally significant conformational states (Ferrer and Javitch, 1998;Reith et al., 2001;Gether et al., 2006), raise the possibility that both BAT substrates and BAT inhibitors will not always interact with transporters in a manner consistent with simple competitive models. Consistent with this idea, we have previously identified allosteric modulators of the DA transporter (DAT) that reduce theEMAX value ford-amphetamine-induced, DAT-mediated release of [3H]MPP+, while producing minimal increases in the EC50 value (Rothman et al., 2009). In addition, we recently reported that certain 5-HT transporter (SERT) inhibitors decrease the efficacy of substrate-mediated release of [3H]5-HT from rat brain synaptosomes (Rothman et al., 2010). These findings, along with data published byGobbi et al. (2008), suggest that BAT substrates might differ in their efficacy for promoting neurotransmitter release. Given the complex nature of the carrier-mediated exchange process, this is perhaps not surprising.
In the present study we report the identification of low-efficacy “partial substrates” for DAT, SERT, and NE transporter (NET) and provide data supporting the hypothesis that these compounds display partial release characteristics in the in vitro assay because they induce efflux of neurotransmitter at a slower rate than full substrates.
Materials and Methods
Animals.
Male Sprague-Dawley rats (Charles River Laboratories, Inc., Wilmington, MA) weighing 300 to 400 g were used as subjects in these experiments. Rats were housed in standard conditions (lights on from 7:00 AM to 7:00 PM) with food and water freely available. Animals were maintained in facilities fully accredited by the Association for the Assessment and Accreditation of Laboratory Animal Care, and experiments were performed in accordance with the Institutional Care and Use Committee of the National Institute on Drug Abuse Intramural Research Program.
Drugs and Reagents.
[3H]MPP+ (SA = 85 Ci/mmol), [3H]5-HT (SA = 27.5 Ci/mmol), and [3H]DA (SA = 31.8 Ci/mmol) were purchased from PerkinElmer Life and Analytical Sciences (Waltham, MA). The sources of other reagents were as published previously (Rothman et al., 2001;Baumann et al., 2008;Pariser et al., 2008;Zolkowska et al., 2009). Compounds from a phenethylamine library (PAL compounds) used here were synthesized in the laboratory of Dr. B. E. Blough and will be described in detail in a subsequent publication.
In Vitro Release Methods.
Transporter-mediated release assays were carried out as described previously with minor modifications (Rothman et al., 2003). Rats were sacrificed by CO2 asphyxiation. Tissue from caudate (for DAT assay) or whole brain minus cerebellum and caudate (for SERT and NET assay) was homogenized in ice-cold 10% sucrose containing 1 μM reserpine. For DAT-mediated release assays [3H]1-methyl-4-phenylpyridinium ([3H]MPP+) was used as the radiolabeled substrate; 100 nM desipramine and 100 nM citalopram were added to prevent uptake of [3H]MPP+ into NE and 5-HT nerves. For SERT-mediated release assays, [3H]5-HT was used as the radiolabeled substrate; 100 nM nomifensine and 50 nM 1-(2-(diphenylmethoxy)ethyl)-4-(3-phenylpropyl)piperazine (GBR12935) were added to the sucrose solution to prevent uptake of [3H]5-HT into NE and DA nerve terminals. For the NET-mediated release assay, 50 nMGBR12935 and 100 nM citalopram were added to block [3H]MPP+ uptake into DA and 5-HT nerves. Synaptosomal preparations were incubated to steady state with 5 nM [3H]MPP+ (60 min) or 5 nM [3H]5-HT (60 min) in Krebs-phosphate buffer, pH 7.4, plus 1 μM reserpine. Subsequently, 850 μl of synaptosomes preloaded with [3H]ligand were added to polystyrene test tubes that contained 150 μl of test drug in assay buffer plus 1 mg/ml bovine serum albumin. After 5 min ([3H]5-HT) or 30 min ([3H]MPP+) the release reaction was terminated by dilution with 4 ml of wash buffer followed by rapid vacuum filtration. Nonspecific values were measured by incubations in the presence of either 100 μM tyramine ([3H]5-HT release assay) or 10 μM tyramine ([3H]MPP+ release assays). The retained tritium was counted by a Topcount liquid scintillation counter (PerkinElmer Life and Analytical Sciences).
As noted above, the standard [3H]MPP+ release assays for DAT were terminated after 30 min. In other experiments we measured the time course of drug-induced efflux of [3H]MPP+. For these experiments, synaptosomes were preloaded with [3H]MPP+ for 60 min. A “time 0” point was filtered, test drugs were then added, and samples were filtered at various time points up to 120 min. Control samples were also filtered at the same time points. Similar experiments were not done for SERT and NET, because the signal-to-noise ratio of these assays is not adequate for this type of experiment.
Data Analysis and Statistics.
For release experiments, dose-response curves were generated by using eight concentrations of test drug. To describe the method for calculating the release dose-response curves, the following definitions are necessary: total binding = cpm in the absence of any drug; nonspecific binding (NS) = cpm in the presence of tyramine; maximal release (MR) = total binding − NS; specific release (SR) = (cpm in the presence of drug) − NS; and percentage of maximal release = 100 − SR/MR × 100.
The data of three experiments, expressed as percentage of maximal release, were then fit to a dose-response curve model:Y = EMAX × ([D]/([D] + EC50) for the best-fit estimates of theEMAX and EC50 values by using either KaleidaGraph version 3.6.4 (Synergy Software, Reading, PA) or MLAB-PC (Civilized Software, Silver Spring, MD) (Nightingale et al., 2005). In “shift” experiments, a substrate dose-response curve was generated in the absence and presence of an uptake inhibitor. ApparentKe values were calculated according to the equation: [test drug]/(EC50–2/EC50–1 − 1), where EC50–2 is the EC50 value in the presence of the test drug, and EC50–1 is the value in the absence of the uptake inhibitor.
For the [3H]MPP+ efflux experiments, the data are expressed as a percentage of control = SR/MR × 100. The data of three independent experiments were pooled and fit to one- and two-component dissociation models by using MLAB-PC as described elsewhere (Rothman et al., 1991). Graphs were generated with KaleidaGraph 3.6 software. For certain kinetic experiments, two sets of data (dataset α and dataset β) were simultaneously fit (using MLAB-PC) to the two-component dissociation model by using the following equations:
 |
 |
Two different constraint conditions were used: 1) unconstrained, and 2) four parameters of set α = four parameters of set β (A1 = A3, A2 = A4, K1 = K3, K2 = K4). AnF-test was calculated based on the sum of squares for each of the constraint conditions. The threshold for significance was set atp < 0.01(Nandi et al., 2004).
Microdialysis Methods.
For the in vivo microdialysis experiments, rats received sodium pentobarbital (60 mg/kg i.p.) for surgical anesthesia. Indwelling catheters made of Silastic Medical Grade tubing (Dow Corning, Midland, MI) were implanted into the right jugular vein to allow for intravenous drug administration. Intracerebral guide cannulae made of plastic (CMA 12; CMA/Microdialysis, Acton, MA) were implanted above the nucleus accumbens (n = 7 rats/drug), according to stereotaxic coordinates: 1.6 mm lateral and 1.6 mm anterior to bregma and 6.0 mm below the surface of dura (Paxinos and Watson, 1986). Guide cannulae were secured to the skull by using stainless-steel anchor screws and dental acrylic. Animals were individually housed postoperatively and allowed 7 to 10 days for recovery. The in vivo microdialysis sampling (Zolkowska et al., 2009), analysis of dopamine and 5-HT, and simultaneous locomotor measurements (Baumann et al., 2008) were carried out according to published procedures. Group data are expressed as mean ± S.E.M. forn = 7 rats/group. Neurotransmitter and behavioral data from individual rats were normalized to percentage of control values (i.e., percentage basal) using the averaged raw data from three preinjection time points as basal or 100%. In this manner, each rat served as its own control. Normalized group data were evaluated by a two-factor analysis of variance (ANOVA) (drug and time). Subsequently, the individual time-effect curve for each drug was assessed by one-factor ANOVA; if this analysis demonstrated a significant main effect, data from time points after 1 mg/kg (20, 40, and 60 min) and 3 mg/kg (80, 100, and 120 min) were compared with time 0 values by separate one-factor ANOVAs followed by Dunnett's post hoc test. Mean drug effects were then calculated at each dose of drug by taking the average value for data collected after 1 mg/kg (20, 40, and 60 min) and 3 mg/kg (80, 100, and 120 min) for each parameter (Matthews et al., 1990). Mean drug effects were evaluated by one-factor ANOVA followed by Newman-Keul's post hoc test.
Results
Table 1 shows the EC50 andEMAX values for DAT-, SERT- and NET-mediated release.d-Amphetamine, (±)-1-(2-naphthyl)propan-2-amine (PAL-287), and its methyl analog, (S)-N-methyl-1-(2-naphthyl)propan-2-amine (PAL-1046), were three examples of “full” substrates. These compounds hadEMAX values of ∼100% at all three transporters. (S)-N-ethyl-1-(2-naphthyl)propan-2-amine (PAL-1045), the ethyl analog of PAL-287, was a partial substrate at the DAT and SERT, but not the NET. In contrast, PAL-192 and PAL-193 were selective partial substrates at the DAT, withEMAX values of 61 ± 2 and 65 ± 2%. PAL-153, PAL-175, and PAL-179 had no activity at the DAT and NET, but were partial substrates at the SERT. PAL-874 was a partial substrate at the NET (EMAX = 75 ± 2%), inactive at the SERT, and a full substrate at the DAT. PAL-218 was a partial substrate at all three transporters. 4-Methyl-thioamphetamine (PAL-1063) andN,N-dimethyl-4-methyl-thioamphetamine (PAL-1062) are two compounds studied byGobbi et al. (2008) that showed partial release characteristics in a [3H]5-HT synaptosomal release assay. Consistent with their observations, we observed that PAL-1062 is a partial substrate at the SERT, although in our assay system PAL-1063 was a full substrate. Overall, these data indicate that partial substrate activity can be observed at all three transporters and compounds can be a partial substrate at one transporter while being a full substrate at another.
TABLE 1.
Summary of BAT release assays
| Drug | Structure | DAT | SERT | NET | |||
|---|---|---|---|---|---|---|---|
| EC50 | EMAX | EC50 | EMAX | EC50 | EMAX | ||
| nM ±S.D. | % ±S.D. | nM ±S.D. | % ±S.D. | nM ±S.D. | % ±S.D. | ||
| D-Amphetamine | 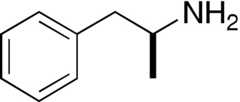 | 6.4 ± 1 | 103 ± 5 | 1960 ± 140a | 104 ± 2 | 7.4 ± 2.42 | 101 ± 10 |
| PAL-192 (±)-MDE |  | 622 ± 121 | 61 ± 2* | 47 ± 10 | 94 ± 4 | 2608 ± 537 | 85 ± 4 |
| PAL-193 (+)-MDE |  | 507 ± 83 | 65 ± 2* | 52 ± 9 | 97 ± 4 | 651 ± 117 | 93 ± 3 |
| PAL-194b (−)-MDE |  | Uptake inhibitor | 465 ± 69 | 89 ± 3* | Uptake inhibitor | ||
| PAL-287c |  | 15.7 ± 1.0 | 102 ± 1 | 3.9 ± 0.4 | 107 ± 3 | 9.8 ± 1.5 | 96 ± 3 |
| PAL-1046 |  | 10 ± 1 | 101 ± 3 | 13 ± 2 | 103 ± 5 | 34 ± 3 | 98 ± 2 |
| PAL-1045 |  | 46 ± 11 | 78 ± 5* | 12 ± 2 | 66 ± 2* | 137 ± 30 | 94 ± 4 |
| PAL-218 |  | 1207 ± 118 | 66 ± 1* | 26 ± 7 | 85 ± 4* | 56 ± 12 | 62 ± 3* |
| PAL-738 |  | 58 ± 10 | 78 ± 2* | 23 ± 2 | 96 ± 2 | 65 ± 12 | 89 ± 3 |
| PAL-153 |  | >10,000 | 561 ± 172 | 54 ± 3* | >10,000 | ||
| PAL-175 |  | >10,000 | 43 ± 16 | 57 ± 4* | >10,000 | ||
| PAL-179 |  | >10,000 | 33 ± 9 | 66 ± 3* | >10,000 | ||
| PAL-874 |  | 688 ± 110 | 92 3 | >10,000 | 305 ± 36 | 75 ± 2* | |
| PAL-1062 | 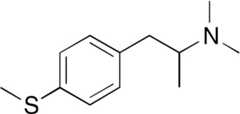 | 75 ± 37 | 51 ± 4* | ||||
| PAL-1063 |  | 21 ± 3 | 93 ± 3 | ||||
Data taken fromRothman et al. (2001).
PAL-194 was an uptake inhibitor at DAT (IC50 = 4256 ± 191 nM) and NET (IC50 = 3973 ± 455 nM).
Data taken from Rothman et al. (2005). These results differ slightly from the published values because the original data set was fit to a two-parameter logistic equation rather than the dose-response curve equation.
P < 0.05 compared with 100 ± 5% (DAT, SERT) and 100 ± 10% (NET) using a one-sample Student'st test. In this test, the test is between the observedEMAX (± S.D.) and 100% ± (average S.D. observed in these assays).
We next conducted efflux studies to test the hypothesis that partial substrates induce efflux of neurotransmitter at a slower rate than full substrates. These experiments focused solely on the DAT-mediated efflux of [3H]MPP+ because the SERT and NET assays did not have a sufficiently adequate signal-to-noise ratio for these experiments. Efflux data were collected over a 2-h time period after the addition of test compound because control experiments indicated that a stable baseline was maintained during this interval.Figure 1 shows the time course for DAT-mediated efflux of [3H]MPP+ induced by the full substratesd-amphetamine (Fig. 1A) and PAL-1046 (Fig. 1B). The highest concentration of each drug produced almost complete efflux over the 2-h time frame of the efflux experiment. The entire set of data for each drug was simultaneously fit to one- and two-component dissociation models, with the two-component model fitting significantly better than the one-component model (p < 0.01). The best-fit parameters of the two-component model are shown inTable 2. The results observed here ford-amphetamine are qualitatively similar to those reported in our previous article (Rothman et al., 2009), although there are differences in the rate constants, especially with the lower concentrations ofd-amphetamine. This probably derives from the relatively low signal-to-noise ratio of this method. As observed in our previous study ford-amphetamine (Rothman et al., 2009), bothd-amphetamine and PAL-1046 increased A1, the proportion of the faster dissociating component, in a dose-dependent manner. The rate constants observed with the highest concentration of PAL-1046 were similar to that observed with 100 nMd-amphetamine: K1 = ∼0.25 min−1 and K2 = ∼0.010 min−1. In contrast to our previous efflux studies withd-amphetamine (Rothman et al., 2009), in whichd-amphetamine did not alter the rate constants,d-amphetamine increased K1 in a dose-dependent manner.
Fig. 1.

Effect ofd-amphetamine (A) and PAL-1046 (B) on DAT-mediated [3H]MPP+ efflux. Efflux experiments were conducted as described underMaterials and Methods. The data were fit to a biexponential decay equation, and the best-fit estimates of the four parameters are shown inTable 3. Each point is the mean ± S.D. (n = 3).
TABLE 2.
Kinetic analysis of substrate-induced DAT-mediated [3H]MPP+ efflux
The data of three experiments (n = 3) were pooled (n = 117 data points) and fit simultaneously to either the one- or two-component model. In all cases, the two-component model fit the data better than the one-component model (P < 0.001). For the full substrates (d-amphetamine, PAL-1046, and PAL-738) a Student'st test (unpaired), using the parameter value and its S.D. (GraphPad onlinet test calculator; GraphPad Software Inc., San Diego, CA), was used to test statistical significance between parameter values.
| A1 | K1 | A2 | K2 | |
|---|---|---|---|---|
| % ±S.D. | min−1 | % ±S.D. | min−1 | |
| d-Amphetamine | ||||
| 5 nM | 56 ± 3 | 0.064 ± 0.008 | 45 ± 4 | 0.0016 ± 0.0010 |
| 20 nM | 79 ± 3* | 0.10 ± 0.01* | 21 ± 3* | 0.0023 ± 0.0015 |
| 100 nM | 84 ± 2* | 0.24 ± 0.02*# | 15 ± 2* | 0.0078 ± 0.0020* |
| PAL-1046 | ||||
| 10 nM | 23 ± 9 | 0.13 ± 0.08 | 78 ± 9 | 0.0030 ± 0.0016 |
| 50 nM | 63 ± 8* | 0.16 ± 0.05 | 35 ± 7* | 0.0050 ± 0.003 |
| 250 nM | 79 ± 8* | 0.29 ± 0.07 | 20 ± 6* | 0.012 ± 0.006 |
| PAL-10451 | ||||
| 50 nM | 26 ± 65 | 0.025 ± 0.062 | 79 ± 67 | 0.0016 ± 0.0060 |
| 250 nM | 51 ± 17 | 0.051 ± 0.025 | 52 ± 18 | 0.0024 ± 0.0036 |
| 1250 nM | 84 ± 13 | 0.058 ± 0.015 | 19 ± 14 | 0.00094 ± 0.0070 |
| PAL-738 | ||||
| 50 nM | 18 ± 4 | 0.073 ± 0.029 | 81 ± 4 | 0.0018 ± 0.0005 |
| 250 nM | 49 ± 6* | 0.060 ± 0.10 | 48 ± 6* | 0.0035 ± 0.0013 |
| 1250 nM | 73 ± 6*# | 0.069 ± 0.008 | 25 ± 6*# | 0.0060 ± 0.0003 |
| PAL-1921 | ||||
| 600 nM | 39 ± 29 | 0.024 ± 0.017 | 64 ± 29 | 0.000 ± 0.003 |
| 3000 nM | 70 ± 21 | 0.027 ± 0.009 | 32 ± 22 | 0.000 ± 0.005 |
| 15,000 nM | 91 ± 15 | 0.032 ± 0.006 | 13 ± 15 | 0.000 ± 0.100 |
| PAL-1931 | ||||
| 600 nM | 26 ± 36 | 0.027 ± 0.036 | 76 ± 36 | 0.001 ± 0.003 |
| 3000 nM | 67 ± 25 | 0.030 ± 0.013 | 38 ± 26 | 0.001 ± 0.005 |
| 15,000 nM | 86 ± 17 | 0.036 ± 0.009 | 16 ± 18 | 0.0003 ± 0.009 |
P < 0.01 compared with the corresponding parameter of the lowest concentration of test drug.
P < 0.01 compared with the corresponding parameter of the middle concentration of test drug.
For the partial substrates (PAL-192, PAL-193, and PAL-1045), thet tests among individual parameters were all nonsignificant, so theF-test, as described underMaterials and Methods, was used to test for statistical significance between corresponding curves. For all of these drugs, each curve was statistically different from the other curves (P < 0.0001).
Figure 2 shows the time course for DAT-mediated efflux of [3H]MPP+ induced by PAL-1045 (Fig. 2A) and PAL-738 (Fig. 2B), which are substrates withEMAX values of 78 ± 5 and 70 ± 8%, respectively. In contrast to the effects ofd-amphetamine and PAL-1046, the highest concentration of each drug did not produce complete efflux over the 2-h observation period. Instead, the efflux curve seemed to plateau. The entire set of data for each drug was simultaneously fit to one- and two-component dissociation models, with the two-component model fitting significantly better than the one-component model. The best-fit parameters of the two-component model are shown inTable 2. As observed ford-amphetamine and PAL-1046, these compounds increased A1 in a dose-dependent manner. The fast rate constant (K1) observed for the highest concentrations of PAL-1045 and PAL-738 (∼0.06 min−1) was significantly lower than that observed for the highest concentrations of the full substratesd-amphetamine and PAL-1046 (∼0.2 min−1). Moreover, the slow rate constant (K2) observed for the highest concentrations of PAL-1045 (∼0.001 min−1) was approximately 10-fold lower than that observed for the highest concentrations of the full substratesd-amphetamine and PAL-1046 (∼0.01 min−1). Within the experimental error, the K2 values for PAL-192 and PAL-193 were essentially zero.
Fig. 2.

Effect of PAL-1045 (A) and PAL-738 (B) on DAT-mediated [3H]MPP+ efflux. Efflux experiments were conducted as described underMaterials and Methods. The data were fit to a biexponential decay equation, and the best-fit estimates of the four parameters are shown inTable 3. Each point is the mean ± S.D. (n = 3).
Figure 3 shows the time course for DAT-mediated efflux of [3H]MPP+ induced by PAL-192 (Fig. 3A) and PAL-193 (Fig. 3B), which are substrates withEMAX values of 61 ± 2 and 65 ± 2%, respectively. In contrast to the effects ofd-amphetamine and PAL-1046 (Fig. 1), the efflux curves produced by PAL-192 and PAL-193 seemed to plateau at all three concentrations tested. As reported above for PAL-1045 and PAL-738, the two-component model fit the efflux data significantly better than the one-component model. Increasing concentrations of PAL-192 and PAL-193 increased the A1 value in a dose-dependent manner, but did not alter the fast rate constant (K1), which with a value of ∼0.04 min−1, was significantly slower than that observed with the highest concentrations of PAL-1045 and PAL-738 (∼0.06 min−1). The slow rate (K2) for PAL-192 and for PAL-193 did not differ significantly from zero.
Fig. 3.

Effect of PAL-192 (A) and PAL-193 (B) on DAT-mediated [3H]MPP+ efflux. Efflux experiments were conducted as described underMaterials and Methods. The data were fit to a biexponential decay equation, and the best-fit estimates of the four parameters are shown inTable 3. Each point is the mean ± S.D. (n = 3).
The ultra-low or zero K2 value observed for the partial substrates PAL-1045, PAL-738, PAL-192, and PAL-193 indicates that there will always be a component of efflux that is so slow that the overall efflux curve plateaus. When conducting a release dose-response experiment, samples are routinely filtered at 30 min, providing a time slice of an efflux curve. The fact that the efflux curves of the partial substrates plateau could therefore explain theEMAX values less than 100% in the release dose-response curves generated by these compounds (Table 1). At a 30-min filtration time, even high concentrations of the partial substrates would not have produced complete efflux, resulting in anEMAX value <100%. To test this hypothesis, we generated release dose-response curves and filtered the samples at the standard 30-min time point and also at a 60-min time point. The prediction of this experiment is that theEMAX value observed at 60 min would be higher than theEMAX observed at 30 min.
Figure 4 shows the results obtained with PAL-192 (Fig. 4A) and PAL-193 (Fig. 4B). TheEMAX values of PAL-192 and PAL-193 at the 30-min time point were 61 ± 1 and 65%, respectively. At the 60-min time point, however, theEMAX values were 88 ± 1 and 89 ± 1%, respectively. Similar results were obtained for [3H]5-HT release using PAL-153 (Fig. 5A) and PAL-175 (Fig. 5B), except that samples were filtered at the standard 5-min time point as well as at 15 min. TheEMAX values of PAL-153 and PAL-175 at the 5-min time point were 54 ± 3 and 57 ± 4%, respectively. At the 15-min time point, however, theEMAX values were 75 ± 2 and 80 ± 3%, respectively. An analogous experiment that measured NET-mediated [3H]MPP+ release (Fig. 6) using PAL-218 showed that theEMAX value increased from 62 ± 3% at the standard filtration time of 30 min to 76 ± 3% at 60 min.
Fig. 4.

Effect of time on PAL-192- and PAL-193-induced DAT-mediated [3H]MPP+ efflux. Release experiments were conducted as described underMaterials and Methods. Samples were filtered at the standard time (30 min) and 60 min. The data were fit to the dose-response curve equation for the best-fit estimates of the EC50 andEMAX values. Each value is ± S.D. (n = 3).
Fig. 5.

Effect of time on PAL-153- and PAL-175-induced SERT-mediated [3H]5-HT efflux. Release experiments were conducted as described underMaterials and Methods. Samples were filtered at the standard time (5 min) and 15 min. The data were fit to the dose-response curve equation for the best-fit estimates of the EC50 andEMAX values. Each value is ± S.D. (n = 3).
Fig. 6.

Effect of time on PAL-218-induced NET-mediated [3H]MPP+ efflux. Release experiments were conducted as described underMaterials and Methods. Samples were filtered at the standard time (30 min) and 60 min. The data were fit to the dose-response curve equation for the best-fit estimates of the EC50 andEMAX values. Each value is ± S.D. (n = 6).
To confirm that the agents studied here were BAT substrates, we conducted “shift” experiments in which a substrate dose-response curve was generated in the absence and presence of a fixed concentration of a known BAT inhibitor. The expected result is that the BAT inhibitor will shift the substrate dose-response curve to the right, thereby permitting calculation of aKe value according to standard pharmacological equations. An example of such an experiment is shown inFig. 7 ford-amphetamine-induced release of [3H]MPP+ from dopaminergic nerve terminals. Both cocaine (1 μM) and 1-[2-[bis(4-fluorophenyl)methoxy]ethyl]-4-(3-phenylpropyl)piperazine (GBR12909) (0.5 nM) shifted thed-amphetamine curve to the right without changing theEMAX value. The results obtained from similar experiments are shown inTable 3. For all of the drugs tested, cocaine andGBR12909 shifted the curves to the right without significantly affecting theEMAX values, which is consistent with these PAL compounds being substrates. It is noteworthy that theKe value of cocaine was not the same for each substrate. Rather, theKe value ranged from 54 nM for PAL-193 to 335 nM for PAL-1045. A similar pattern was observed forGBR12909. In this case, theKe value ranged from 0.038 nM for PAL-193 to 1.26 nM for PAL-1045. TheKe values of cocaine, ranked by order of potency, were: PAL-193 > PAL-192 >PAL-287 >d- amphetamine > PAL-1045 = PAL-1046. TheKe values ofGBR12909, ranked by order of potency, were similar: PAL-193 > PAL-192 >d-amphetamine > PAL-287 > PAL-1046 > PAL-1045. TheKe values of cocaine andGBR12909 were highly correlated (data not shown;r2 = 0.74,p = 0.03).
Fig. 7.

Effect of cocaine andGBR12909 ond-amphetamine-mediated DAT release.d-Amphetamine dose-response curves were generated in the absence and presence of cocaine (1 μM) andGBR12909 (0.5 nM). The data were fit to the dose-response equation for the best-fit estimates of the EC50 andEMAX values (Table 3). Each value is ± S.D. (n = 3).
TABLE 3.
Shift experiments of substrates for DAT-mediated [3H]MPP+ release
Eight point dose-response curves were generated for DAT-mediated [3H]MPP+ release in the absence and presence of the indicated blockers (cocaine andGBR12909). The data (n = 3) were fit to the dose-response equation as described underMaterials and Methods for the best-fit estimates of the EC50 (nM ± S.D.) andEMAX (% ± S.D.) values. ApparentKe values (nM) were calculated as described underMaterials and Methods.
| Drug | No Blocker | Cocaine, 1.0 μM | GBR12909, 0.5 nM |
|---|---|---|---|
| d-Amphetamine | |||
| EC50 | 6.4 ± 1.0 | 40 ± 6 | 21 ± 3 |
| EMAX | 102 ± 5 | 107 ± 4 | 107 ± 4 |
| Ke | 190 ± 28 | 0.22 ± 0.03 | |
| PAL-192 | |||
| EC50 | 644 ± 128 | 5546 ± 1527 | 5818 ± 833 |
| EMAX | 77 ± 3 | 56 ± 5* | 70 ± 3* |
| Ke | 131 ± 36 | 0.062 ± 0.009 | |
| PAL-193 | |||
| EC50 | 202 ± 75 | 3917 ± 734 | 2878 ± 385 |
| EMAX | 70 ± 5 | 53 ± 3* | 62 ± 2* |
| Ke | 54 ± 10 | 0.038 ± 0.005 | |
| PAL-287 | |||
| EC50 | 14 ± 3 | 94 ± 19 | 31 ± 4 |
| EMAX | 97 ± 5 | 108 ± 7 | 102 ± 3 |
| Ke | 175 ± 35 | 0.41 ± 0.05 | |
| PAL-1045 | |||
| EC50 | 106 ± 19 | 422 ± 99 | 148 ± 14 |
| EMAX | 84 ± 3 | 79 ± 4 | 81 ± 1 |
| Ke | 335 ± 78 | 1.26 ± 0.12 | |
| PAL-1046 | |||
| EC50 | 15 ± 4 | 64 ± 12 | 29 ± 2 |
| EMAX | 100 ± 5 | 101 ± 4 | 100 ± 1 |
| Ke | 306 ± 57 | 0.54 ± 0.04 |
P < 0.05 compared with theEMAX value of the “no blocker” condition (Student'st test).
In vivo microdialysis experiments determined the effects of saline (SAL), PAL-287 (full substrate at DAT/SERT), PAL-1046 (full substrate at DAT/SERT), and PAL-1045 (partial substrate at DAT/SERT) on extracellular DA and 5-HT in the nucleus accumbens. As shown inFig. 8A, administration of these drugs produced a highly significant elevation of extracellular DA (Fdrug effect = 32.9,p < 0.001;Ftime = 18.8,p < 0.001;Finteraction = 4.77,p < 0.001).Figure 8B shows the peak effects produced by drug administration (1 and 3 mg/kg). Both PAL-287 and PAL-1046 produced a dose-dependent increase in DA. However, the partial substrate PAL-1045 had a “flat” dose-response curve, and its peak effect at 3 mg/kg was significantly less than that of the full substrate PAL-1046. Drug administration also produced a highly significant elevation of extracellular 5-HT (Fig. 9) (Fdrug effect = 59.9,p < 0.001;Ftime = 44.1,p < 0.001;Finteraction = 7.97,p < 0.001).Figure 9B shows the peak effects produced by drug administration (1 and 3 mg/kg). Both PAL-287 and PAL-1046 produced a dose-dependent increase in 5-HT. However, the partial substrate PAL-1045 had a flatter dose-response curve, and its peak effect at 3 mg/kg was significantly less than that of the full substrate PAL-1046.
Fig. 8.

Effect of drug administration on extracellular dopamine in the nucleus accumbens. SAL, PAL-1045, PAL-1046, and PAL-287 were administered intravenously (1 mg/kg at time 0; 3 mg/kg at 60 min, see arrows). A, the time course. Two-way ANOVA revealed a highly significant elevation of extracellular DA (Fdrug effect = 32.9,p < 0.001;Ftime= 18.8,p < 0.001;Finteraction = 4.77,p < 0.001). B, the mean effect observed in the three samples after each injection. Each value is the mean ± S.E.M. (n = 7–8). *,p < 0.01 compared with control (one-way ANOVA followed by Newman-Keul's post hoc test). #,p < 0.01 compared with PAL-1046 (one-way ANOVA followed by Newman-Keul's post hoc test).
Fig. 9.

Effect of drug administration on extracellular 5-HT in the nucleus accumbens. SAL, PAL-1045, PAL-1046, and PAL-287 were administered intravenously (1 mg/kg at time 0; 3 mg/kg at 60 min, see arrows). A, the time course. Two-way ANOVA revealed a highly significant elevation of extracellular DA (Fdrug effect = 59.9,p < 0.001;Ftime = 44.1,p < 0.001;Finteraction = 7.97,p < 0.001). B, the mean effect observed in the three samples after each injection. Each value is the mean ± S.E.M. (n = 7–8). *,p < 0.01 compared with control (one-way ANOVA followed by Newman-Keul's post hoc test). #,p < 0.01 compared with PAL-287 and PAL-1046 (one-way ANOVA followed by Newman-Keul's post hoc test).
Similar results were observed for horizontal locomotor activity (Fig. 10). Drug administration produced a highly significant increase in horizontal locomotor activity (Fig. 10A) (Fdrug effect = 39.9,p < 0.001;Ftime = 20.0,p < 0.001;Finteraction = 4.84,p < 0.001).Figure 10B reports the peak effects produced by drug administration (1 and 3 mg/kg). Both PAL-287 and PAL-1046 produced a dose-dependent increase in horizontal locomotor activity. However, PAL-1045 had a “flat” dose-response curve, and its peak effect at 3 mg/kg was significantly less than that of PAL-1046 and PAL-287.Figure 11 shows the effect of drug administration on stereotypy. Drug administration produced a significant increase in repetitive movements (Fig. 11A) (Fdrug effect = 23.0,p < 0.001;Ftime = 14.0,p < 0.001;Finteraction = 2.71,p < 0.001). Modest significant increases in stereotypy were observed at the 3 mg/kg doses for all test drugs. Differences in the effects of PAL-1045 and PAL-1046 were not statistically significant.
Fig. 10.

Effect of drug administration on horizontal locomotor activity. These data were gathered concurrently with the experiments shown inFigs. 8 and9. A, the time course. Arrows indicate time of drug administration. Two-way ANOVA revealed a highly significant increase in horizontal locomotor activity (HAL) (Fdrug effect = 39.9,p < 0.001;Ftime = 20.0,p < 0.001;Finteraction = 4.84,p < 0.001). B, the mean effect observed in the three samples after each injection. Each value is the mean ± S.E.M. (n = 7–8). *,p < 0.01 compared with control (one-way ANOVA followed by Newman-Keul's post hoc test). #,p < 0.01 compared with PAL-287 and PAL-1046 (one-way ANOVA followed by Newman-Keul's post hoc test).
Fig. 11.

Effect of drug administration on stereotypy. These data were gathered concurrently with the experiments shown inFigs. 8 and9. A, the time course. Arrows indicate time of drug administration. Two-way ANOVA revealed a highly significant increase in stereotypy (Fdrug effect = 23.0,p < 0.001;Ftime = 14.0,p < 0.001;Finteraction = 2.71,p < 0.001). B, the mean effect observed in the three samples after each injection. Each value is the mean ± S.E.M. (n = 7–8). *,p < 0.01 compared with control (one-way ANOVA followed by Newman-Keul's post hoc test).
Discussion
As noted in theIntroduction, BAT ligands are classically divided into uptake inhibitors and releasers. Releasers are BAT substrates, and the inward transport of a BAT substrate, together with Na+ and Cl−, leads to the countertransport of endogenous neurotransmitter out of the nerve terminal. Resolution of the structure of the bacterial LeuTAa transporter (Yamashita et al., 2005;Shi et al., 2008) identified two substrate binding sites (S1 and S2), suggesting that the BATs might also possess two substrate binding sites, where the binding of a substrate to S2 triggers the release of substrate bound to S1 and Na+ into the intracellular compartment (Nyola et al., 2010;Schmitt et al., 2010). These findings emphasize the importance of conformational changes to transporter function (Ferrer and Javitch, 1998;Reith et al., 2001;Gether et al., 2006) and raise the possibility that the actions of the two BAT binding sites might differ. Data in the literature support this idea. For example,Goodwin et al. (2009) reported that methamphetamine inhibited DAT-mediated dopamine clearance more efficiently than amphetamine. Moreover, we recently reported that some SERT inhibitors decrease the efficacy of substrate-mediated release of [3H]5-HT from rat brain synaptosomes (Rothman et al., 2010).Gobbi et al. (2008) reported that both 4-methyl-thioamphetamine and its dimethyl analog (N,N-dimethyl-4-methyl-thioamphetamine) released preloaded [3H]5-HT from superfused rat brain synaptosomes and human embryonic kidney cells that express the cloned human SERT with lower efficacy thanp-chloroamphetamine. An earlier study also reported thatm-chlorophenylpiperazine and 3,4-methylenedioxymethamphetamine were partial SERT substrates (Gobbi et al., 2002). The data reported in the present study confirm and extend these observations. We report a wide range of partial BAT substrates and show that the partial release profile of these agents probably results from a slower rate of neurotransmitter efflux than is observed with full substrates.
Over the course of evaluating several hundred members of the PAL library, only a few drugs were noted to be partial releasers (Table 1). Nevertheless, the data reported here illustrate that partial releaser activity is observed at all three BATs, and a drug can be a partial substrate at one BAT and a full substrate at the others (PAL-192 and PAL-193) or a partial substrate at all three BATs (PAL-218). It should be noted that PAL-192 [(±)-MDE] is the racemate of PAL-193 [(+)-MDE] and PAL-194 [(−)-MDE] and is a SERT releaser and weak uptake inhibitor at DAT and NET. The EC50 andEMAX values of PAL-192 and PAL-193 for DAT release are similar, indicating that the uptake inhibiting effects of (−)-MDE at DAT (IC50 = 4256 ± 191 nM) does not interfere with the more potent releasing effects of (+)-MDE.
To confirm that compounds classified as BAT substrates are indeed releasers, we conducted “substrate reversal” experiments as described elsewhere (Rothman et al., 2002). In these experiments an ∼ED80 dose of test drug was assayed in the appropriate release assay in the absence and presence of a blocking concentration of an appropriate uptake inhibitor, which by itself has minimal effect in the release assay. If the test drug is a releaser, its effect will be attenuated. All of the compounds described inTable 1 were confirmed as being substrates (data not shown). As a further test, we conducted shift experiments (Fig. 7;Table 3) in which a substrate dose-response curve is generated in the absence and presence of a fixed concentration of a known BAT inhibitor. A BAT inhibitor will shift the substrate dose-response curve to the right, thereby permitting calculation of aKe value according to standard pharmacological equations. The results showed that both cocaine and GBR1209 shifted thed-amphetamine, PAL-913, PAL-193, PAL-287, and PAL-1045 dose-response curves to the right. It is noteworthy that cocaine and GBR1209 also reduced theEMAX value of the PAL-192/PAL-193 dose-response curves, and theKe value of each uptake inhibitor was different for each test substrate. These data provide further support for the classification of these compounds as being partial substrates and also indicate greater complexity than can be described by simple competitive models (Nyola et al., 2010).
To test the hypothesis that partial substrates induce efflux of neurotransmitter at a slower rate than full substrates, we conducted efflux studies focused on DAT-mediated efflux of [3H]MMP+ because of the favorable signal-to-noise ratio of this assay. PAL-1046 andd-amphetamine illustrate the effects of full substrates on efflux (Fig. 1). As observed in our previous study withd-amphetamine (Rothman et al., 2009), the efflux curves were best-fit by a two-component dissociation model. As shown inTable 2, both compounds increased A1, the proportion of the faster dissociating component, in a dose-dependent manner. The rate constants observed with the highest concentration of PAL-1046 were similar to that observed with 100 nMd-amphetamine: K1 = ∼0.25 min−1 and K2 = ∼0.010 min−1. The partial substrates, PAL-1045, PAL-738, PAL-192, and PAL-193 (Figs. 2 and3), produced qualitatively similar efflux curves. A key difference in the efflux curves for the full substrates and the partial substrates was that the efflux curves of the partial substrates seemed to plateau. Consistent with this pattern, the slow rate constant (K2) observed for the highest concentrations of PAL-192/PAL-193 was essentially zero, and for the somewhat less partial substrates PAL-1045/PAL-738 (∼0.001 min−1 and 0.006 min−1), the rate constant (K2) was approximately 10-fold lower than that observed for the highest concentrations of the full substratesd-amphetamine and PAL-1046 (∼0.01 min−1). The fast rate constant (K1) observed for the highest concentrations of PAL-1045/PAL-738 (K1 = ∼0.06 min−1) and PAL-192/PAL-193 (K1 = ∼0.03 min−1) was significantly lower than that observed for the highest concentrations of the full substratesd-amphetamine and PAL-1046 (∼0.2 min−1). It is noteworthy that the value of K1 at the highest dose of test drug was highly correlated with theEMAX value of the test agent (r2 = 0.89;p < 0.01), indicating that the more “partial” the substrate, the lower the value of K1. Viewed collectively, the efflux experiments demonstrate that partial substrates promote DAT-mediated [3H]MPP+ efflux more slowly than full substrates.
As noted underResults, release curves such as those shown inTable 1 are a single time slice (at 30 min) of an efflux curve. The efflux experiments (Table 2) discussed above predict that with partial substrates theEMAX values observed at 60 min would be higher than theEMAX observed at the typical 30-min filtration time, because the longer time interval would provide more time for efflux. This prediction was confirmed for PAL-192/PAL-193 (Fig. 4) at DAT, PAL-153/PAL-175 at SERT (Fig. 5), and PAL-218 at NET (Fig. 6). These results provide further confirmation of the hypothesis that the “partiality” of the partial releasers reflects a slower rate of DAT-mediated [3H]MPP+ efflux.
The in vivo microdialysis experiments compared the effect of two full substrates (PAL-287 and PAL-1046) and one partial substrate (PAL-1045) on extracellular DA and 5-HT in the nucleus accumbens with simultaneous determination of horizontal locomotor activation and stereotypy (Figs. 8–11). As reported inTable 1, PAL-1046 and PAL-1045 are methyl- and ethyl-substituted PAL-287 analogs, suggesting that the increased steric size of PAL-1045 might account for its partial releaser profile. Given the intrinsic limitations of the microdialysis method, it was possible to generate only a limited dose-response curve for each drug. Despite this constraint, the results demonstrated that PAL-1046 and PAL-287 increased extracellular DA in a dose-dependent manner, whereas PAL-1045 did not (Fig. 8). Indeed, the PAL-1045 dose-response curve is best described as being “flat,” consistent with the low-efficacy partial substrate nature of this drug. In regard to extracellular 5-HT (Fig. 9), the full substrates (PAL-287 and PAL-1046) produced a robust increase in extracellular 5-HT as the dose was increased from 1 to 3 mg/kg. PAL-1045, in contrast, produced a much smaller increase in extracellular 5-HT as the dose was increased from 1 to 3 mg/kg, resulting in a flatter dose-response curve. Similar results were observed for horizontal locomotor activity (Fig. 10). Viewed collectively, these data support the hypothesis that a compound classified as a partial BAT substrate on the basis of an vitro release assay may act as a partial BAT substrate in vivo.
The major finding of this article is the identification of a novel type of BAT ligand: the partial substrate. A simple explanation of our findings is that some substrates affect neurotransmitter translocation more slowly, or less effectively, than full substrates. The underlying molecular mechanism for this remains to be determined, but could be related to subtle differences in the binding of these compounds to the BAT, resulting in conformational states that produce slower transport of the partial substrate into the nerve terminal. These results reinforce the possibility that new types of BAT ligands remain to be discovered. For example, it has been indicated that some DAT inhibitors favor the outward facing transporter compared with the inward facing transporter (Loland et al., 2008;Schmitt et al., 2008).
The possible therapeutic applications of partial substrates remain to be determined. BAT substrates and BAT uptake inhibitors both can increase extracellular biogenic amines, but, as reviewed elsewhere (Rothman and Baumann, 2006), differ fundamentally in their therapeutic applications. For example, ephedrine selectively releases norepinephrine (Rothman et al., 2003) and acts as a psychomotor (amphetamine-like) stimulant and anorectic agent, whereas selective norepinephrine uptake inhibitors lack psychomotor activity and are antidepressants. The flat dose-response curve observed for dopamine release by PAL-1045 (Fig. 8) suggests, for example, that this compound may have a lower abuse liability thand-amphetamine. Thus, it seems possible that partial BAT substrates could be developed into medications with low abuse potential that would be useful for treating addictive diseases, obesity, attention-deficit disorder, and other psychiatric disorders that have been linked to the BATs.
Article, publication date, and citation information can be found athttp://jpet.aspetjournals.org.
- BAT
- biogenic amine transporter
- DA
- dopamine
- DAT
- DA transporter
- 5-HT
- 5-hydroxytryptamine
- SERT
- 5-HT transporter
- NE
- norepinephrine
- NET
- NE transporter
- MPP+
- 1-methyl-4-phenylpyridinium
- SA
- specific activity
- NS
- nonspecific binding
- MR
- maximal release
- SR
- specific release
- ANOVA
- analysis of variance
- SAL
- saline
- MDE
- N-ethyl-3,4-methylenedloxyamphetamine
- GBR12935
- 1-(2-(diphenylmethoxy)ethyl)-4-(3-phenylpropyl)piperazine
- GBR12909
- 1-[2-[bis(4-fluorophenyl)methoxy]ethyl]-4-(3-phenylpropyl)piperazine
- PAL
- phenethylamine library
- PAL-1063
- 4-methyl-thioamphetamine
- PAL-1062
- N,N-dimethyl-4-methyl-thioamphetamine
- PAL-287
- (±)-1-(2-naphthyl)propan-2-amine
- PAL-1046
- (S)-N-methyl-1-(2-naphthyl)propan-2-amine
- PAL-1045
- (S)-N-ethyl-1-(2-naphthyl)propan-2-amine.
Authorship Contributions
Participated in research design: Rothman, Partilla, Baumann, and Blough.
Conducted experiments: Partilla and Lightfoot-Siordia.
Contributed new reagents or analytic tools: Blough.
Performed data analysis: Rothman, Partilla, Baumann, and Lightfoot-Siordia.
Wrote or contributed to the writing of the manuscript: Rothman, Partilla, Baumann, and Lightfoot-Siorda.
References
- Baumann MH, Clark RD, Rothman RB. (2008) Locomotor stimulation produced by 3,4-methylenedioxymethamphetamine (MDMA) is correlated with dialysate levels of serotonin and dopamine in rat brain. Pharmacol Biochem Behav90:208–217 [DOI] [PMC free article] [PubMed] [Google Scholar]
- Ferrer JV, Javitch JA. (1998) Cocaine alters the accessibility of endogenous cysteines in putative extracellular and intracellular loops of the human dopamine transporter. Proc Natl Acad Sci U S A95:9238–9243 [DOI] [PMC free article] [PubMed] [Google Scholar]
- Gether U, Andersen PH, Larsson OM, Schousboe A. (2006) Neurotransmitter transporters: molecular function of important drug targets. Trends Pharmacol Sci27:375–383 [DOI] [PubMed] [Google Scholar]
- Gobbi M, Funicello M, Gerstbrein K, Holy M, Moya PR, Sotomayor R, Forray MI, Gysling K, Paluzzi S, Bonanno G, et al. (2008)N,N-dimethyl-thioamphetamine and methyl-thioamphetamine, two non-neurotoxic substrates of 5-HT transporters, have scant in vitro efficacy for the induction of transporter-mediated 5-HT release and currents. J Neurochem105:1770–1780 [DOI] [PMC free article] [PubMed] [Google Scholar]
- Gobbi M, Moia M, Pirona L, Ceglia I, Reyes-Parada M, Scorza C, Mennini T. (2002)p-Methylthioamphetamine and 1-(m-chlorophenyl)piperazine, two non-neurotoxic 5-HT releasers in vivo, differ from neurotoxic amphetamine derivatives in their mode of action at 5-HT nerve endings in vitro. J Neurochem82:1435–1443 [DOI] [PubMed] [Google Scholar]
- Goodwin JS, Larson GA, Swant J, Sen N, Javitch JA, Zahniser NR, De Felice LJ, Khoshbouei H. (2009) Amphetamine and methamphetamine differentially affect dopamine transporters in vitro and in vivo. J Biol Chem284:2978–2989 [DOI] [PMC free article] [PubMed] [Google Scholar]
- Jardetzky O. (1966) Simple allosteric model for membrane pumps. Nature211:969–970 [DOI] [PubMed] [Google Scholar]
- Kanner BI, Zomot E. (2008) Sodium-coupled neurotransmitter transporters. Chem Rev108:1654–1668 [DOI] [PubMed] [Google Scholar]
- Loland CJ, Desai RI, Zou MF, Cao J, Grundt P, Gerstbrein K, Sitte HH, Newman AH, Katz JL, Gether U. (2008) Relationship between conformational changes in the dopamine transporter and cocaine-like subjective effects of uptake inhibitors. Mol Pharmacol73:813–823 [DOI] [PubMed] [Google Scholar]
- Matthews JN, Altman DG, Campbell MJ, Royston P. (1990) Analysis of serial measurements in medical research. BMJ300:230–235 [DOI] [PMC free article] [PubMed] [Google Scholar]
- Nandi A, Dersch CM, Kulshrestha M, Ananthan S, Rothman RB. (2004) Identification and characterization of a novel allosteric modulator (SoRI-6238) of the serotonin transporter. Synapse53:176–183 [DOI] [PubMed] [Google Scholar]
- Nightingale B, Dersch CM, Boos TL, Greiner E, Calhoun WJ, Jacobson AE, Rice KC, Rothman RB. (2005) Studies of the biogenic amine transporters. XI. Identification of a 1-[2-[bis(4-fluorophenyl)methoxy]ethyl]-4-(3-phenylpropyl)piperazine (GBR12909) analog that allosterically modulates the serotonin transporter. J Pharmacol Exp Ther314:906–915 [DOI] [PubMed] [Google Scholar]
- Nyola A, Karpowich NK, Zhen J, Marden J, Reith ME, Wang DN. (2010) Substrate and drug binding sites in LeuT. Curr Opin Struct Biol20:415–422 [DOI] [PMC free article] [PubMed] [Google Scholar]
- Pariser JJ, Partilla JS, Dersch CM, Ananthan S, Rothman RB. (2008) Studies of the biogenic amine transporters. 12. Identification of novel partial inhibitors of amphetamine-induced dopamine release. J Pharmacol Exp Ther326:286–295 [DOI] [PMC free article] [PubMed] [Google Scholar]
- Paxinos G, Watson C. (1986) The Rat Brain in Stereotaxic Coordinates. Academic Press, New York [Google Scholar]
- Pifl C, Wolf A, Rebernik P, Reither H, Berger ML. (2009) Zinc regulates the dopamine transporter in a membrane potential and chloride dependent manner. Neuropharmacology56:531–540 [DOI] [PubMed] [Google Scholar]
- Reith ME, Berfield JL, Wang LC, Ferrer JV, Javitch JA. (2001) The uptake inhibitors cocaine and benztropine differentially alter the conformation of the human dopamine transporter. J Biol Chem276:29012–29018 [DOI] [PubMed] [Google Scholar]
- Rothman RB, Baumann MH. (2006) Therapeutic potential of monoamine transporter substrates. Curr Top Med Chem6:1845–1859 [DOI] [PubMed] [Google Scholar]
- Rothman RB, Baumann MH, Blough BE, Jacobson AE, Rice KC, Partilla JS. (2010) Evidence for noncompetitive modulation of substrate-induced serotonin release. Synapse64:862–869 [DOI] [PMC free article] [PubMed] [Google Scholar]
- Rothman RB, Baumann MH, Dersch CM, Romero DV, Rice KC, Carroll FI, Partilla JS. (2001) Amphetamine-type central nervous system stimulants release norepinephrine more potently than they release dopamine and serotonin. Synapse39:32–41 [DOI] [PubMed] [Google Scholar]
- Rothman RB, Dersch CM, Ananthan S, Partilla JS. (2009) Studies of the biogenic amine transporters. 13. Identification of “agonist” and “antagonist” allosteric modulators of amphetamine-induced dopamine release. J Pharmacol Exp Ther329:718–728 [DOI] [PMC free article] [PubMed] [Google Scholar]
- Rothman RB, Katsnelson M, Vu N, Partilla JS, Dersch CM, Blough BE, Baumann MH. (2002) Interaction of the anorectic medication, phendimetrazine, and its metabolites with monoamine transporters in rat brain. Eur J Pharmacol447:51–57 [DOI] [PubMed] [Google Scholar]
- Rothman RB, Reid A, Mahboubi A, Kim CH, De Costa BR, Jacobson AE, Rice KC. (1991) Labeling by [3H]1,3-di(2-tolyl)guanidine of two high affinity binding sites in guinea pig brain: evidence for allosteric regulation by calcium channel antagonists and pseudoallosteric modulation by σ ligands. Mol Pharmacol39:222–232 [PubMed] [Google Scholar]
- Rothman RB, Vu N, Partilla JS, Roth BL, Hufeisen SJ, Compton-Toth BA, Birkes J, Young R, Glennon RA. (2003) In vitro characterization of ephedrine-related stereoisomers at biogenic amine transporters and the receptorome reveals selective actions as norepinephrine transporter substrates. J Pharmacol Exp Ther307:138–145 [DOI] [PubMed] [Google Scholar]
- Schmitt KC, Mamidyala S, Biswas S, Dutta AK, Reith ME. (2010) Bivalent phenethylamines as novel dopamine transporter inhibitors: evidence for multiple substrate-binding sites in a single transporter. J Neurochem112:1605–1618 [DOI] [PMC free article] [PubMed] [Google Scholar]
- Schmitt KC, Zhen J, Kharkar P, Mishra M, Chen N, Dutta AK, Reith ME. (2008) Interaction of cocaine-, benztropine-, and GBR12909-like compounds with wild-type and mutant human dopamine transporters: molecular features that differentially determine antagonist-binding properties. J Neurochem107:928–940 [DOI] [PMC free article] [PubMed] [Google Scholar]
- Shi L, Quick M, Zhao Y, Weinstein H, Javitch JA. (2008) The mechanism of a neurotransmitter:sodium symporter–inward release of Na+ and substrate is triggered by substrate in a second binding site. Mol Cell30:667–677 [DOI] [PMC free article] [PubMed] [Google Scholar]
- Sitte HH, Freissmuth M. (2010) The reverse operation of Na+/Cl−-coupled neurotransmitter transporters–why amphetamines take two to tango. J Neurochem112:340–355 [DOI] [PMC free article] [PubMed] [Google Scholar]
- Torres GE, Gainetdinov RR, Caron MG. (2003) Plasma membrane monoamine transporters: structure, regulation and function. Nat Rev Neurosci4:13–25 [DOI] [PubMed] [Google Scholar]
- Yamashita A, Singh SK, Kawate T, Jin Y, Gouaux E. (2005) Crystal structure of a bacterial homologue of Na+/Cl-dependent neurotransmitter transporters. Nature437:215–223 [DOI] [PubMed] [Google Scholar]
- Zolkowska D, Jain R, Rothman RB, Partilla JS, Roth BL, Setola V, Prisinzano TE, Baumann MH. (2009) Evidence for the involvement of dopamine transporters in behavioral stimulant effects of modafinil. J Pharmacol Exp Ther329:738–746 [DOI] [PMC free article] [PubMed] [Google Scholar]