


Temporal induction pattern of STAT4 target genes defines potential for Th1 lineage-specific programming1
Seth R Good
Vivian T Thieu
Anubhav N Mathur
Qing Yu
Gretta L Stritesky
Norman Yeh
John T O'Malley
Narayanan B Perumal
Mark H Kaplan
To whom correspondence should be addressed. Mark H. Kaplan, Ph.D., Departments of Pediatrics, and Microbiology and Immunology, Indiana University School of Medicine, HB Wells Center for Pediatric Research, 702 Barnhill Drive, RI 2600, Indianapolis, IN 46202, 317-278-3696, 317-274-5378 (FAX),mkaplan2@iupui.edu ornperumal@iupui.edu
SRG and VTT contributed equally.
Issue date 2009 Sep 15.
Abstract
The Signal Transducer and Activator of Transcription factor STAT4 is a critical component in the development of inflammatory adaptive immune responses. It has been extensively characterized as a lineage-determining factor in Th1 development. However, the genetic program activated by STAT4 that results in an inflammatory cell type is not well defined. In this report we use DNA isolated from STAT4-chromatin immunoprecipitation to perform ChIP-on-chip analysis of over 28,000 mouse gene promoters to identify STAT4 targets. We demonstrate that STAT4 binds multiple gene-sets that program distinct components of the Th1 lineage. While many STAT4 target genes display STAT4-dependent IL-12-inducible expression, other genes displayed IL-12-induced histone modifications but lack induction, possibly due to high relative basal expression. In the subset of genes that STAT4 programs for expression in Th1 cells, IL-12-induced mRNA levels remain increased for a longer time than mRNA from genes that are not programmed. This suggests that STAT4 binding to target genes, while critical, is not the only determinant for STAT4-dependent gene programming during Th1 differentiation.
Introduction
The T helper 1 (Th1) cell is responsible for cell-mediated immune functions including eradication of intracellular pathogens. The Signal Transducer and Activator of Transcription, STAT4, is required for the development of Th1 cells from naïve CD4+ T cells and most IL-12-stimulated functions (1,2). STAT4-deficient mice are highly susceptible to infection by intracellular pathogens but are resistant to T cell-mediated autoimmune diseases (1). In humans, STAT4 also mediates IL-12 functions and SNPs in the STAT4 gene correlate with susceptibility to autoimmune disease (3,4). How STAT4 establishes the Th1 genetic program remains unclear.
Following activation, STAT4 binds to cis-regulatory regions of several genes to induce gene expression, though relatively few of these have been directly identified. In humans STAT4 has been shown to bind toIFNG andIL12RB2, and in mouseIfng,Hlx1 andIl18r1 (5-10). However, a much larger set of genes appears to rely on STAT4 for expression in the Th1 differentiation program (9,11,12). It is possible that the ability of STAT4 to activate an inflammatory genetic program can be understood better by a genome-wide analysis of target gene promoters. Recently, a number of studies have employed chromatin immunoprecipitation followed by microarray analysis (ChIP-on-chip) or large-scale sequencing of the bound targets (ChIP-seq) to identify, characterize and analyze transcription of genes controlled by transcription factors (13,14). These studies provide a global picture of transcription factor-target gene interactions in the physiological state. Such a ChIP-on-chip study may reveal STAT4-mediated transcriptional regulatory networks active in Th1 cell development.
In this report we have performed ChIP-on-chip experiments for STAT4. Using informatics and biological interrogation of the data, we have identified additional aspects of the STAT4-dependent genetic program and activation patterns that predict potential programming of Th1-specific gene expression. Moreover, we identify additional STAT4 target genes that may play a role in the inflammatory cell phenotype. These data establish a framework for genome-wide understanding of the transcription factor network that regulates inflammatory immune responses.
Materials and Methods
T cell preparation and analysis
For ChIP-on-chip experiments CD4+ T cells from C57BL/6 mice were activated for three days with anti-CD3 and anti-CD28. Cells were washed and incubated in the presence or absence of 5 ng/ml IL-12 for four hours before being processed for ChIP analysis by Genpathway. For analysis of gene induction and histone modification, wild type andStat4-/- Balb/c mice were activated for three days as above before RNA was isolated from cells that were unstimulated or stimulated with 5 ng/ml IL-12 for 4 or 18 hours. Generation of Th1 cultures and quantitative (real-time) PCR was performed as described (15). ELISA for TNFα was performed using reagents from BD Pharmingen. DAPA and ChIP was performed as described (8). ERK immunoblots were performed using standard methods (8).
FactorPath ChIP-on-Chip
Preparation of cells for ChIP-on-chip was performed at GenPathway (16). Cells prepared as above were fixed with 1% formaldehyde for 15 min and quenched with 0.125 M glycine. Cell lysates were sonicated to an average DNA fragment length of 300-500 bp. Genomic DNA from aliquots was purified for use as input. Chromatin was precleared with protein A agarose beads (Invitrogen) and STAT4-bound DNA sequences were isolated using specific antibodies (Santa Cruz sc-486). Complexes were precipitated with protein A agarose beads, washed, eluted from the beads with SDS buffer, and subjected to RNase and proteinase K treatment. Crosslinks were reversed by incubation overnight at 65°C, and ChIP DNA was purified by phenol-chloroform extraction and ethanol precipitation. Quantitative PCR (Q-PCR) reactions were carried out in triplicate on specific genomic regions using SYBR Green Supermix (Bio-Rad). The resulting signals were normalized for primer efficiency by carrying out Q-PCR for each primer pair using input DNA.
Analysis of ChIP DNA by Affymetrix tiling arrays was carried out by GenPathway. ChIP (multiple reactions) and input DNAs were amplified using LM-PCR. The resulting amplified DNA was purified, quantified, and tested by QPCR at the same specific genomic regions as the original ChIP DNA to assess quality of the amplification reactions. Amplified DNA was fragmented and labeled using the DNA Terminal Labeling Kit from Affymetrix, and hybridized to the Affymetrix GeneChip Mouse Promoter 1.0R Array at 45°C overnight. This array contains over 4.6 million 25-mer oligos tiled to interrogate over 28,000 mouse promoter regions (-7.5 kb to +2.5kb relative to the transcription start site). Arrays were scanned and the resulting CEL files were analyzed using Affymetrix TAS software that computed estimates of fold-enrichment over hybridization with input DNA in linear scale. This metric is referred to as peak binding intensity. Thresholds were selected, and the resulting BED files containing lists of sequence intervals with significant binding detected were analyzed using Genpathway software that provides comprehensive information on genomic annotation, peak metrics and sample comparisons for all peaks (intervals). Graphing of peak binding values were generated using the Affymetrix Integrated Genome Browser. The entire dataset is submitted to the NCBI GEO database (GSE16845;www.ncbi.nlm.nih.gov/geo/query/acc.cgi?acc=GSE16845).
Intersects of our dataset with previously published datasets were determined using Microsoft Excel. Published datasets that were used for analysis of common genes were from naïve Balb/c mouse Th cells cultured under Th1 conditions for 0, 2, 6 and 48 hours (MG-U74Av2 arrays containing 12,488 probes)(12), differentiated C57BL/6 mouse Th1 cells stimulated with IL-12 for 18 hours (custom array with 24,000 probes)(11), differentiated human Th1 cells stimulated with IL-12 for 4 or 24 hours (HuGeneFL array containing 6000 genes)(17), and PHA/IL-2 activated human T cells stimulated with IL-12 for 6 hours (U133A and U133B arrays)(18).
MEME Analysis
The 1111 interval sequences with peak intensity > 4, which were in close proximity to 1540 genes, were screened by MEME (19) to find over-represented motifs. The parameters for MEME included looking at the reverse complement sequence, a maximum motif width of 15, and a cutoff of 30 motifs ordered by increasing E-value. The analysis was run using three different approaches regarding the number of times the motif repeated, any number of repeats, zero or one repeat, and one or more repeats with virtually the same results each time. WebLogo (20) generated the motif logos using the aligned site occurrences for each motif given by MEME.
GO Analysis
The Gene Ontology (GO) analysis was performed by GOStat (21). Using an input list and a selected background, GOStat determines enriched GO terms based on a Fisher exact test. The p-value from the Fisher exact test is altered using a Benjamini correction. Only terms with a corrected p-value less than 0.1 are reported. The analysis was performed three times with the curated gene list as the input and the Affymetrix chip gene list as the background.
Results
Generation and analysis of STAT4 ChIP-on-chip data
To identify STAT4 target genes, CD4+ T cells were activated for three days with anti-CD3 before washed cells were stimulated with IL-12 for 4 hours and chromatin was immunoprecipitated with anti-STAT4 antibody. The pre-activation was performed to allow cells to acquire IL-12 responsiveness (22). IL-12 stimulation of activated cells resulted in 70-80% of cells in the population becoming pSTAT4-positive with a 6-fold increase in mean fluorescence intensity, as assessed by intracellular staining (data not shown). To confirm STAT4 binding to target genes, we testedIl18r1 promoter and theIl2ra PRRIII element DNA in the precipitate following IL-12 stimulation (8,23) and observed a greater than 30-fold induction of STAT4 binding, compared to unstimulated cells (Fig. 1A). DNA from the ChIP was then hybridized to an Affymetrix array containing sequences spanning −7.5kB to +2.5kb of over 28,000 promoters in the mouse genome and enrichment was calculated based on comparison to an array hybridized with input DNA. In replicate experiments, the ChIP-on-chip analysis identified a total of 4,669 genes as near a STAT4 binding sitein vivo. The peak binding intensities (see definition in Materials and Methods) of immunoprecipitated DNA hybridizing to the promoter oligonucleotides showed a wide range (2.2 to 32.4, with the highest value being the most intense binding) indicating the diverse nature of STAT4 binding to target genes. Mean and median of this data set were at 4.4 and 3.3 respectively (Fig. 1B). A manual inspection of the data showed many of the known STAT4 target and Th1-associated genes to have peak intensities of 4 or higher. Thus, we filtered the list of genes using a cutoff peak intensity of 4 (1111 binding sites corresponding to 1540 genes) referred to as the “curated” list and all subsequent analyses were performed on this curated gene set (Table S1). We confirmed binding of STAT4 to genes with a range of peak intensities from 4.5 to 21 using ChIP assay in wild type andStat4-/- activated T cells. The enrichment of percent input between wild type andStat4-/- samples was similar to the enrichment observed between IL-12 stimulated and unstimulated cells (Fig. 1A and2). These results further confirm the identification of STAT4 targets in this dataset.
Figure 1.
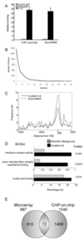
STAT4 binding in target gene promoters. A, Wild type CD4+ T cells were activated for three days and cultured in the presence or absence of IL-12 for four hours. ChIP analysis was performed for STAT4 or control IgG and qPCR was performed to determine STAT4 binding at the indicated target sequences. The scale indicates relative binding that is normalized to input DNA. B, The number of genes was graphed against binding intensity. Intensity of 4669 intervals ranged from 2.2-32.4. The cut-off intensity for subsequent analysis was 4. C, Histograms of the frequency of STAT4 binding across the arrayed promoter sequences relative to the transcriptional start site (TSS). The curated list has all 1540 genes with binding intensity >4. The exact match list is a subset of 660 genes that contain a consensus STAT4 binding site in the promoter. D, Comparison of the frequency of subsets of genes in the curated list (binding intensity over 4) and the frequency on the Affymetrix chip using GoSTAT to assign gene function. P-values for significant differences are indicated. E, Venn diagram comparing the overlap of IL-12-induced genes from published microarray analysis (see text) with the ChIP-on-chip dataset.
Figure 2.
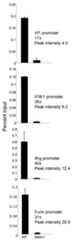
STAT4 binding to target genes. WT and Stat4-/- activated T cells were stimulated with IL-12 for 4 hours before nuclei were isolated for chromatin immunoprecipitation with anti-STAT4. Results are shown as percent input as calculated using qPCR results of amplification with primers specific for the promoter region of each of the genes indicated. The peak intensity of STAT4 binding derived from the ChIP-on-chip dataset and the fold-enrichment of STAT4 binding in WT, compared to Stat4-/- cells, are indicated. STAT4 binding in theStat4-/- cells was within 1 SD of the background (IgG control).
We then analyzed the frequency of STAT4 binding between 7.5 kb upstream to 2.5 kb downstream of the transcription start site (TSS) to define chromatin location preferences for STAT4. A preponderance of STAT4 binding is in and around the target gene TSS (Fig. 1C). There was no difference in frequency between the curated gene list and a subset of genes that had an exact STAT4 consensus motif (TTCNNNGAA in 660 out of 1111 binding sites or 59.4%)(Fig. 3A) in the association of STAT4 with specific regions in the promoter.
Figure 3.
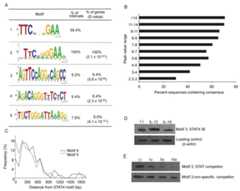
Motif analysis of STAT4 target genes. A, WebLogo representations of STAT4 consensus sequences identified by direct search for the TTCNNNGAA consensus (motif 1) or sequences identified by MEME motif search (motifs 2-5). The percentage of genes/intervals that contain sequences related to each motif is indicated with E-values for MEME motifs. B, Percentage of sequences in each range of peak values that contain a consensus STAT binding site (A, motif 1). Note that as percentages of sequences with the consensus decreases, the total number of sequences in a range increases (compare toFig. 1B). C, Histogram of the proximity of motifs 4 and 5 to the consensus STAT motif 2 graphed as the frequency of each motif occurring in 100 bp intervals from the STAT consensus. D, DNA affinity purification analysis (DAPA) of motif 3 using biotinylated oligonucleotides. Total cell extracts isolated from purified CD4 T cells activated for 3 days and left unstimulated or stimulated for 4 hours with IL-12 or IL-18 as indicated were incubated with oligonucleotides before complexes were precipitated with streptavidin agarose. Precipitated proteins were visualized using immunoblot. E, DAPA analysis as in (C) with the addition of competition (fold molar excess indicated) of binding with a STAT consensus (motif 3) or a non-specific competitor.
To determine if STAT4 target genes were enriched for any specific category, we defined the enrichment of gene ontology (GO) terms in the curated set compared to an Affymetrix mouse genome background using the GoSTAT program (21). The major statistically significant enrichments (p < 0.05) were in genes involved in cytokine binding, including factors with interleukin receptor activity and TNF receptor binding activity (Fig. 1D). There was also a significant enrichment for nucleic acid binding factors. These analyses demonstrate selectivity in STAT4 binding target genes associated with specific cellular functions.
A number of published reports have examined IL-12-induced gene expression using microarrays from human or mouse cells treated with IL-12 for various times during or after Th1 differentiation (11,12,17,18). We generated a cumulative list of IL-12-induced genes from these studies and compared them to the ChIP-on-chip dataset. The Venn diagram inFig. 1E identifies an overlap of 72 genes (Table S2A) between these two analyses.
Computational identification of the STAT4 consensus motif
To define the proportion of STAT4-bound genes that contained a STAT4 consensus motif, TTCNNNGAA (24) we analyzed the curated gene set by directly examining consensus sites using a motif search algorithm. A Perl script to identify exact matches allowing the ‘NNN’ degeneracy at positions 4 -6 identified motif 1 shown inFig. 3A at a frequency of 59.4% in the curated gene list. In the second approach, we employed the expectation-maximization motif search algorithm, MEME (19) to identify motifs. We observed a number of motifs with low E-values. Sequences containing variants of a STAT4 consensus site were found in all STAT4 bound sequences (Fig. 3A, motif 2), further validating the dataset and suggesting that the false-positive rate is low. The percentage of the genes containing the consensus (motif 1) was highest in sequences that had high peak values, and decreased as peak values decreased (Fig. 3B). While these data shows that some sequences containing the STAT consensus site were not included in the curated dataset (peak value less than 4), the problem of the exclusion of these false-negatives is offset by avoiding the inclusion of large numbers of genes (Fig. 1B) that would lack other identifiable motifs. If all bound genes in the array are considered, the percentage with the consensus falls to 43%, and the MEME algorithm identified less than 10% of the genes as having motif 2 if the cut-off was reduced to a peak value of 3. Thus, our analysis minimizes false-positives at the expense of potentially excluding a limited number of valid targets.
Three additional motifs shown inFig. 3A were obtained from the MEME analysis that were present in 5-10% of the total sequences and had low E-values. Manual and JASPAR-mediated (25) sequence analysis identified a STAT-like site in motif 3, an NF-κB site in motif 4 and a PPARγ/RXR site in motif 5. These motifs were not significantly enriched in any GO categorized gene set. We mapped the frequency of motif 4 and motif 5 occurrences within 100 bp intervals relative to the position of the consensus STAT site (motif 2). Motifs 4 and 5 were enriched in proximity to the STAT site, almost entirely within 1 kb of the consensus sequence (Fig. 3C). We functionally assessed binding to motif 3 using biotinylated oligonucleotides that spanned the motif. We detected STAT4 binding specifically to motif 3 that was competed by STAT consensus oligonucleotides to a greater extent than by non-specific sequences (Fig. 3D and E).
STAT4 binds multiple genes associated with the Th1 phenotype
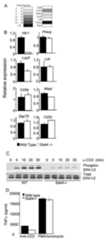
While the Th1 genetic program is known to be largely dependent on STAT4, and STAT4 binding to a subset of Th1 genes has been demonstrated, all targets of STAT4 required to establish Th1 differentiation are not clear. We examined the curated list for genes demonstrated in the literature to be functionally associated with the Th1 phenotype, or preferentially expressed in Th1 cells, and have demonstrated STAT4- or T-bet-dependence in their expression (Table S3). We identified binding to a set of genes (18/28 Th1 genes searched (Fig. 4A, Table S3); significantly enriched from the genome p < 10-8) includingFurin,Ifng andIl18r1, genes that are known to be STAT4 targets (5,6,8,26) as well as Th1 genes that are expressed independently of STAT4 includingEgr2 andMs4a4b. Using Affymetrix's Integrated Genome Browser we mapped the peak intensities of binding in a subset of these genes (Fig. 4B). While the microarray in these experiments is focused on promoter sequences, STAT4 peak binding was largely localized to the gene regions immediately upstream of transcription initiation. The exceptions to this wereGadd45g, which had peaks both 5-prime and 3-prime of the gene, andTnf that had intragenic peak binding, closely linked to STAT4 binding at theLta promoter (Fig. 4B).
Figure 4.
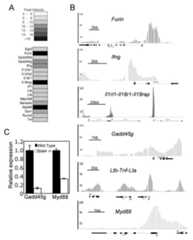
STAT4 binding in Th1 genes. A, Heatmap of Th1 associated genes based on binding intensity of STAT4 to gene promoters. B, The Integrated Genome Browser (IGB) used BAR files generated from the ChIP-on-chip data to identify binding peaks relative to annotated genes. The graphs indicate the significance (p-value probability) of enrichment at promoter-arrayed sites. C, Wild type andStat4-/- CD4+ T cells were cultured under Th1 conditions for five days before RNA was isolated for qPCR using the indicated primers. RNA levels are relative to wild type Th1 cells.
Several of these genes, while associated with Th1 function, had not been demonstrated to be STAT4-dependent. To test a requirement for STAT4 in Th1 expression of these genes, we differentiated wild type andStat4-/- CD4+ T cells under Th1 conditions and used quantitative PCR to examine relative expression.Gadd45g, which plays a role in IFN-γ production and potentially synergy between IL-12 and IL-18 (27), was decreased more than five-fold inStat4-/- Th1 cultures compared to wild type cultures (Fig. 4C).Myd88, which we have previously shown to be IL-12-inducible in a STAT4-dependent manner (28), also required STAT4 for maximal expression in Th1 cells (Fig. 4C).
STAT4 binds a subset of genes associated with TCR signaling
In a manual examination of the curated gene list we defined subsets of genes that would have specific functional consequences for T cell differentiation or function. Among these clusters we observed a set of genes that are associated with TCR signaling identified from the literature (29) (7/23 TCR signaling genes searched (Table S2B); significant enrichment from the genome p=1 × 10⁻⁴) includingCd3z,Prkcq/PKCθ andLcp2/SLP-76 (Fig. 5A) that are important for the stimulation of T cells in response to specific antigen. To test if expression of these genes was affected by STAT4-deficiency, we differentiated wild type andStat4-/- Th1 cells and used qPCR to examine relative levels of gene expression, usingHlx1 as a STAT4-dependent control. While expression ofPrkcq and a number of other TCR signaling genes was not significantly decreased inStat4-/- Th1 cells,Lcp2 expression inStat4-/- cultures was decreased to one-half the level seen in wild type cultures (Fig. 5B). To determine if there are consequences of this decrease in expression, we analyzed the TCR-induced phosphorylation of the ERK MAPKs and observed decreased ERK phosphorylation inStat4-/- Th1 cells, compared to wild type cells (Fig. 5C). These observations agree with previous data suggesting that strong stimuli minimize the defect in IFN-γ production byStat4-/- Th1 cells (30), though it is difficult to test using IFN-γ as a readout since STAT4 plays an important role in programmingIfng for Th1 expression (31). To avoid this problem, we analyzed TNFα production from wild type andStat4-/- Th1 cultures stimulated with either anti-CD3 or PMA and ionomycin. While TNFα production following anti-CD3 stimulation is decreased inStat4-/- cultures compared to wild type, stimulation with PMA and ionomycin, which bypasses the requirement for proximal signaling molecules such as SLP-76, resulted in similar levels of TNFα production (Fig. 5D). Thus, STAT4 targets genes associated with TCR signaling and contributes to the potency of antigen receptor stimulation.
Figure 5.
STAT4 regulates TCR signaling. A, Heatmap of TCR signaling associated genes based on binding intensity of STAT4 to gene promoters. B, Wild type andStat4-/- CD4+ T cells were cultured under Th1 conditions for five days before RNA was isolated for qPCR using the indicated primers. RNA levels are relative to wild type Th1 cells. C, Wild type andStat4-/- CD4+ T cells were cultured under Th1 conditions for five days before cells were stimulated with anti-CD3 for the indicated times. Total protein extracts were immunoblotted for phospho- and total ERK. D, Wild type andStat4-/- CD4+ T cells were cultured under Th1 conditions for five days before cells were stimulated with anti-CD3 or PMA + ionomycin for 24 hours. TNFα was tested in cell-free supernatants using ELISA.
Distinct patterns of STAT4-dependent gene induction among STAT4 target genes
From the dataset of genes bound by STAT4, we wanted to determine if there was a relationship between the intensity of STAT4 binding to a gene and the level of gene induction particularly since the overlap between our ChIP-on-chip targets and the public domain expressed gene lists was limited (Fig. 1E). To test this, we analyzed mRNA levels of over 30 genes, selected manually based on involvement in Th differentiation, immune responses or gene expression, in wild type andStat4-/- activated T cells stimulated for four or 18 hours with IL-12. InFigure 6A, an analysis of genes that demonstrated STAT4-dependent IL-12 induction indicated that there is no correlation between binding intensity and level of gene induction. This is exemplified byIl18rap, which was one of the highest intensity STAT4 binding genes, but was induced only 2-fold at 4 hours, whileIl18r1, which bound with less intensity, was induced 5-fold. The three genes that showed over 20-fold induction,Furin,Ifng, andIl24, had intensity ranging from 7.5 to 21. We also performed this analysis using an IL-12-induced microarray dataset (18), and observed a similar pattern when the published fold-induction was graphed against our binding intensity values (Fig. 6B).
Figure 6.
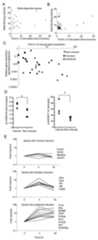
Patterns of STAT4-dependent gene induction. A, Wild type andStat4-/- CD4+ T cells were activated for three days and stimulated with IL-12 for four or 18 hours before RNA was isolated for qPCR. Graphs are plot of STAT4 binding intensity versus fold IL-12-stimulated gene induction at 4 hours for genes that showed STAT4-dependent gene induction. B, Graph of STAT4 binding intensity versus fold-IL-12 induction of the genes identified as overlap between the ChIP-on-chip data and published microarray data (18) using fold-induction values from the microarray data. C, Graph of gene expression relative to β2m versus fold induction as determined in (A). Genes that showed no induction or STAT4-dependent induction were divided into subsets based on the kinetics of expression (minimal induction, ≤ 2-fold induction at 4 or 18 hours; transient, > 2-fold induction at 4 hours, ≤ 2-fold induction at 18 hours; sustained induction, > 2-fold induction at 4 and 18 hours). D, ChIP assay for acetylated H3K9/18 or trimethylated H3K27 in purified CD4 T cells activated for three days and cultured with or without IL-12 for 4 hours. QPCR for the promoters of induced genes (Furin,Ifng,IL18r1) and non-induced genes (Foxp3,Irf1,Mbd2,Ms4a4b) is expressed as the fold-increase in acetylation or the percent decrease in H3K27 methylation from unstimulated cells. *, significantly different from induced genes (p<0.05) as determined by Student's t-test. E, Expression pattern of genes examined in (A) at 4 and 18 h after stimulation with IL-12 divided based on criteria in (C). A partial list of gene names in each subset is indicated to the right of the graph.
To further characterize this subset of genes, we divided genes into categories based on the patterns of gene induction by IL-12. “Non-induced” genes had ≤2-fold induction at four or 18 hours; “Transient” genes had >2-fold induction at 4 hours but <2-fold induction at 18 hours, and “sustained” genes had >2-fold induction at 4 and 18 hours. For each subset we graphed the fold IL-12-induced gene expression versus the basal gene expression normalized to the endogenous control β2-microglobulin. We observed a general trend that genes with lower basal expression had greater induction, and observed that those STAT4 target genes not induced by IL-12 were among the most highly expressed genes that we analyzed (Fig. 6C). This suggested that the non-induced genes did not lack induction because they were repressed in T cells, but rather that expression was high and induction by IL-12 might have a more limited effect. To determine if IL-12 was having effects on the non-induced genes we compared histone modifications at the promoters of three sustained genes and four non-induced genes. We observed that IL-12 stimulation increased H3 acetylation and decreased H3K27 methylation at both sets of genes, but had significantly greater effects at the promoters of the induced genes (Fig. 6D). These data, coupled with the demonstration that STAT4 binds to the promoter ofIrf1 (Fig. 2), one of the non-induced genes, suggests that they are bona fide STAT4 targets, but that the effects of IL-12 are limited at these promoters for reasons that may include high basal expression or lack of appropriate promoter context for induction.
Upon examining the genes that were in each group, we observed some interesting patterns (Fig. 6E). Within the non-induced set wereFoxp3 andGzmb, genes not expressed in Th1 cells, andMs4a4b, a STAT4-independent Th1 gene. The transiently induced set included receptors such asIl2ra andCd40l, and transcription factors such asIrf4,Irf8, andBcl6 where transient expression might confer temporary function to the cell. The sustained subset contained many of the genes that require STAT4 to program high expression in Th1 cells includingIfng,Furin,Il18r1 andGadd45g. We analyzed two additional genes that STAT4 is known to program but were not found on the ChIP-on-chip list,Etv5 andHlx1, and found that they also were in this category. Thus, the induction kinetics of STAT4 target genes following IL-12 stimulation of activated T cells is a strong predictor of the requirement for STAT4 in programming expression for Th1 cells.
Discussion
STAT4 is a critical regulator of adaptive inflammatory responses, yet there is still little known as to how it performs these functions. In previous work we have shown that STAT4 binds to specific target genes and mediates programming for high levels of expression in Th1 cells. It is still not well understood what genes are STAT4 targets on a genome-wide scale and how selectivity in activation is achieved. Previous microarray analyses have not provided significant insight into gene programs activated by STAT4. In this report, we have used a ChIP-on-chip approach to identify STAT4 target genes and characterized STAT4 activity at these targets.
One of the important issues in examining a large dataset such as the one in this report is the level of false positives and false negatives identified. As we demonstrated inFig. 3A, sequences from 60% of the genes in our curated list contained a consensus STAT binding site, and 100% were identified with a match to a motif similar to a STAT consensus. This suggests a low rate of false-positives in the list, which is further confirmed by showing that STAT4 binds to targets across a broad range of peak intensity values (Fig. 2). However, using the cut-off of peak value 4 for our curated list might omit some valid STAT4 targets. When divided into ranges of peak values, the percent of sequences that contain a STAT consensus decreases with decreasing peak value (Fig. 3B). In the peak value 4.0-4.9 set the percentage is 50%, but decreases further to 40% from 3.0-3.9 and 32% from 2.2-2.9, with an average of 43% for the entire list. Thus, there might be STAT4 targets below our cut-off. However, the large number of genes in the lower ranges (Fig. 1B) would greatly skew subsequent analyses. For example, while MEME identified a STAT-related site in 100% of the genes in our curated list with a cut-off above 4, the algorithm identified less than 10% of genes with a similar motif when a list with a cut-off of three was used, resulting from a large number of genes that lacked the site and decreased the enrichment potential for that motif. Regardless, this is a limitation in the interpretation of this and related datasets.
The Th1 genetic program involves many genes, which are either STAT4-dependent or STAT4-independent (9,11). The 28 genes we considered functionally linked to the Th1 phenotype are shown in Table S3 and the STAT4 target genes in this dataset include cytokines (Ifng,Tnf,Lta), receptors (Il18r1,Il18rap,Il12rb2), and signaling factors (Gadd45b,Gadd45g,Myd88) (Fig. 7). STAT4 also boundFurin, which has critical roles in maintaining tolerance, a function that suggests STAT4 might have both pro- and anti-inflammatory activities (32). It is interesting that 6 of the 20 known STAT4-dependent Th1 genes (Table S3), includingHlx1 andEtv5, were not in our dataset. This likely represents either indirect activation of genes by STAT4, or STAT4 binding to target genes outside of the promoter regions analyzed here, the latter highlighting the limitation of a promoter- versus a genome-wide ChIP-on-chip. Regardless,Etv5 andHlx1 are clearly STAT4-dependent Th1 genes with induction kinetics similar to other STAT4-dependent genes identified in the array (Fig. 6)(9). Conversely, 2 of the 18 STAT4-bound Th1 genes (Fig. 4A) are not dependent on STAT4 for expression in Th1 cells, at least under standard in vitro differentiation conditions. The Th1 lineage-promoting factor T-bet is also partially dependent upon STAT4 (9), thoughTbx21 was not identified in the STAT4 ChIP-on-chip dataset. As we recently demonstrated, many of the genes in the Th1 program are dependent on both STAT4 and T-bet, including at least 7 of the 18 STAT4-bound Th1 genes (Fig. 4A and Table S3). The T-bet-dependence of all the genes in the STAT4-bound set has not been determined but these preliminary data suggest that there is at least a 30% overlap in the target genes of these two factors.
Figure 7.
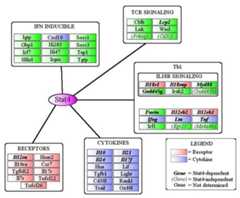
Classification of STAT4 target genes. STAT4 target genes are clustered by function (receptors, cytokines) or functional subset (Th1, TCR signaling). The Th1 cluster contains a sub-cluster of IL-18R-associated genes and includes receptors and cytokines that are color-coded with other clusters. Genes are classified as STAT4-dependent, -independent, or undetermined in relation to acute IL-12 restimulation.
While STAT4 is clearly required for the establishment of the Th1 genetic program, how it mediates programming is still unclear. STAT4 binds to target loci includingIfng,Hlx1 andIl18r1, and mediates recruitment of Brg1-containing complexes, induces histone acetylation, and decreases histone methylation and the association of repressive enzymes such as DNMT3a and EZH2 (6,8-10). All of these events contribute to increased gene transcription and programming. In this report we identified distinct sets of genes that are either transiently induced or have sustained induction. Moreover, there was a correlation between sustained gene induction and programmed expression in Th1 cells. We have previously analyzed an example of each of these gene categories;Il2ra is transiently induced, whileIl18r1 is programmed for expression in Th1 cells (8,23). At this point it is not clear if there are specific chromatin modifications that distinguish transient from sustained induction. However, having established many of the STAT4-dependent events that occur during Th1 differentiation (9), and finding a set of genes, includingIl2ra, that is only transiently induced, it will be possible to determine specific factors or histone modifications that distinguish the effects of STAT4 at various gene promoters.
One of the subsets of genes identified in this study was involved in T cell receptor signaling. Earlier reports had suggested that TCR signaling might be compromised inStat4-/- T cells, both from decreased growth in vitro, and the ability of strong stimuli, like anti-CD3 + anti-CD28 or PMA + ionomycin, to minimize the difference in IFNγ production between wild type andStat4-/- Th1 cells (30). While we observed binding to a number of STAT4-bound TCR signaling genes in our dataset, we only identified one,Lcp2 encoding SLP-76, that showed dependence on STAT4 for expression in Th1 cells. We did not observe decreased expression ofLcp2 inStat4-/- naïve T cells or Th2 cells (data not shown). As SLP-76 plays a central role in TCR signaling (29), multiple pathways could be affected. We demonstrated that anti-CD3 induced ERK activation was diminished inStat4-/- Th1 cells. However, activation of downstream signaling molecules using PMA and ionomycin bypasses proximal signaling molecules and minimized the differences in cytokine production between wild type andStat4-/- Th1 cells. Thus,Stat4-/- T cells not only have a defect in the acquisition of the Th1 phenotype, but also in T cell activation of cells differentiated in a Th1-promoting environment.
Several important features of STAT4 binding versus gene regulation were also realized in this study including the lack of correlation between the intensity of binding and the fold-induction of gene expression. While one might expect that more binding would result in greater transactivation, there are several reasons that may explain a disconnect between binding and gene induction. First, the context of the promoter may dictate activity, demonstrating that even in the context of a consensus-binding site, binding is not the sole predictor of biological function. The focused time frame of our analysis might prevent observing induction of genes that require additional co-factors that were not present in IL-12-stimulated activated T cells. There may also be tissue specific factors required for STAT4 function to regulate these genes in other cell types. While no function for STAT4 in testis has been determined, we found 113 genes enriched in a testis microarray shared with the STAT4-bound dataset (Table S2C) that are unlikely to be induced in T cells. Second, the basal transcription of the gene may determine the sensitivity of the gene to induction. We demonstrated that of the genes we tested where IL-12 had minimal induction, all had high expression, compared to the control gene (Fig. 6C). Finally, STAT4 may bind to redundant consensus sites that mediate gene activation by other STAT proteins. For example,Irf1 was bound by STAT4 but was not induced by IL-12. In contrast, IFNγ/STAT1 induceIrf1 in a number of cell types. Similar results were observed for T-bet targets, where T-bet was found to bind but not regulate gene targets (33).
The benefit of genome-scale experiments is the opportunity to identify clusters of genes involved in a biological process within the activated gene regulatory network that contribute to specific cellular functions or phenotypes. Apart from the Th1 cluster, we identified a TCR signaling gene (Lcp2) that STAT4 programs for increased antigen receptor sensitivity and an IL-18 response cluster (Il18r1,Il18rap,Gadd45b,Gadd45g,Myd88) (Fig. 7) that supports previous observations on the requirement for STAT4 in IL-18 sensitivity (28). A large number of interferon-induced genes were also identified (Fig. 7), though the genes examined were not induced to the same levels reported for IFNγ stimulation in other cell types (34). Recently two groups have analyzed high-throughput data from STAT1 ChIP (14,35). Although these experiments were done in cultured cells (HeLa S3 or NIH3T3), and STAT1 has differing spatial and temporal specificities of expression from STAT4, the proportion of chromatin immunoprecipitated STAT1 target sequences that contain a match to the consensus-binding sequences was similar to our studies.
In this report, using a combination of in silico and in vivo techniques, we have identified STAT4 target genes in primary T cells. Subsets of STAT4 targets mediate specific functions in Th1 cells. Analysis suggests that STAT4 target genes programmed for Th1 expression have distinct activation kinetics, suggesting that it may be possible, using bioinformatics analysis, to identify genes that play a role in inflammatory cell development and function.
Acknowledgments
We thank C. Short for technical assistance, H Nakshatri, CY Lin and P Labhart for review of this manuscript.
Footnotes
Supported by PHS grant AI45515 (MHK). GLS, NY and JTO were supported by T32AI060519; VTT was supported by T32HL007910.
References
- 1.Kaplan MH. STAT4: A critical regulator of inflammation in vivo. Immunologic Research. 2005;32:231–241. doi: 10.1385/IR:31:3:231. [DOI] [PubMed] [Google Scholar]
- 2.Murphy KM, Reiner SL. The lineage decisions of helper T cells. Nat Rev Immunol. 2002;2:933–944. doi: 10.1038/nri954. [DOI] [PubMed] [Google Scholar]
- 3.Robertson MJ, Chang HC, Pelloso D, Kaplan MH. Impaired interferon-gamma production as a consequence of STAT4 deficiency after autologous hematopoietic stem cell transplantation for lymphoma. Blood. 2005;106:963–970. doi: 10.1182/blood-2005-01-0201. [DOI] [PMC free article] [PubMed] [Google Scholar]
- 4.Remmers EF, Plenge RM, Lee AT, Graham RR, Hom G, Behrens TW, de Bakker PI, Le JM, Lee HS, Batliwalla F, Li W, Masters SL, Booty MG, Carulli JP, Padyukov L, Alfredsson L, Klareskog L, Chen WV, Amos CI, Criswell LA, Seldin MF, Kastner DL, Gregersen PK. STAT4 and the risk of rheumatoid arthritis and systemic lupus erythematosus. N Engl J Med. 2007;357:977–986. doi: 10.1056/NEJMoa073003. [DOI] [PMC free article] [PubMed] [Google Scholar]
- 5.Nguyen KB, Watford WT, Salomon R, Hofmann SR, Pien GC, Morinobu A, Gadina M, O'Shea JJ, Biron CA. Critical role for STAT4 activation by type 1 interferons in the interferon-gamma response to viral infection. Science. 2002;297:2063–2066. doi: 10.1126/science.1074900. [DOI] [PubMed] [Google Scholar]
- 6.Zhang F, Boothby M. T helper type 1-specific Brg1 recruitment and remodeling of nucleosomes positioned at the IFN-gamma promoter are Stat4 dependent. J Exp Med. 2006;203:1493–1505. doi: 10.1084/jem.20060066. [DOI] [PMC free article] [PubMed] [Google Scholar]
- 7.Letimier FA, Passini N, Gasparian S, Bianchi E, Rogge L. Chromatin remodeling by the SWI/SNF-like BAF complex and STAT4 activation synergistically induce IL-12Rbeta2 expression during human Th1 cell differentiation. Embo J. 2007;26:1292–1302. doi: 10.1038/sj.emboj.7601586. [DOI] [PMC free article] [PubMed] [Google Scholar]
- 8.Yu Q, Thieu VT, Kaplan MH. Stat4 limits DNA methyltransferase recruitment and DNA methylation of the IL-18Ralpha gene during Th1 differentiation. Embo J. 2007;26:2052–2060. doi: 10.1038/sj.emboj.7601653. [DOI] [PMC free article] [PubMed] [Google Scholar]
- 9.Thieu VT, Yu Q, Chang HC, Yeh N, Nguyen ET, Sehra S, Kaplan MH. Signal transducer and activator of transcription 4 is required for the transcription factor T-bet to promote T helper 1 cell-fate determination. Immunity. 2008;29:679–690. doi: 10.1016/j.immuni.2008.08.017. [DOI] [PMC free article] [PubMed] [Google Scholar]
- 10.Yu Q, Chang HC, Ahyi AN, Kaplan MH. Transcription factor-dependent chromatin remodeling of Il18r1 during Th1 and Th2 differentiation. J Immunol. 2008;181:3346–3352. doi: 10.4049/jimmunol.181.5.3346. [DOI] [PMC free article] [PubMed] [Google Scholar]
- 11.Hoey T, Zhang S, Schmidt N, Yu Q, Ramchandani S, Xu X, Naeger LK, Sun YL, Kaplan MH. Distinct requirements for the naturally occurring splice forms Stat4α and Stat4β in IL-12 responses. EMBO J. 2003;22:4237–4248. doi: 10.1093/emboj/cdg393. [DOI] [PMC free article] [PubMed] [Google Scholar]
- 12.Lund RJ, Chen Z, Scheinin J, Lahesmaa R. Early target genes of IL-12 and STAT4 signaling in th cells. J Immunol. 2004;172:6775–6782. doi: 10.4049/jimmunol.172.11.6775. [DOI] [PubMed] [Google Scholar]
- 13.Ren B, Robert F, Wyrick JJ, Aparicio O, Jennings EG, Simon I, Zeitlinger J, Schreiber J, Hannett N, Kanin E, Volkert TL, Wilson CJ, Bell SP, Young RA. Genome-wide location and function of DNA binding proteins. Science. 2000;290:2306–2309. doi: 10.1126/science.290.5500.2306. [DOI] [PubMed] [Google Scholar]
- 14.Robertson G, Hirst M, Bainbridge M, Bilenky M, Zhao Y, Zeng T, Euskirchen G, Bernier B, Varhol R, Delaney A, Thiessen N, Griffith OL, He A, Marra M, Snyder M, Jones S. Genome-wide profiles of STAT1 DNA association using chromatin immunoprecipitation and massively parallel sequencing. Nat Methods. 2007;4:651–657. doi: 10.1038/nmeth1068. [DOI] [PubMed] [Google Scholar]
- 15.Mathur AN, Chang HC, Zisoulis DG, Kapur R, Belladonna ML, Kansas GS, Kaplan MH. T-bet is a critical determinant in the instability of the IL-17-secreting T-helper phenotype. Blood. 2006;108:1595–1601. doi: 10.1182/blood-2006-04-015016. [DOI] [PMC free article] [PubMed] [Google Scholar]
- 16.Labhart P, Karmakar S, Salicru EM, Egan BS, Alexiadis V, O'Malley BW, Smith CL. Identification of target genes in breast cancer cells directly regulated by the SRC-3/AIB1 coactivator. Proc Natl Acad Sci U S A. 2005;102:1339–1344. doi: 10.1073/pnas.0409578102. [DOI] [PMC free article] [PubMed] [Google Scholar]
- 17.Rogge L, Bianchi E, Biffi M, Bono E, Chang SY, Alexander H, Santini C, Ferrari G, Sinigaglia L, Seiler M, Neeb M, Mous J, Sinigaglia F, Certa U. Transcript imaging of the development of human T helper cells using oligonucleotide arrays. Nat Genet. 2000;25:96–101. doi: 10.1038/75671. [DOI] [PubMed] [Google Scholar]
- 18.Watford WT, Hissong BD, Durant LR, Yamane H, Muul LM, Kanno Y, Tato CM, Ramos HL, Berger AE, Mielke L, Pesu M, Solomon B, Frucht DM, Paul WE, Sher A, Jankovic D, Tsichlis PN, O'Shea JJ. Tpl2 kinase regulates T cell interferon-gamma production and host resistance to Toxoplasma gondii. J Exp Med. 2008;205:2803–2812. doi: 10.1084/jem.20081461. [DOI] [PMC free article] [PubMed] [Google Scholar]
- 19.Bailey TL, Elkan C. Fitting a mixture model by expectation maximization to discover motifs in biopolymers. Proc Int Conf Intell Syst Mol Biol. 1994;2:28–36. [PubMed] [Google Scholar]
- 20.Crooks GE, Hon G, Chandonia JM, Brenner SE. WebLogo: a sequence logo generator. Genome Res. 2004;14:1188–1190. doi: 10.1101/gr.849004. [DOI] [PMC free article] [PubMed] [Google Scholar]
- 21.Beissbarth T, Speed TP. GOstat: find statistically overrepresented Gene Ontologies within a group of genes. Bioinformatics. 2004;20:1464–1465. doi: 10.1093/bioinformatics/bth088. [DOI] [PubMed] [Google Scholar]
- 22.Szabo SJ, Dighe AS, Gubler U, Murphy KM. Regulation of the Interleukin (IL)-12R β2 subunit expression in developing T helper 1 (Th1) and Th2 cells. J Exp Med. 1997;185:817–824. doi: 10.1084/jem.185.5.817. [DOI] [PMC free article] [PubMed] [Google Scholar]
- 23.O'Sullivan A, Chang HC, Yu Q, Kaplan MH. STAT4 is required for interleukin-12-induced chromatin remodeling of the CD25 locus. J Biol Chem. 2004;279:7339–7345. doi: 10.1074/jbc.M309979200. [DOI] [PubMed] [Google Scholar]
- 24.Xu X, Sun YL, Hoey T. Cooperative DNA binding and sequence-selective recognition conferred by the STAT amino-terminal domain. Science. 1996;273:794–797. doi: 10.1126/science.273.5276.794. [DOI] [PubMed] [Google Scholar]
- 25.Sandelin A, Alkema W, Engstrom P, Wasserman WW, Lenhard B. JASPAR: an open-access database for eukaryotic transcription factor binding profiles. Nucleic Acids Res. 2004;32:D91–94. doi: 10.1093/nar/gkh012. [DOI] [PMC free article] [PubMed] [Google Scholar]
- 26.Pesu M, Muul L, Kanno Y, O'Shea JJ. Proprotein convertase furin is preferentially expressed in T helper 1 cells and regulates interferon gamma. Blood. 2006;108:983–985. doi: 10.1182/blood-2005-09-3824. [DOI] [PMC free article] [PubMed] [Google Scholar]
- 27.Lu B, Yu H, Chow C, Li B, Zheng W, Davis RJ, Flavell RA. GADD45gamma mediates the activation of the p38 and JNK MAP kinase pathways and cytokine production in effector TH1 cells. Immunity. 2001;14:583–590. doi: 10.1016/s1074-7613(01)00141-8. [DOI] [PubMed] [Google Scholar]
- 28.Lawless VA, Zhang S, Ozes ON, Bruns HA, Oldham I, Hoey T, Grusby MJ, Kaplan MH. Stat4 regulates multiple components of IFN-γ-inducing signaling pathways. J Immunol. 2000;165:6803–6808. doi: 10.4049/jimmunol.165.12.6803. [DOI] [PubMed] [Google Scholar]
- 29.Smith-Garvin JE, Koretzky GA, Jordan MS. T cell activation. Annu Rev Immunol. 2009;27:591–619. doi: 10.1146/annurev.immunol.021908.132706. [DOI] [PMC free article] [PubMed] [Google Scholar]
- 30.Afkarian M, Sedy JR, Yang J, Jacobson NG, Cereb N, Yang SY, Murphy TL, Murphy KM. T-bet is a STAT1-induced regulator of IL-12R expression in naive CD4+ T cells. Nat Immunol. 2002;3:549–557. doi: 10.1038/ni794. [DOI] [PubMed] [Google Scholar]
- 31.Chang S, Aune TM. Histone hyperacetylated domains across the Ifng gene region in natural killer cells and T cells. Proc Natl Acad Sci U S A. 2005;102:17095–17100. doi: 10.1073/pnas.0502129102. [DOI] [PMC free article] [PubMed] [Google Scholar]
- 32.Pesu M, Watford WT, Wei L, Xu L, Fuss I, Strober W, Andersson J, Shevach EM, Quezado M, Bouladoux N, Roebroek A, Belkaid Y, Creemers J, O'Shea JJ. T-cell-expressed proprotein convertase furin is essential for maintenance of peripheral immune tolerance. Nature. 2008;455:246–250. doi: 10.1038/nature07210. [DOI] [PMC free article] [PubMed] [Google Scholar]
- 33.Beima KM, Miazgowicz MM, Lewis MD, Yan PS, Huang TH, Weinmann AS. T-bet binding to newly identified target gene promoters is cell type-independent but results in variable context-dependent functional effects. J Biol Chem. 2006;281:11992–12000. doi: 10.1074/jbc.M513613200. [DOI] [PubMed] [Google Scholar]
- 34.Ramana CV, Gil MP, Schreiber RD, Stark GR. Stat1-dependent and -independent pathways in IFN-gamma-dependent signaling. Trends Immunol. 2002;23:96–101. doi: 10.1016/s1471-4906(01)02118-4. [DOI] [PubMed] [Google Scholar]
- 35.Hartman SE, Bertone P, Nath AK, Royce TE, Gerstein M, Weissman S, Snyder M. Global changes in STAT target selection and transcription regulation upon interferon treatments. Genes Dev. 2005;19:2953–2968. doi: 10.1101/gad.1371305. [DOI] [PMC free article] [PubMed] [Google Scholar]