
- Research & Initiatives
- Publications
Featured Publication
 Fact SheetsOctober 2025By Julia Gelatt, Ariel G. Ruiz Soto and James D. BachmeierStay
 - Events
- About Us
- MPI Europe

You are here

Chinese Immigrants in the United States

A scientific researcher at Pacific Northwest National Laboratory. (Photo: Department of Energy)
As the third largest immigrant group in the United States after Mexicans and Indians, immigrants from China (including Hong Kong and Macau) accounted for around 5 percent of the 47.8 million foreign-born residents as of 2023. This population experienced continuous growth for decades—peaking at nearly 2.5 million in 2019—but fell by more than 100,000 at the start of the COVID-19 pandemic. Chinese immigrants in the United States numbered slightly more than 2.4 million as of 2023, representing a partial rebound to pre-pandemic levels.
The growth in unauthorized immigration from China has drawn considerable attention in the last two years. Encounters by U.S. Customs and Border Protection (CBP) of Chinese nationals arriving without authorization at the U.S.-Mexico border jumped from approximately 2,200 in fiscal year (FY) 2022 to 24,300 in FY 2023 and 38,200 in FY 2024, and at the U.S.-Canada border nearly doubled from 6,700 in FY 2022 to 12,400 two years later. This rapid increase reflected deepening social and economic challenges in China coupled with long waiting periods for green cards and additional scrutiny for work, student, and other long-term U.S. visas for Chinese citizens. Many Chinese migrants have been driven to leave by a lack of economic opportunity and financial losses related to China’s strict zero-COVID policies. Repression of free speech and free exercise of religion are also motivators of emigration. Moreover, social media has played a notable role in Chinese migrants’ decisions to come to the United States and how they travel. Tutorials on TikTok and similar platforms, for instance, explain how to get to and across the U.S.-Mexico border irregularly. Some Chinese migrants pay smugglers known as “snakeheads” to facilitate the journey.
These developments are only the most recent in a long and complex history of Chinese immigration to the United States. The first period of Chinese immigration beginning in the 1850s prompted the 1882 Chinese Exclusion Act, considered one of the country’s first major immigration restrictions, which prohibited most Chinese labor migration to the United States and barred Chinese residents from obtaining U.S. citizenship. The modern immigration period began in the 1970s, after the Immigration and Nationality Act of 1965 removed barriers for non-European immigrants and the Chinese government lifted emigration restrictions in 1978.
Unlike those arriving in the 19th century, post-1965 Chinese immigrants tend to be highly skilled and earn high incomes, with China now ranking as one of the top origin countries for international students and holders of H-1B temporary visas for highly skilled foreign workers. Chinese immigrants also tend to be slightly older than other immigrants and are slightly less likely to be in the labor force.
This Spotlight provides information on the Chinese immigrant population in the United States, focusing on its size, geographic distribution, and socioeconomic characteristics.
Definitions
The U.S. Census Bureau defines the “foreign born” as individuals without U.S. citizenship at birth. The foreign-born population includes naturalized citizens, lawful permanent residents, refugees and asylees, legal nonimmigrants (including those on student, work, or other temporary visas), and persons residing in the country without authorization.
The terms “foreign born” and “immigrant” are used interchangeably and refer to those who were born in another country and later migrated to the United States.
Unless stated otherwise, estimates in this Spotlight refer to immigrants frommainland China,Hong Kong, andMacau.
Click on the bullet points below for more information:
- Size of Immigrant Population over Time
- Distribution by State and Key Cities
- English Proficiency
- Age, Education, and Employment
- Income and Poverty
- Immigration Pathways and Naturalization
- Unauthorized Immigrant Population
- Health Coverage
- Diaspora
- Top Global Destinations
- Remittances
Size of Immigrant Population over Time
The Chinese immigrant population has grown steadily over the past four decades, although with a declining growth rate over time. The number of Chinese immigrants in the United States more than tripled from 1980 to 2000 and doubled from 2000 to 2023 (see Figure 1). This population is increasing faster than the overall U.S. foreign-born population, growing 35 percent since 2010, compared to 20 percent for all immigrants.
Figure 1. Immigrant Population from China in the United States, 1980-2023

Note: Data refer to immigrants from mainland China, Hong Kong, and Macau.
Source: Data from U.S. Census Bureau’s 2010 and 2023 American Community Surveys (ACS), and Campbell J. Gibson and Kay Jung, "Historical Census Statistics on the Foreign-Born Population of the United States: 1850-2000" (Working Paper no. 81, U.S. Census Bureau, Washington, DC, February 2006),available online.
Distribution by State and Key Cities
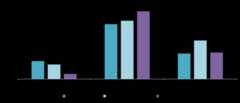
Half of Chinese immigrants lived in California (32 percent) or New York (18 percent) as of the 2019-2023 period, with Texas (5 percent), Massachusetts (5 percent), and Washington and New Jersey (4 percent apiece) home to another 18 percent. Counties with the highest concentrations of Chinese immigrants were Los Angeles County, California (9 percent); Queens County, New York (7 percent); and Kings County, New York, and Santa Clara County, California (5 percent each).
Figure 2. Top States of Residence for Chinese Immigrants in the United States, 2019-23

Notes: Pooled 2019–23 ACS data were used to get statistically valid estimates at the state level for smaller-population geographies. Not shown is the population in Alaska, which is small in size. For details, visit the Migration Policy Institute (MPI) Migration Data Hub for an interactive map showing the geographic distribution of immigrants by state and county, available online.
Source: MPI tabulation of data from the U.S. Census Bureau's pooled 2019-23 ACS.
Click here for an interactive map that highlights the states and counties with the highest concentrations of immigrants from China or another country.
Five cities were home to more than half of Chinese immigrants as of the 2019-23 period, with one-fifth of the population living in the greater New York metro area alone, followed by the Los Angeles and San Francisco (11 percent apiece), San Jose (5 percent), and Boston (4 percent) metro areas. In the greater San Francisco and San Jose areas, Chinese immigrants comprised close to 6 percent of the total population (see Table 1).
Figure 3. Top Metropolitan Destinations for Chinese Immigrants in the United States, 2019-23

Notes: Pooled 2019–23 ACS data were used to get statistically valid estimates at the metropolitan statistical-area level for smaller-population geographies. Not shown are the populations in Alaska or Hawaii. For details, visit MPI’s Migration Data Hub for an interactive map showing geographic distribution of immigrants by metro area, available online.
Source: MPI tabulation of data from U.S. Census Bureau pooled 2019–23 ACS.
Click here for an interactive map that highlights the metro areas with the most immigrants from China or another country.
Table 1. Top U.S. Metropolitan Areas of Residence for Chinese Immigrants, 2019-23

Source: MPI tabulation of data from the U.S. Census Bureau pooled 2019-23 ACS.
Chinese immigrants are less likely to be proficient in English or speak English at home than the overall U.S. foreign-born population. In 2023, 56 percent of Chinese immigrants ages 5 and over reported speaking English less than “very well,” compared to 47 percent of all immigrants. Eleven percent of Chinese immigrants spoke only English at home, compared to 17 percent of the total foreign-born population.
Age, Education, and Employment
In 2023, the age distribution of the Chinese immigrant population was similar to that of the overall foreign-born population, consisting of a smaller share of children and a larger share of working-age adults than the U.S. born. The median age for immigrants from China was 48, higher than the median age of 47 for all immigrants and 37 for the U.S. born.
Figure 4. Age Distribution of the U.S. Population, by Origin, 2023

Note: Percentages may not add up to 100 as they are rounded to the nearest whole number.
Source: MPI tabulation of data from the U.S. Census Bureau’s 2023 ACS.
Chinese immigrants tend to have more education than both the overall foreign-born and U.S-born populations. In 2023, 53 percent of Chinese immigrant adults (ages 25 and older) held at least a bachelor's degree, compared to 35 percent of all immigrants and 36 percent of the native born. Furthermore, Chinese immigrants were twice as likely to have a graduate or professional degree: 31 percent, compared to 16 percent for all immigrants and 14 percent for the U.S. born. Among Chinese who arrived between 2020 and 2023, 61 percent of adults held a college degree, a rate much higher than that of all immigrants arriving in that period (46 percent).
Figure 5. Educational Attainment of the U.S. Population (ages 25 and older), by Origin, 2023
Note: Percentages may not add up to 100 as they are rounded to the nearest whole number.
Source: MPI tabulation of data from the U.S. Census Bureau 2023 ACS.
Click here for data on immigrants’ educational attainment by country of origin and overall.
This high educational attainment reflects the prevalence of Chinese international students and high-skilled H-1B temporary workers in the United States. More than 283,400 students from mainland China, Hong Kong, and Macau were enrolled in U.S. higher education institutions during the 2023-24 school year, according to the Institute of International Education, representing 25 percent of the 1.1 million international students that year. China was surpassed in the 2023-24 school year by India (the origin of 331,600 international students), after ranking as the top sending country for 15 years. Meanwhile, China was the second largest origin country for immigrants who received H-1B temporary visas for highly skilled foreign workers in FY 2023, accounting for nearly 12 percent of the 386,300 approved beneficiaries that year (Indian nationals received 72 percent of H-1Bs in FY 2023).
Chinese immigrants participate in the labor force at a lower rate than immigrants overall but at the same rate as the U.S. born. In 2023, 63 percent of Chinese immigrants ages 16 and older were in the civilian labor force, compared to 67 percent of all immigrants and 63 percent of the native-born population. Fifty-eight percent of Chinese immigrants were employed in management, business, science, and arts occupations, a significantly higher share than for the overall foreign born (38 percent) or the native-born population (44 percent; see Figure 6).
Figure 6. Employed Workers in the Civilian Labor Force (ages 16 and older), by Occupation and Origin, 2023

Note: Percentages may not add up to 100 as they are rounded to the nearest whole number.
Source: MPI tabulation of data from the U.S. Census Bureau’s 2023 ACS.
Chinese immigrants had higher median household incomes than the foreign-born population in 2023: $92,800 compared to $78,700 for all households led by immigrants and $77,600 for native-born ones.
At the same time, Chinese immigrants were just as likely to be in poverty as immigrants overall (14 percent) and slightly more likely than the U.S. born (12 percent). (The U.S. Census Bureau defines poverty as having an income below $30,900 for a family of four in 2023.)
Immigration Pathways and Naturalization
Chinese immigrants are slightly more likely than the overall immigrant population to be naturalized U.S. citizens. Fifty-five percent of immigrants from China were U.S. citizens in 2023, compared to 52 percent of all immigrants. Chinese immigrants were the seventh largest group to naturalize in FY 2024; 24,300 Chinese immigrants became U.S. citizens, constituting 3 percent of new naturalized citizens that year.
Chinese immigrants are more likely than other immigrant groups to have arrived recently. Forty percent entered the United States in 2010 or later, compared to 35 percent of the total foreign-born population (see Figure 7).
Figure 7. Chinese and All Immigrants in the United States, by Period of Arrival, 2023

Note: Percentages may not add up to 100 as they are rounded to the nearest whole number.
Source: MPI tabulation of data from the U.S. Census Bureau’s 2023 ACS.
In FY 2023, China was the fifth largest country of origin for new lawful permanent residents (LPRs, also known as green-card holders), after Mexico, Cuba, India, and the Dominican Republic.
Approximately 61,600 (5 percent) of the nearly 1.2 million new LPRs in FY 2023 were from mainland China, Hong Kong, or Macau. Compared to all new green-card holders, Chinese immigrants were much more likely to obtain the status via employment (44 percent versus 17 percent of all LPRs; see Figure 8).
Figure 8. Immigration Pathways of Chinese and All Lawful Permanent Residents in the United States, FY 2023

Notes:Immediate Relatives of U.S. Citizens: Includes spouses, minor children, and parents of U.S. citizens. Family-Sponsored Preferences: Includes adult children and siblings of U.S. citizens as well as spouses and children of green-card holders. The Diversity Visa lottery was established by the Immigration Act of 1990 to allow entry to immigrants from countries with low rates of immigration to the United States. The law states that 55,000 diversity visas in total are made available each fiscal year. Individuals born in mainland China and Hong Kong were not eligible for the 2026 lottery, although natives of Macau were. Percentages may not add up to 100 as they are rounded to the nearest whole number.
Source: MPI tabulation of data from U.S. Department of Homeland Security (DHS), Office of Homeland Security Statistics (OHSS), “Table 10: Persons Obtaining Lawful Permanent Resident Status by Broad Class of Admission and Region and Country of Birth: Fiscal Year 2023,” updated September 16, 2024, available online.
Unauthorized Immigrant Population
Although most Chinese immigrants in the United States are legally present, approximately 239,000 were unauthorized as of mid-2022, according to Migration Policy Institute (MPI) estimates. China ranked as the eighth largest origin country for unauthorized immigrants in the United States, MPI estimates, accounting for 2 percent of the unauthorized population.
Click here for an MPI overview of the unauthorized immigrant population in the United States as of mid-2022.
As of September 2024, 530 immigrants from China, Hong Kong, and Macau participated in the Deferred Action for Childhood Arrivals (DACA) program, accounting for a tiny share of the 537,700 active DACA participants. DACA provides temporary deportation relief and work authorization to unauthorized immigrants who arrived as children and meet education and other eligibility criteria.
Click here to view the top origin countries of DACA recipients and their U.S. states of residence.
Chinese immigrants are more likely to have health insurance than the overall foreign-born population. Just 6 percent of Chinese immigrants were uninsured in 2023, the same rate as the native born but significantly less than the 18 percent of immigrants overall who lacked health insurance. Chinese immigrants were more likely to have private insurance than the total foreign-born population and less likely to have public coverage than native-born citizens.
Figure 9. Health Coverage for Chinese Immigrants, All Immigrants, and the U.S. Born, 2023

Note:The sum of shares by type of insurance is likely to be greater than 100 because people may have more than one type of insurance.
Source: MPI tabulation of data from the U.S. Census Bureau’s 2023 ACS.
The Chinese diaspora in the United States is comprised of more than 5.6 million individuals who were born in China, Hong Kong, or Macau, or reported Chinese ancestry or race, according to MPI tabulation of data from the U.S. Census Bureau’s 2023 American Community Survey. The Chinese diaspora is the ninth largest in the country.
Click here to see estimates of the largest diaspora groups in the United States in 2023.
The United States is the top destination for Chinese migrants worldwide, accounting for about 28 percent of the 8.6 million Chinese living outside China, Hong Kong, or Macau, according to mid-2020 estimates by the United Nations Population Division. Other popular destinations include Canada (930,000), South Korea (803,000), Japan (776,000), Australia (764,000), and Singapore (514,000).
Remittances sent by migrants and other individuals to China via formal channels grew rapidly from the mid-2000s up until the pandemic. Since 2020, the volume of global remittances has been on the decline. Individuals sent around $50 billion in formal remittances to China, Hong Kong, and Macau in 2023, a 27 percent decline from the 2019 high of $68.9 billion. Remittances represented 0.3 percent of mainland China’s gross domestic product (GDP) in 2023.
Figure 10. Annual Remittance Flows to China, 2000-23

Source: MPI tabulation of data from the World Bank Global Knowledge Partnership on Migration and Development (KNOMAD), “Remittance Inflows,” June 2024 update, available online.
Click hereto view an interactive chart showing annual remittances received and sent by China and other countries.
Sources
Alfonsi, Sharyn. 2024. Chinese Migrants Are the Fastest Growing Group Crossing from Mexico into U.S. at Southern Border. CBS News, February 4, 2024.Available online.
Gibson, Campbell J. and Kay Jung. 2006. Historical Census Statistics on the Foreign-Born Population of the United States: 1850-2000. Working Paper no. 81, U.S. Census Bureau, Washington, DC, February 2006.Available online.
Institute of International Education (IIE). 2024. International Students: All Places of Origin. Available online.
Knowledge Partnership on Migration and Development (KNOMAD)/World Bank Group. 2024. Annual Remittances Data. June 2024 update. Available online.
Marrow, Brandon and Jeanne Batalova. 2024. Naturalized Citizens in the United States. Migration Information Source, July 10, 2024. Available online.
Migration Policy Institute (MPI), Migration Data Hub. N.d. U.S. Immigrant Population by State and County. Accessed January 8, 2025. Available online.
Oyen, Meredith. 2024. The Perils of Vilifying Chinese Migrants.Time, August 13, 2024.Available online.
Ruiz Soto, Ariel G., Julia Gelatt, and Jennifer Van Hook. 2024.Diverse Flows Drive Increase in U.S. Unauthorized Immigrant Population. MPI short read, July 2024.Available online.
Sharma, Sanjay. 2024. US Open Doors 2024 Report: India Overtakes China as Top-Sending Country for International Students for the First Time Since 2009.The Times of India,November 21, 2024.Available online.
Ting, Fu, Ali Swenson, and Didi Tang. 2024. Trump Suggests Chinese Migrants Are in the US to Build an ‘Army.’ The Migrants Tell Another Story. Associated Press, May 14, 2024.Available online.
United Nations Population Division. 2020. International Migrant Stock 2020: Destination and Origin. Available online.
U.S. Census Bureau. 2024. 2023 American Community Survey. Access from Steven Ruggles, Sarah Flood, Matthew Sobek, Daniel Backman, Annie Chen, Grace Cooper, Stephanie Richards, Renae Rodgers, and Megan Schouweiler. IPUMS USA: Version 15.0 [dataset]. Minneapolis, MN: IPUMS, 2024. Available online.
---. N.d. 2023 American Community Survey—Advanced Search: S0201 Selected Population Profile in the United States. Accessed September 30, 2024. Available online.
U.S. Citizenship and Immigration Services (USCIS). 2024. Characteristics of H-1B Specialty Occupation Workers: Fiscal Year 2023 Annual Report to Congress. Washington, DC: DHS. Available online.
---. 2024. Count of Active DACA Recipients by Month of Current DACA Expiration as of September 30, 2024. Available online.
---. 2024. Naturalization Statistics. Updated December 16, 2024. Available online.
U.S. Customs and Border Protection (CBP). N.d. Nationwide Encounters. Accessed October 30, 2024.Available online.
U.S. Department of Homeland Security (DHS), Office of Homeland Security Statistics (OHSS). 2024. 2023 Yearbook of Immigration Statistics. Washington, DC: DHS OHSS. Available online.
Authors
Jeanne Batalova is a Senior Policy Analyst and Manager of the Migration Data Hub.
Madeleine Greene was a Research Intern with MPI's U.S. Immigration Policy Program. She holds a bachelor’s degree in political science from Boston College.
In the Spotlight

Want to learn more about immigrants to the United States from Mexico, India, Canada, or many other countries? Spotlights from MPI's online journal, theMigration Information Source,use the latest data to provide information on size, geographic distribution, and socioeconomic characteristics of particular immigrant groups, including English proficiency, educational and professional attainment, income and poverty, health coverage, and remittances.

Find reports, articles, and other MPI resources on migration to and from China, all in one place.
Frequently Requested Statistics on Immigrants and Immigration in the United States

Immigration to the United States is the subject of significant debate, with questions ranging from the size of inflows, the role of immigrants in the labor market, and the nature of enforcement, to humanitarian admission policies and the sociodemographic characteristics of new arrivals. As such, it is important for the public to have access to accurate current and historical information. This article offers the top statistics on immigrants and immigration to the United States.