Local Election Results 2019
Stevenage
One-third of council up for election.
Other results for Stevenage:20022003200420062007200820102011201220142015201620182021202220232024
By-elections for Stevenage (may be incomplete): 9th December 2004 (Roebuck) — 27th March 2008 (Pin Green) — 25th September 2008 (Pin Green) — 4th May 2017 (Roebuck) — 19th January 2023 (Bedwell) — 13th February 2025 (Manor) — 26th June 2025 (Bedwell) — 30th October 2025 (Roebuck)
Results for Hertfordshire county council:200520092013201720212025
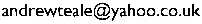
Map of the results —Export spreadsheet
| Party | Votes | Percent | Seats |
|---|
| Labour | 7860 | 38.4% | 9 |
| Conservative | 6538 | 31.9% | 2 |
| Liberal Democrat | 4634 | 22.6% | 2 |
| Green Party | 1461 | 7.1% | 0 |
| Adrian Brown | Lab | 674 | 45.7% |
|---|
| Nicholas Foster | C | 574 | 38.9% |
|---|
| Andrew Anderson | LD | 227 | 15.4% |
|---|
| Liz Harrington | Lab | 813 | 54.2% |
|---|
| Nicholas Leech | C | 356 | 23.7% |
|---|
| Victoria Snelling | Grn | 213 | 14.2% |
|---|
| Nick Macmillan | LD | 119 | 7.9% |
|---|
| Stephen Booth | LD | 766 | 46.6% |
|---|
| Pam Stuart | Lab | 446 | 27.1% |
|---|
| Matthew Wyatt | C | 282 | 17.2% |
|---|
| David Ingarfill | Grn | 149 | 9.1% |
|---|
| Alexander Farquharson | C | 682 | 45.3% |
|---|
| Chris Webb | Lab | 608 | 40.3% |
|---|
| Nigel Bye | LD | 217 | 14.4% |
|---|
| Robin Parker | LD | 1484 | 75.6% |
|---|
| James Corrigan | C | 264 | 13.5% |
|---|
| David Wood | Lab | 214 | 10.9% |
|---|
| Teresa Callaghan | Lab | 526 | 36.3% |
|---|
| Jill Brinkworth | LD | 524 | 36.1% |
|---|
| Bret Facey | C | 401 | 27.6% |
|---|
| Loraine Rossati | Lab | 881 | 39.6% |
|---|
| James Fraser | C | 845 | 38.0% |
|---|
| Elizabeth Sturges | Grn | 312 | 14.0% |
|---|
| George Pinder | LD | 187 | 8.4% |
|---|
| Jeanette Thomas | Lab | 606 | 43.0% |
|---|
| Andy Facey | C | 454 | 32.2% |
|---|
| Naomi Collins | Grn | 228 | 16.2% |
|---|
| Ross London | LD | 122 | 8.7% |
|---|
| John Gardner | Lab | 698 | 43.8% |
|---|
| Janet Munro | C | 537 | 33.7% |
|---|
| Martin Malocco | Grn | 185 | 11.6% |
|---|
| Paul Barber | LD | 174 | 10.9% |
|---|
| Claire Parris | Lab | 787 | 46.9% |
|---|
| Mandi Tandi | C | 642 | 38.2% |
|---|
| Daniel Snell | LD | 250 | 14.9% |
|---|
| Sarah Mead | Lab | 580 | 46.5% |
|---|
| Celia Lawrence | C | 368 | 29.5% |
|---|
| Michael Malocco | Grn | 201 | 16.1% |
|---|
| Charles Littleton | LD | 99 | 7.9% |
|---|
| Michael Downing | Lab | 639 | 43.6% |
|---|
| Alex Young | C | 509 | 34.7% |
|---|
| Richard Warr | Grn | 173 | 11.8% |
|---|
| Clive Hearmon | LD | 145 | 9.9% |
|---|
| Graham Lawrence | C | 624 | 46.8% |
|---|
| Jim Callaghan | Lab | 388 | 29.1% |
|---|
| Neil Brinkworth | LD | 320 | 24.0% |
|---|
Back to the 2019 list of councils.
Copyright © Andrew Teale, 2002–2026.
All text and images in this website are available for reuse and modification under the terms of theCreative Commons Attribution-Sharealike 3.0 Unported Licence and theGNU Free Documentation Licence (unversioned, with no invariant sections, front-cover texts, or back-cover texts).
All electoral data on this website are based on information kindly supplied by the relevant Returning Officer and are held for archiving, historical and research purposes in the public interest as provided for by the Data Protection Act 2018.
This website does not use cookies or collect any data on users.
This website can be accessed anonymously at:
ya63kyvm3fstfre3tpgjckcv7tzpbu5
wfx64ggqztks4e2sruav5wjad.onion
If this website has been helpful to you,please consider making a donation to support the work required to keep the Local Elections Archive Project going.
Comments? Corrections? Constructive abuse? Commissions? Cash donations? Email me: