Local Election Results 2018
Brentwood
One-third of council up for election. No elections this year in Hutton North or Tipps Cross.
Other results for Brentwood:20022003200420062007200820102011201220142015201620192021202220232024
By-elections for Brentwood (may be incomplete): 10th February 2005 (Pilgrims Hatch) — 1st March 2007 (Pilgrims Hatch) — 30th October 2008 (Hutton S.) — 4th June 2009 (Hutton S.) — 6th December 2012 (Shenfield) — 29th October 2015 (Shenfield) — 2nd October 2025 (Hutton S.)
Results for Essex county council:20052009201320172021
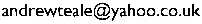
Map of the results —Export spreadsheet
| Party | Votes | Percent | Seats |
|---|
| Conservative | 8111 | 45.6% | 8 |
| Liberal Democrat | 6149 | 34.5% | 4 |
| Labour | 2491 | 14.0% | 1 |
| Independent | 864 | 4.9% | 0 |
| Green Party | 190 | 1.1% | 0 |
| Philip Mynott | LD | 849 | 51.9% |
|---|
| John Everett | C | 463 | 28.3% |
|---|
| Toby Blunsten | Lab | 233 | 14.2% |
|---|
| John Hamilton | Grn | 92 | 5.6% |
|---|
| Gareth Barrett | Lab | 624 | 42.2% |
|---|
| Garry White | C | 600 | 40.6% |
|---|
| Brenner Munden | LD | 254 | 17.2% |
|---|
| Dominic Naylor | LD | 863 | 51.5% |
|---|
| Sandy Tanner | C | 570 | 34.0% |
|---|
| Deborah Foster | Lab | 244 | 14.5% |
|---|
| Keith Parker | C | 957 | 62.6% |
|---|
| Hugh Gorton | LD | 417 | 27.3% |
|---|
| David Jobbins | Lab | 154 | 10.1% |
|---|
| Catherine Tierney | C | 643 | 56.5% |
|---|
| Amanda Burton | Ind | 387 | 34.0% |
|---|
| Pauline Watts | Lab | 74 | 6.5% |
|---|
| David Green | LD | 34 | 3.0% |
|---|
| Charles Nolan | C | 695 | 71.0% |
|---|
| Marian Jenkins | Lab | 150 | 15.3% |
|---|
| Anne Long | LD | 134 | 13.7% |
|---|
| Olivia Sanders | C | 447 | 57.2% |
|---|
| Jane Winter | Lab | 144 | 18.4% |
|---|
| Gary Macdonnell | LD | 115 | 14.7% |
|---|
| Jan Gearon-Simm | Ind | 75 | 9.6% |
|---|
| Roger Hirst | C | 772 | 76.0% |
|---|
| Francisca Dapp | Lab | 141 | 13.9% |
|---|
| Matthew Emerson | LD | 103 | 10.1% |
|---|
| Jon Cloke | C | 832 | 47.8% |
|---|
| Darryl Sankey | LD | 630 | 36.2% |
|---|
| Emma Benson | Lab | 182 | 10.4% |
|---|
| Paul Jeater | Grn | 98 | 5.6% |
|---|
| Barry Aspinell | LD | 1157 | 73.2% |
|---|
| Tom Heard | C | 289 | 18.3% |
|---|
| Liam Preston | Lab | 134 | 8.5% |
|---|
| Jan Pound | C | 1007 | 55.1% |
|---|
| John Newberry | LD | 703 | 38.4% |
|---|
| Richard Millwood | Lab | 119 | 6.5% |
|---|
| Tom McLaren | C | 341 | 50.3% |
|---|
| Mark Lewis | LD | 274 | 40.4% |
|---|
| Tim Barrett | Lab | 63 | 9.3% |
|---|
| Mark Haigh | LD | 616 | 35.4% |
|---|
| Richard Broomfield | C | 495 | 28.4% |
|---|
| Jill Hubbard | Ind | 402 | 23.1% |
|---|
| Susan Kortlandt | Lab | 229 | 13.1% |
|---|
Back to the 2018 list of councils.
Copyright © Andrew Teale, 2002–2026.
All text and images in this website are available for reuse and modification under the terms of theCreative Commons Attribution-Sharealike 3.0 Unported Licence and theGNU Free Documentation Licence (unversioned, with no invariant sections, front-cover texts, or back-cover texts).
All electoral data on this website are based on information kindly supplied by the relevant Returning Officer and are held for archiving, historical and research purposes in the public interest as provided for by the Data Protection Act 2018.
This website does not use cookies or collect any data on users.
This website can be accessed anonymously at:
ya63kyvm3fstfre3tpgjckcv7tzpbu5
wfx64ggqztks4e2sruav5wjad.onion
If this website has been helpful to you,please consider making a donation to support the work required to keep the Local Elections Archive Project going.
Comments? Corrections? Constructive abuse? Commissions? Cash donations? Email me: