Local Election Results 2013
Bristol
One-third of council up for election. No elections this year in Bedminster, Bishopsworth, Brislington East, Brislington West, Filwood, Hartcliffe, Hengrove, Knowle, Southville, Stockwood, Whitchurch Park or Windmill Hill.
Birthday = Birthday Party
IfB = Independents for Bristol
Other results for Bristol:2002200320052006200720092010201120142015201620212024
By-elections for Bristol (may be incomplete): 20th May 2004 (Lawrence Hill) — 9th October 2008 (St George W.) — 8th September 2011 (Southmead) — 15th November 2012 (Elected Mayor) — 24th May 2018 (Westbury-on-Trym & Henleaze) — 16th January 2020 (Brislington E.) — 17th February 2022 (Southmead) — 2nd February 2023 (Hotwells & Harbourside) — 24th August 2023 (Bishopston & Ashley Down) — 4th July 2024 (Horfield)
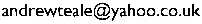
Map of the results —Export spreadsheet
| Party | Votes | Percent | Seats |
|---|
| Labour | 17755 | 30.3% | 9 |
| Conservative | 13712 | 23.4% | 6 |
| Liberal Democrat | 12203 | 20.8% | 5 |
| Green Party | 8055 | 13.8% | 2 |
| Independents for Bristol | 3443 | 5.9% | 1 |
| UK Independence Party | 2436 | 4.2% | 0 |
| Trade Unionist and Socialist Coalition | 867 | 1.5% | 0 |
| Birthday Party | 58 | 0.1% | 0 |
| Rob Telford | Grn | 1223 | 34.5% |
|---|
| Mary Southcott | Lab | 1056 | 29.8% |
|---|
| Jon Rogers | LD | 1008 | 28.5% |
|---|
| Iain Dennis | C | 101 | 2.9% |
|---|
| Karl Belizaire | IfB | 76 | 2.1% |
|---|
| Tom Baldwin | TUSC | 49 | 1.4% |
|---|
| Dave Dobbs | Birthday | 28 | 0.8% |
|---|
| Wayne Harvey | C | 1068 | 39.4% |
|---|
| Nicola Bowden-Jones | Lab | 824 | 30.4% |
|---|
| Spud Murphy | UKIP | 648 | 23.9% |
|---|
| Justin Quinnell | Grn | 80 | 2.9% |
|---|
| Ian Campion-Smith | LD | 64 | 2.4% |
|---|
| Patrick Hulme | TUSC | 28 | 1.0% |
|---|
| Daniella Radice | Grn | 1256 | 36.1% |
|---|
| Kye Dudd | Lab | 675 | 19.4% |
|---|
| John Hickey | IfB | 665 | 19.1% |
|---|
| Chris Harris | LD | 626 | 18.0% |
|---|
| Richard Manns | C | 225 | 6.5% |
|---|
| Chris Farrell | TUSC | 32 | 0.9% |
|---|
| Mark Wright | LD | 852 | 40.6% |
|---|
| Simon Firth | Lab | 541 | 25.8% |
|---|
| Charlie Bolton | Grn | 425 | 20.3% |
|---|
| Chris Didcote | C | 280 | 13.3% |
|---|
| Charles Lucas | C | 638 | 26.8% |
|---|
| Brenda McLennan | IfB | 547 | 22.9% |
|---|
| Andy Morgan | LD | 459 | 19.3% |
|---|
| Rosemary Chamberlin | Lab | 320 | 13.4% |
|---|
| Simon Stafford-Townsend | Grn | 249 | 10.4% |
|---|
| Alex Zychowski | UKIP | 171 | 7.2% |
|---|
| Simon Cook | LD | 576 | 34.7% |
|---|
| Gareth Alan-Williams | C | 559 | 33.7% |
|---|
| Peter Kennedy-Chapman | Lab | 268 | 16.1% |
|---|
| Simon Bennett | Grn | 258 | 15.5% |
|---|
| Anthony Negus | LD | 942 | 41.4% |
|---|
| Eileen Lepine | Lab | 563 | 24.7% |
|---|
| Ani Stafford-Townsend | Grn | 418 | 18.4% |
|---|
| Christopher Morton | C | 320 | 14.1% |
|---|
| Caroline Vincent | TUSC | 34 | 1.5% |
|---|
| Afzal Shah | Lab | 974 | 33.9% |
|---|
| Anna McMullen | Grn | 840 | 29.3% |
|---|
| John Kiely | LD | 698 | 24.3% |
|---|
| Jane Westhead | IfB | 267 | 9.3% |
|---|
| Tony Lee | C | 90 | 3.1% |
|---|
| Mhairi Threlfall | Lab | 1021 | 39.5% |
|---|
| Steven Comer | LD | 1020 | 39.5% |
|---|
| Mike Williams | C | 237 | 9.2% |
|---|
| Josie McLellan | Grn | 223 | 8.6% |
|---|
| Mark Baker | TUSC | 84 | 3.2% |
|---|
| Bill Payne | Lab | 907 | 34.4% |
|---|
| Nigel Currie | C | 872 | 33.0% |
|---|
| Steve Wood | UKIP | 573 | 21.7% |
|---|
| John Hills | Grn | 144 | 5.5% |
|---|
| Daniel Kelly | LD | 108 | 4.1% |
|---|
| Philip Bishop | TUSC | 36 | 1.4% |
|---|
| Chris Windows | C | 1157 | 47.7% |
|---|
| Eileen Means | Lab | 950 | 39.2% |
|---|
| Mike Popham | LD | 153 | 6.3% |
|---|
| Tim Malnick | Grn | 134 | 5.5% |
|---|
| Simon Lewis | Birthday | 30 | 1.2% |
|---|
| Glenise Morgan | LD | 1559 | 44.5% |
|---|
| Kevin Staples | C | 1245 | 35.5% |
|---|
| Barry Trahar | Lab | 439 | 12.5% |
|---|
| Jane Devlin | Grn | 261 | 7.4% |
|---|
| Noreen Daniels | Lab | 1089 | 53.0% |
|---|
| Roy Towler | C | 379 | 18.4% |
|---|
| Rick Lovering | Grn | 246 | 12.0% |
|---|
| Matthew Gordon | TUSC | 188 | 9.1% |
|---|
| Andrew Brown | LD | 154 | 7.5% |
|---|
| Claire Hiscott | C | 721 | 28.6% |
|---|
| Oliver Mead | Lab | 711 | 28.2% |
|---|
| Cheryl Ann | LD | 579 | 22.9% |
|---|
| Oliver Mochizuki | IfB | 241 | 9.5% |
|---|
| Jude English | Grn | 237 | 9.4% |
|---|
| John Yeandle | TUSC | 35 | 1.4% |
|---|
| Jason Budd | IfB | 620 | 27.6% |
|---|
| Mike Thorne | Lab | 584 | 26.0% |
|---|
| Alex Smethurst | LD | 521 | 23.2% |
|---|
| Barbara Lewis | C | 404 | 18.0% |
|---|
| Lela McTernan | Grn | 77 | 3.4% |
|---|
| Roger Thomas | TUSC | 40 | 1.8% |
|---|
| Hibaq Jama | Lab | 1300 | 51.6% |
|---|
| Pete Brown | UKIP | 324 | 12.9% |
|---|
| Abdul Malik | LD | 274 | 10.9% |
|---|
| Christine Townsend | IfB | 227 | 9.0% |
|---|
| Chloe Somers | Grn | 207 | 8.2% |
|---|
| David Lewis | C | 121 | 4.8% |
|---|
| Fiona Joyce | TUSC | 66 | 2.6% |
|---|
| Estella Tincknell | Lab | 960 | 46.4% |
|---|
| Guy Poultney | LD | 624 | 30.2% |
|---|
| Stephanie North | C | 257 | 12.4% |
|---|
| Chrissy Quinnell | Grn | 228 | 11.0% |
|---|
| Fi Hance | LD | 881 | 32.8% |
|---|
| Martin Fodor | Grn | 590 | 22.0% |
|---|
| Philip Jardine | Lab | 535 | 19.9% |
|---|
| Graham Godwin-Pearson | C | 448 | 16.7% |
|---|
| Christine Thomas | UKIP | 200 | 7.5% |
|---|
| Martyn Ahmet | TUSC | 30 | 1.1% |
|---|
| Steve Pearce | Lab | 1056 | 50.0% |
|---|
| Edward Cullen | C | 580 | 27.5% |
|---|
| Don Brown | Grn | 233 | 11.0% |
|---|
| Paul Elvin | LD | 132 | 6.3% |
|---|
| Mike Luff | TUSC | 110 | 5.2% |
|---|
| Ron Stone | Lab | 1052 | 46.7% |
|---|
| Philip Collins | UKIP | 520 | 23.1% |
|---|
| Tony Potter | LD | 284 | 12.6% |
|---|
| Ben Appleby | Grn | 174 | 7.7% |
|---|
| Sarah Cleave | C | 168 | 7.5% |
|---|
| Bernie Lyons | TUSC | 54 | 2.4% |
|---|
| Brenda Massey | Lab | 1199 | 61.3% |
|---|
| Rob Edwards | C | 376 | 19.2% |
|---|
| Chris Millman | Grn | 178 | 9.1% |
|---|
| Tom Stubbs | LD | 123 | 6.3% |
|---|
| Domenico Hill | TUSC | 81 | 4.1% |
|---|
| Peter Abraham | C | 1724 | 68.4% |
|---|
| Jasvant Singh Badesha | Lab | 307 | 12.2% |
|---|
| Mary Page | LD | 276 | 10.9% |
|---|
| Geoff Collard | Grn | 214 | 8.5% |
|---|
| Geoffrey Gollop | C | 1742 | 51.0% |
|---|
| Helen Mott | IfB | 800 | 23.4% |
|---|
| Gillian Kirk | Lab | 424 | 12.4% |
|---|
| Graham Donald | LD | 290 | 8.5% |
|---|
| Alex Dunn | Grn | 160 | 4.7% |
|---|
Back to the 2013 list of councils.
Copyright © Andrew Teale, 2002–2026.
All text and images in this website are available for reuse and modification under the terms of theCreative Commons Attribution-Sharealike 3.0 Unported Licence and theGNU Free Documentation Licence (unversioned, with no invariant sections, front-cover texts, or back-cover texts).
All electoral data on this website are based on information kindly supplied by the relevant Returning Officer and are held for archiving, historical and research purposes in the public interest as provided for by the Data Protection Act 2018.
This website does not use cookies or collect any data on users.
This website can be accessed anonymously at:
ya63kyvm3fstfre3tpgjckcv7tzpbu5
wfx64ggqztks4e2sruav5wjad.onion
If this website has been helpful to you,please consider making a donation to support the work required to keep the Local Elections Archive Project going.
Comments? Corrections? Constructive abuse? Commissions? Cash donations? Email me: