Local Election Results 2012
Lincoln
One-third of council up for election.
Other results for Lincoln:20022003200420062007200820102011201420152016201820192021202220232024
By-elections for Lincoln (may be incomplete): 11th July 2002 (Boultham) — 29th June 2006 (Moorland) — 22nd August 2013 (Bracebridge) — 19th October 2017 (Carholme) — 12th December 2019 (Witham) — 3rd April 2025 (Park)
Results for Lincolnshire county council:200520092013201720212025
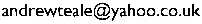
Map of the results —Export spreadsheet
| Party | Votes | Percent | Seats |
|---|
| Labour | 8823 | 50.5% | 10 |
| Conservative | 5618 | 32.2% | 1 |
| UK Independence Party | 1347 | 7.7% | 0 |
| Liberal Democrat | 1197 | 6.9% | 0 |
| Trade Unionist and Socialist Coalition | 423 | 2.4% | 0 |
| British National Party | 49 | 0.3% | 0 |
| Kath Brothwell | Lab | 892 | 57.3% |
|---|
| Laura Goodliffe | C | 386 | 24.8% |
|---|
| Natasha Chapman | LD | 141 | 9.1% |
|---|
| Gavyn Graham | TUSC | 139 | 8.9% |
|---|
| Rosanne Kirk | Lab | 686 | 45.0% |
|---|
| John Metcalfe | C | 467 | 30.6% |
|---|
| Tony Wells | UKIP | 287 | 18.8% |
|---|
| Janice Charters | LD | 85 | 5.6% |
|---|
| Gill Clayton-Hewson | Lab | 885 | 52.9% |
|---|
| Carly Sharples | C | 530 | 31.7% |
|---|
| Nick Smith | UKIP | 183 | 10.9% |
|---|
| Ross Pepper | LD | 74 | 4.4% |
|---|
| Bill Bilton | Lab | 719 | 41.2% |
|---|
| Marc Jones | C | 712 | 40.8% |
|---|
| Callum Newton | UKIP | 183 | 10.5% |
|---|
| Lynn Pepper | LD | 82 | 4.7% |
|---|
| Dean Lowther | BNP | 49 | 2.8% |
|---|
| Tony Speakman | Lab | 1042 | 55.7% |
|---|
| Vasos Melides | C | 413 | 22.1% |
|---|
| David Harding-Price | LD | 173 | 9.2% |
|---|
| Ollie Foster | UKIP | 138 | 7.4% |
|---|
| Nick Parker | TUSC | 106 | 5.7% |
|---|
| Jim Hanrahan | Lab | 1007 | 64.1% |
|---|
| Malcolm Barham | C | 423 | 26.9% |
|---|
| Charles Shaw | LD | 142 | 9.0% |
|---|
| Jackie Kirk | Lab | 731 | 52.3% |
|---|
| David Denman | C | 500 | 35.7% |
|---|
| Charlotte Harding-Price | LD | 168 | 12.0% |
|---|
| Andrew Kerry | C | 672 | 45.6% |
|---|
| Sean Burke | Lab | 442 | 30.0% |
|---|
| Jane Smith | UKIP | 259 | 17.6% |
|---|
| Jim Charters | LD | 102 | 6.9% |
|---|
| Sue Burke | Lab | 909 | 48.4% |
|---|
| Sandra Gratrick | C | 684 | 36.4% |
|---|
| Ken Pratt | UKIP | 173 | 9.2% |
|---|
| Aidan Turner | LD | 72 | 3.8% |
|---|
| Emma-Jayne Woodhall | TUSC | 41 | 2.2% |
|---|
| Adrianna Ellis | Lab | 836 | 51.9% |
|---|
| Keith Weaver | C | 634 | 39.3% |
|---|
| Karen Williams | TUSC | 78 | 4.8% |
|---|
| Robert Heathorn | LD | 64 | 4.0% |
|---|
| Brent Charlesworth | Lab | 674 | 58.7% |
|---|
| Graham Kent | C | 197 | 17.2% |
|---|
| Joe Harrison | UKIP | 124 | 10.8% |
|---|
| Heather Cullen | LD | 94 | 8.2% |
|---|
| Lucy Bland | TUSC | 59 | 5.1% |
|---|
Back to the 2012 list of councils.
Copyright © Andrew Teale, 2002–2026.
All text and images in this website are available for reuse and modification under the terms of theCreative Commons Attribution-Sharealike 3.0 Unported Licence and theGNU Free Documentation Licence (unversioned, with no invariant sections, front-cover texts, or back-cover texts).
All electoral data on this website are based on information kindly supplied by the relevant Returning Officer and are held for archiving, historical and research purposes in the public interest as provided for by the Data Protection Act 2018.
This website does not use cookies or collect any data on users.
This website can be accessed anonymously at:
ya63kyvm3fstfre3tpgjckcv7tzpbu5
wfx64ggqztks4e2sruav5wjad.onion
If this website has been helpful to you,please consider making a donation to support the work required to keep the Local Elections Archive Project going.
Comments? Corrections? Constructive abuse? Commissions? Cash donations? Email me: