Local Election Results 2011
Maidstone
One-third of council up for election. No elections this year in Barming, Boughton Monchelsea and Chart Sutton, Bridge, Headcorn, Heath, North Downs, Park Wood or Shepway South.
Other results for Maidstone:20022003200420062007200820102012201420152016201820192021202220232024
By-elections for Maidstone (may be incomplete): 27th November 2003 (Marden & Yalding) — 13th October 2005 (Downswood & Otham) — 30th November 2006 (Park Wood) — 6th December 2007 (Shepway S.) — 1st October 2009 (Fant) — 18th October 2012 (Allington) — 27th July 2014 (Staplehurst) — 10th September 2015 (Fant) — 8th September 2016 (Shepway S.) — 4th May 2017 (Bearsted) — 30th November 2017 (North) — 13th September 2018 (Headcorn) — 2nd October 2025 (Harrietsham, Lenham & North Downs)
Results for Kent county council:200520092013201720212025
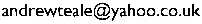
Map of the results —Export spreadsheet
| Party | Votes | Percent | Seats |
|---|
| Conservative | 17191 | 45.3% | 12 |
| Liberal Democrat | 8843 | 23.3% | 6 |
| Labour | 5678 | 15.0% | 0 |
| Independent | 3499 | 9.2% | 2 |
| Green Party | 2185 | 5.8% | 0 |
| UK Independence Party | 455 | 1.2% | 0 |
| British National Party | 102 | 0.3% | 0 |
| Cynthia Robertson | LD | 1345 | 48.5% |
|---|
| Barry Ginley | C | 1048 | 37.8% |
|---|
| Wendy Hollands | Lab | 383 | 13.8% |
|---|
| Val Springett | C | 1754 | 46.2% |
|---|
| Mike Cuming | C | 1555 | |
|---|
| Pat Marshall | Ind | 1395 | 36.7% |
|---|
| Jim Grogan | Lab | 432 | 11.4% |
|---|
| Gill Annan | Lab | 281 | |
|---|
| Ciaran Oliver | Grn | 215 | 5.7% |
|---|
| Sarah Goodwin | Grn | 182 | |
|---|
| Malcolm Greer | C | 1350 | 50.9% |
|---|
| Michael Beckwith | Lab | 862 | 32.5% |
|---|
| John Watson | LD | 264 | 10.0% |
|---|
| Penny Kemp | Grn | 177 | 6.7% |
|---|
| Dennis Collins | C | 1247 | 46.5% |
|---|
| David Stamp | LD | 915 | 34.1% |
|---|
| Stella Randall | Lab | 265 | 9.9% |
|---|
| Keith Woollven | UKIP | 140 | 5.2% |
|---|
| Robin Kinrade | Grn | 114 | 4.3% |
|---|
| Nick de Wiggondene | C | 628 | 59.1% |
|---|
| Geoffrey Licence | Ind | 291 | 27.4% |
|---|
| Paul Blackmore | Lab | 143 | 13.5% |
|---|
| Gordon Newton | Ind | 451 | 51.7% |
|---|
| Gary Cooke | C | 310 | 35.6% |
|---|
| Steve Gibson | Lab | 84 | 9.6% |
|---|
| Andrew Waldie | Grn | 27 | 3.1% |
|---|
| David Naghi | LD | 1286 | 44.6% |
|---|
| Martin Cox | LD | 1281 | |
|---|
| Tony Dennison | C | 1010 | 35.0% |
|---|
| Scott Hahnefeld | C | 858 | |
|---|
| Bruce Heald | Lab | 316 | 11.0% |
|---|
| Caroline Burns | Grn | 270 | 9.4% |
|---|
| Hannah Patton | Grn | 242 | |
|---|
| Alistair Black | C | 727 | 29.6% |
|---|
| Fran Smith | LD | 661 | 26.9% |
|---|
| Paul Harper | Lab | 542 | 22.1% |
|---|
| Stuart Jeffery | Grn | 526 | 21.4% |
|---|
| Tom Sams | Ind | 1175 | 55.3% |
|---|
| Maz Michaelas | C | 827 | 38.9% |
|---|
| Jeanne Gibson | Lab | 122 | 5.7% |
|---|
| Fran Wilson | LD | 853 | 41.4% |
|---|
| Valerie Parker | C | 533 | 25.9% |
|---|
| Marianna Poliszczuk | Lab | 333 | 16.2% |
|---|
| Wendy Lewis | Grn | 176 | 8.6% |
|---|
| John Stanford | UKIP | 163 | 7.9% |
|---|
| Peter Parvin | C | 623 | 66.3% |
|---|
| Juliet Maddocks | Ind | 187 | 19.9% |
|---|
| Maggie Lack | Lab | 129 | 13.7% |
|---|
| Susan Grigg | LD | 519 | 50.5% |
|---|
| Steve Sheppard | C | 413 | 40.2% |
|---|
| Joshua Amos | Lab | 49 | 4.8% |
|---|
| Denise Hay | Grn | 47 | 4.6% |
|---|
| Annabelle Blackmore | C | 1612 | 63.4% |
|---|
| Carol Jacques | LD | 425 | 16.7% |
|---|
| Edith Davis | Lab | 317 | 12.5% |
|---|
| James Shalice | Grn | 188 | 7.4% |
|---|
| Mervyn Warner | LD | 871 | 38.3% |
|---|
| Jeff Tree | C | 782 | 34.4% |
|---|
| Keith Adkinson | Lab | 330 | 14.5% |
|---|
| Charles Elliott | UKIP | 152 | 6.7% |
|---|
| Derek Eagle | Grn | 140 | 6.2% |
|---|
| Marion Ring | C | 1139 | 52.2% |
|---|
| Geoff Harvey | Lab | 589 | 27.0% |
|---|
| Geoffrey Samme | LD | 193 | 8.9% |
|---|
| Stephen Muggeridge | Grn | 157 | 7.2% |
|---|
| Gary Butler | BNP | 102 | 4.7% |
|---|
| Mike Hogg | C | 1242 | 45.1% |
|---|
| John Wilson | LD | 1171 | 42.6% |
|---|
| Richard Coates | Lab | 338 | 12.3% |
|---|
| Richard Lusty | C | 1211 | 64.6% |
|---|
| John Randall | Lab | 288 | 15.4% |
|---|
| Ralph Austin | LD | 228 | 12.2% |
|---|
| Ian McDonald | Grn | 148 | 7.9% |
|---|
| Paulina Stockell | C | 735 | 73.3% |
|---|
| Jean Harvey | Lab | 156 | 15.6% |
|---|
| Susan Austin | LD | 112 | 11.2% |
|---|
Back to the 2011 list of councils.
Copyright © Andrew Teale, 2002–2026.
All text and images in this website are available for reuse and modification under the terms of theCreative Commons Attribution-Sharealike 3.0 Unported Licence and theGNU Free Documentation Licence (unversioned, with no invariant sections, front-cover texts, or back-cover texts).
All electoral data on this website are based on information kindly supplied by the relevant Returning Officer and are held for archiving, historical and research purposes in the public interest as provided for by the Data Protection Act 2018.
This website does not use cookies or collect any data on users.
This website can be accessed anonymously at:
ya63kyvm3fstfre3tpgjckcv7tzpbu5
wfx64ggqztks4e2sruav5wjad.onion
If this website has been helpful to you,please consider making a donation to support the work required to keep the Local Elections Archive Project going.
Comments? Corrections? Constructive abuse? Commissions? Cash donations? Email me: