Local Election Results 2007
Colchester
One-third of council up for election. No elections this year in Dedham and Langham, East Donyland, Harbour, Lexden, Marks Tey, Pyefleet or St John's.
Other results for Colchester:20022003200420062008201020112012201420152016201820192021202220232024
By-elections for Colchester (may be incomplete): 22nd April 2004 (Wivenhoe Quay) — 21st October 2004 (Berechurch) — 4th December 2008 (Birch & Winstree) — 2nd May 2013 (West Mersea) — 3rd July 2014 (Wivenhoe Quay) — 22nd October 2015 (Dedham & Langham) — 7th September 2017 (Shrub End) — 28th July 2022 (Lexden & Braiswick) — 8th December 2022 (Highwoods) — 21st September 2023 (Highwoods) — 20th February 2025 (Tiptree) — 23rd October 2025 (New Town & Christ Church)
Results for Essex county council:20052009201320172021
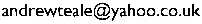
Map of the results —Export spreadsheet
| Party | Votes | Percent | Seats |
|---|
| Conservative | 14342 | 41.8% | 9 |
| Liberal Democrat | 10052 | 29.3% | 7 |
| Labour | 5581 | 16.3% | 3 |
| Green Party | 3267 | 9.5% | 0 |
| Independent | 1052 | 3.1% | 1 |
| Dave Harris | Lab | 931 | 49.7% |
|---|
| Keith Hindle | LD | 483 | 25.8% |
|---|
| Claire Bright | C | 352 | 18.8% |
|---|
| Philippa Lane | Grn | 109 | 5.8% |
|---|
| Peter Crowe | C | 1164 | 70.1% |
|---|
| Jonathan Longman | LD | 313 | 18.9% |
|---|
| James Spencer | Lab | 100 | 6.0% |
|---|
| Tobie Glenny | Grn | 83 | 5.0% |
|---|
| Nick Barlow | LD | 940 | 41.0% |
|---|
| Peter Lynn | Grn | 740 | 32.3% |
|---|
| Glenn Granger | C | 469 | 20.5% |
|---|
| Michael Powell | Lab | 142 | 6.2% |
|---|
| Martin Hunt | LD | 588 | 42.4% |
|---|
| Andrew Bright | C | 474 | 34.2% |
|---|
| Alexander Cave | Grn | 245 | 17.7% |
|---|
| David Canning | Lab | 79 | 5.7% |
|---|
| Jackie Maclean | C | 394 | 69.1% |
|---|
| Sue Waite | LD | 82 | 14.4% |
|---|
| Ian Spademan | Lab | 48 | 8.4% |
|---|
| Sophie Lovejoy | Grn | 46 | 8.1% |
|---|
| Nigel Chapman | C | 913 | 67.2% |
|---|
| David Shakespeare | LD | 180 | 13.2% |
|---|
| Mervyn Carter | Grn | 146 | 10.7% |
|---|
| Jo Aldous | Lab | 120 | 8.8% |
|---|
| Peter Chillingworth | C | 670 | 71.9% |
|---|
| Carolyn Catney | LD | 105 | 11.3% |
|---|
| John Wood | Lab | 90 | 9.7% |
|---|
| Paul Goldsmith | Grn | 67 | 7.2% |
|---|
| Philip Oxford | Ind | 1052 | 52.6% |
|---|
| Simon Lucas | C | 427 | 21.4% |
|---|
| John Baker | LD | 306 | 15.3% |
|---|
| Janet Smith | Lab | 127 | 6.4% |
|---|
| Gary Kittle | Grn | 88 | 4.4% |
|---|
| Anne Turrell | LD | 1081 | 47.1% |
|---|
| Marianne Andersen | C | 995 | 43.4% |
|---|
| Steve Crawshaw | Lab | 118 | 5.1% |
|---|
| Mary Bryan | Grn | 99 | 4.3% |
|---|
| Margaret Fisher | LD | 872 | 55.6% |
|---|
| George Askew | C | 271 | 17.3% |
|---|
| Linda Wonnacott | Grn | 252 | 16.1% |
|---|
| Luke Dopson | Lab | 173 | 11.0% |
|---|
| Wyn Foster | C | 1404 | 54.2% |
|---|
| Paul Ost | LD | 875 | 33.8% |
|---|
| Michael Dale | Lab | 182 | 7.0% |
|---|
| Peter Appleton | Grn | 129 | 5.0% |
|---|
| Tim Young | Lab | 969 | 61.6% |
|---|
| Rebecca Price | LD | 299 | 19.0% |
|---|
| Alex Wilson | C | 237 | 15.1% |
|---|
| Andrew Senter | Grn | 68 | 4.3% |
|---|
| Barrie Cook | LD | 1000 | 49.3% |
|---|
| Kim Naish | Lab | 548 | 27.0% |
|---|
| Anne Allan | C | 368 | 18.2% |
|---|
| Annick Collins-Leyssen | Grn | 111 | 5.5% |
|---|
| Pauline Hazell | C | 718 | 38.5% |
|---|
| Nigel Offen | LD | 643 | 34.5% |
|---|
| Richard Bourne | Lab | 404 | 21.7% |
|---|
| Walter Schwarz | Grn | 100 | 5.4% |
|---|
| Lesley Scott-Boutell | LD | 1214 | 52.2% |
|---|
| Beverly Davies | C | 897 | 38.6% |
|---|
| John Spademan | Lab | 141 | 6.1% |
|---|
| Pam Nelson | Grn | 74 | 3.2% |
|---|
| Margaret Crowe | C | 1185 | 65.4% |
|---|
| Audrey Spencer | Lab | 330 | 18.2% |
|---|
| Michael Turrell | LD | 151 | 8.3% |
|---|
| Katherine Bamforth | Grn | 146 | 8.1% |
|---|
| Jill Tod | C | 877 | 62.9% |
|---|
| Barry Woodward | LD | 177 | 12.7% |
|---|
| Abigail Tootal | Lab | 173 | 12.4% |
|---|
| Roger Bamforth | Grn | 167 | 12.0% |
|---|
| Margaret Kimberley | C | 1510 | 74.1% |
|---|
| Christopher Butler | LD | 201 | 9.9% |
|---|
| Barbara Nichols | Lab | 178 | 8.7% |
|---|
| Beverley Maltby | Grn | 148 | 7.3% |
|---|
| Mark Cory | LD | 395 | 42.5% |
|---|
| David Adams | C | 371 | 39.9% |
|---|
| Maria Iacovou | Grn | 83 | 8.9% |
|---|
| Rossanna Trudgian | Lab | 80 | 8.6% |
|---|
| Stephen Ford | Lab | 648 | 35.9% |
|---|
| Penny Kraft | C | 646 | 35.7% |
|---|
| Chris Fox | Grn | 366 | 20.3% |
|---|
| Sharon Humphrey | LD | 147 | 8.1% |
|---|
Back to the 2007 list of councils.
Copyright © Andrew Teale, 2002–2026.
All text and images in this website are available for reuse and modification under the terms of theCreative Commons Attribution-Sharealike 3.0 Unported Licence and theGNU Free Documentation Licence (unversioned, with no invariant sections, front-cover texts, or back-cover texts).
All electoral data on this website are based on information kindly supplied by the relevant Returning Officer and are held for archiving, historical and research purposes in the public interest as provided for by the Data Protection Act 2018.
This website does not use cookies or collect any data on users.
This website can be accessed anonymously at:
ya63kyvm3fstfre3tpgjckcv7tzpbu5
wfx64ggqztks4e2sruav5wjad.onion
If this website has been helpful to you,please consider making a donation to support the work required to keep the Local Elections Archive Project going.
Comments? Corrections? Constructive abuse? Commissions? Cash donations? Email me: