Local Election Results 2006
North East Lincolnshire
One-third of council up for election.
Other results for North East Lincolnshire:2003200420072008201020112012201420152016201820192021202220232024
By-elections for North East Lincolnshire (may be incomplete): 26th August 2004 (East Marsh) — 26th March 2009 (Yarborough) — 4th April 2013 (Humberston & New Waltham) — 23rd July 2015 (Croft Baker) — 9th June 2016 (South) — 26th July 2018 (Freshney) — 1st July 2021 (Heneage) — 17th February 2022 (Park)
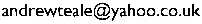
Map of the results —Export spreadsheet
| Party | Votes | Percent | Seats |
|---|
| Conservative | 11320 | 33.6% | 7 |
| Labour | 10963 | 32.6% | 1 |
| Liberal Democrat | 8234 | 24.4% | 7 |
| Independent | 2061 | 6.1% | 1 |
| British National Party | 577 | 1.7% | 0 |
| Green Party | 524 | 1.6% | 0 |
| Colin Eastwell | LD | 1217 | 46.4% |
|---|
| Alex Wallace | Lab | 943 | 36.0% |
|---|
| George Georgiou | Ind | 463 | 17.7% |
|---|
| Stephen Beasant | LD | 1141 | 62.8% |
|---|
| Frances Bovill | Lab | 677 | 37.2% |
|---|
| Peggy Elliott | Lab | 969 | 50.9% |
|---|
| Phyllis Butterworth | C | 936 | 49.1% |
|---|
| Nigel Wright | C | 842 | |
|---|
| Sylvia Moss | Lab | 809 | |
|---|
| Margaret Cracknell | C | 2176 | 75.2% |
|---|
| Karl Wilson | Lab | 717 | 24.8% |
|---|
| Stephen Kibble | LD | 1229 | 61.9% |
|---|
| Matthew Patrick | Lab | 758 | 38.1% |
|---|
| John Colebrook | C | 1992 | 71.6% |
|---|
| April Baker | Lab | 789 | 28.4% |
|---|
| Karen Swinburn | C | 1714 | 54.5% |
|---|
| David Bolton | Lab | 1430 | 45.5% |
|---|
| Daniel Khan | LD | 1335 | 47.7% |
|---|
| Stephen Fyfe | BNP | 577 | 20.6% |
|---|
| Christine Dixon | Lab | 488 | 17.4% |
|---|
| David Brooks | Grn | 401 | 14.3% |
|---|
| David Hornby | C | 1503 | 58.5% |
|---|
| Marian Jervis | Lab | 567 | 22.1% |
|---|
| Tony Knight | Ind | 499 | 19.4% |
|---|
| Malcolm Morland | LD | 1173 | 57.7% |
|---|
| Alan Cowood | Lab | 860 | 42.3% |
|---|
| Doug Pickett | LD | 770 | 39.0% |
|---|
| Kenneth Wardle | Lab | 675 | 34.2% |
|---|
| Deborah Hill | Ind | 529 | 26.8% |
|---|
| Iain Colquhoun | C | 1515 | 78.6% |
|---|
| George Baker | Lab | 413 | 21.4% |
|---|
| Keith Watkin | Ind | 570 | 51.9% |
|---|
| Alan Burley | Lab | 406 | 36.9% |
|---|
| Glenn Radley | Grn | 123 | 11.2% |
|---|
| Peter Mills | C | 1484 | 76.7% |
|---|
| Mark Sandford | Lab | 452 | 23.3% |
|---|
| Sarah Blundell | LD | 1369 | 62.6% |
|---|
| Michael Burnett | Lab | 819 | 37.4% |
|---|
Back to the 2006 list of councils.
Copyright © Andrew Teale, 2002–2026.
All text and images in this website are available for reuse and modification under the terms of theCreative Commons Attribution-Sharealike 3.0 Unported Licence and theGNU Free Documentation Licence (unversioned, with no invariant sections, front-cover texts, or back-cover texts).
All electoral data on this website are based on information kindly supplied by the relevant Returning Officer and are held for archiving, historical and research purposes in the public interest as provided for by the Data Protection Act 2018.
This website does not use cookies or collect any data on users.
This website can be accessed anonymously at:
ya63kyvm3fstfre3tpgjckcv7tzpbu5
wfx64ggqztks4e2sruav5wjad.onion
If this website has been helpful to you,please consider making a donation to support the work required to keep the Local Elections Archive Project going.
Comments? Corrections? Constructive abuse? Commissions? Cash donations? Email me: