Local Election Results 2003
Southampton
One-third of council up for election.
Other results for Southampton:20022004200620072008201020112012201420152016201820192021202220232024
By-elections for Southampton (may be incomplete): 15th September 2005 (Bitterne Park) — 13th June 2013 (Woolston) — 14th March 2019 (Coxford) — 1st December 2022 (Bitterne) — 10th October 2024 (Shirley)
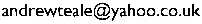
Map of the results —Export spreadsheet
| Party | Votes | Percent | Seats |
|---|
| Liberal Democrat | 14710 | 30.7% | 6 |
| Labour | 14442 | 30.1% | 4 |
| Conservative | 14403 | 30.0% | 6 |
| British National Party | 1179 | 2.5% | 0 |
| Liberal Party | 1023 | 2.1% | 0 |
| UK Independence Party | 893 | 1.9% | 0 |
| Green Party | 652 | 1.4% | 0 |
| Socialist Alliance | 477 | 1.0% | 0 |
| Independent | 201 | 0.4% | 0 |
| Parvin Damani | Lab | 779 | 46.1% |
|---|
| Tina Lanning | C | 494 | 29.2% |
|---|
| Maureen Kirkwood | LD | 416 | 24.6% |
|---|
| Alec Samuels | C | 1673 | 46.2% |
|---|
| Judith Webb | LD | 1221 | 33.7% |
|---|
| Michael Lewkowicz | Lab | 480 | 13.2% |
|---|
| Violet Riddle | Lib | 139 | 3.8% |
|---|
| Michael Cottrell | UKIP | 111 | 3.1% |
|---|
| Jacqui Rayment | Lab | 1021 | 47.0% |
|---|
| Christine Hordley | LD | 464 | 21.3% |
|---|
| Pamela Rees | C | 399 | 18.4% |
|---|
| David Cromwell | Grn | 191 | 8.8% |
|---|
| Ella Noyes | SocAll | 99 | 4.6% |
|---|
| Matthew Stevens | Lab | 1268 | 44.2% |
|---|
| Ivan White | C | 740 | 25.8% |
|---|
| Robert Naish | LD | 487 | 17.0% |
|---|
| Jason Brown | BNP | 288 | 10.0% |
|---|
| Conrad Brown | UKIP | 84 | 2.9% |
|---|
| Peter Baillie | C | 1457 | 42.0% |
|---|
| Frederick Tucker | LD | 1287 | 37.1% |
|---|
| Joseph Hannigan | Lab | 603 | 17.4% |
|---|
| Kenneth Bellwood | Lib | 118 | 3.4% |
|---|
| Kenneth Darke | LD | 1187 | 39.3% |
|---|
| Sarah Bogle | Lab | 933 | 30.9% |
|---|
| Lesley Matthews | C | 361 | 12.0% |
|---|
| Michael Gausden | Lib | 245 | 8.1% |
|---|
| Edwin Gamon | BNP | 197 | 6.5% |
|---|
| Leslie Obee | UKIP | 95 | 3.1% |
|---|
| Brian Parnell | C | 1308 | 43.9% |
|---|
| Norman Rides | Lab | 861 | 28.9% |
|---|
| Barbara Cummins | LD | 487 | 16.3% |
|---|
| Darren Pickering | Grn | 256 | 8.6% |
|---|
| Mark Abel | SocAll | 70 | 2.3% |
|---|
| Adrian Johnson | C | 1792 | 50.6% |
|---|
| Kenneth Tew | Lab | 1143 | 32.3% |
|---|
| Simon Hordley | LD | 606 | 17.1% |
|---|
| Christopher Proctor | LD | 1338 | 41.2% |
|---|
| Nigel Clark | Lab | 763 | 23.5% |
|---|
| Michael Ball | C | 502 | 15.5% |
|---|
| George Melrose | Lib | 367 | 11.3% |
|---|
| Terrie Rintoul | BNP | 230 | 7.1% |
|---|
| Derek Twine | SocAll | 49 | 1.5% |
|---|
| John Slade | LD | 1519 | 49.1% |
|---|
| Roger Iles | Lab | 814 | 26.3% |
|---|
| Michael Denness | C | 616 | 19.9% |
|---|
| Martin Daish | UKIP | 146 | 4.7% |
|---|
| Calvin Horner | LD | 1528 | 47.5% |
|---|
| Edward Daunt | C | 700 | 21.8% |
|---|
| Ann Wardle | Lab | 562 | 17.5% |
|---|
| Joseph Cox | Grn | 205 | 6.4% |
|---|
| Jeanne Butterfield | SocAll | 136 | 4.2% |
|---|
| Susan Pike | Lib | 86 | 2.7% |
|---|
| Peter Marsh-Jenks | Lab | 1235 | 43.3% |
|---|
| Enid Greenham | C | 699 | 24.5% |
|---|
| Edward Blake | LD | 598 | 21.0% |
|---|
| Jason Robinson | BNP | 275 | 9.6% |
|---|
| Paul Nicholson | SocAll | 46 | 1.6% |
|---|
| Richard Forbes | C | 1579 | 44.2% |
|---|
| Warwick Payne | Lab | 1028 | 28.8% |
|---|
| David Newman | LD | 657 | 18.4% |
|---|
| Simon Hardy | Ind | 201 | 5.6% |
|---|
| Kevin Costigane | UKIP | 106 | 3.0% |
|---|
| Gavin Dick | C | 1269 | 37.6% |
|---|
| Paul Jenks | Lab | 1225 | 36.3% |
|---|
| Colin McPhee | LD | 588 | 17.4% |
|---|
| Tony Weaver | UKIP | 256 | 7.6% |
|---|
| Leonora Goergen | SocAll | 39 | 1.2% |
|---|
| Terence Holden-Brown | LD | 1066 | 46.4% |
|---|
| Michael Bransby | Lab | 636 | 27.7% |
|---|
| Robert Alexander | C | 432 | 18.8% |
|---|
| Rodney Caws | UKIP | 95 | 4.1% |
|---|
| June Mitchell | Lib | 68 | 3.0% |
|---|
| David Simpson | LD | 1261 | 42.6% |
|---|
| Julian Price | Lab | 1091 | 36.8% |
|---|
| Brian Lankford | C | 382 | 12.9% |
|---|
| Debbyann Payne | BNP | 189 | 6.4% |
|---|
| Matthew Wilkinson | SocAll | 38 | 1.3% |
|---|
Back to the 2003 list of councils.
Copyright © Andrew Teale, 2002–2026.
All text and images in this website are available for reuse and modification under the terms of theCreative Commons Attribution-Sharealike 3.0 Unported Licence and theGNU Free Documentation Licence (unversioned, with no invariant sections, front-cover texts, or back-cover texts).
All electoral data on this website are based on information kindly supplied by the relevant Returning Officer and are held for archiving, historical and research purposes in the public interest as provided for by the Data Protection Act 2018.
This website does not use cookies or collect any data on users.
This website can be accessed anonymously at:
ya63kyvm3fstfre3tpgjckcv7tzpbu5
wfx64ggqztks4e2sruav5wjad.onion
If this website has been helpful to you,please consider making a donation to support the work required to keep the Local Elections Archive Project going.
Comments? Corrections? Constructive abuse? Commissions? Cash donations? Email me: