Note
Go to the endto download the full example code or to run this example in your browser via JupyterLite or Binder.
Plotting Glyphs (Vectors or PolyData)#
Use vectors in a dataset to plot and orient glyphs/geometric objects.
importnumpyasnp# sphinx_gallery_thumbnail_number = 4importpyvistaaspvfrompyvistaimportexamples
Glyphying can be done via thepyvista.DataSetFilters.glyph() filter
mesh=examples.download_carotid().threshold(145,scalars="scalars")mask=mesh["scalars"]<210mesh["scalars"][mask]=0# null out smaller vectors# Make a geometric object to use as the glyphgeom=pv.Arrow()# This could be any dataset# Perform the glyphglyphs=mesh.glyph(orient="vectors",scale="scalars",factor=0.003,geom=geom)# plot using the plotting classpl=pv.Plotter()pl.add_mesh(glyphs,show_scalar_bar=False,lighting=False,cmap="coolwarm")pl.camera_position=[(146.53,91.28,21.70),(125.00,94.45,19.81),(-0.086,0.007,0.996),]# view only part of the vector fieldcpos=pl.show(return_cpos=True)

Another approach is to load the vectors directly to the mesh object and thenaccess thepyvista.DataSet.arrows property.
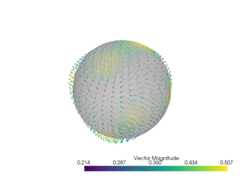
sphere=pv.Sphere(radius=3.14)# make cool swirly patternvectors=np.vstack((np.sin(sphere.points[:,0]),np.cos(sphere.points[:,1]),np.cos(sphere.points[:,2]),)).T# add and scalesphere["vectors"]=vectors*0.3sphere.set_active_vectors("vectors")# plot just the arrowssphere.arrows.plot()

Plot the arrows and the sphere.
p=pv.Plotter()p.add_mesh(sphere.arrows,lighting=False,scalar_bar_args={"title":"Vector Magnitude"})p.add_mesh(sphere,color="grey",ambient=0.6,opacity=0.5,show_edges=False)p.show()
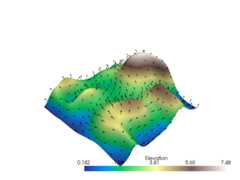
Subset of Glyphs#
Sometimes you might not want glyphs for every node in the input dataset. Inthis case, you can choose to build glyphs for a subset of the input datasetby using a merging tolerance. Here we specify a merging tolerance of fivepercent which equates to five percent of the bounding box’s length.
# Example dataset with normalsmesh=examples.load_random_hills()# create a subset of arrows using the glyph filterarrows=mesh.glyph(scale="Normals",orient="Normals",tolerance=0.05)p=pv.Plotter()p.add_mesh(arrows,color="black")p.add_mesh(mesh,scalars="Elevation",cmap="terrain",smooth_shading=True)p.show()
Total running time of the script: (0 minutes 6.340 seconds)
Estimated memory usage: 563 MB