Contents
- Tutorial
- API
- Technical Details
- command lines
- Example gallery
More
Back to top


Note
Go to the endto download the full example code.
Profiling with onnxruntime
onnxruntime optimizes the onnx graph by default before runningthe inference. It modifies, fuses or add new operators.Some of them are standard onnx operators, some of themare implemented in onnxruntime (seeSupported Operators).This example profiles the two models.
Optimize a model with onnxruntime
importosimportnumpyimportmatplotlib.pyplotaspltfromonnxruntimeimportget_available_providersfromonnx_array_api.ext_test_caseimportexample_pathfromonnx_array_api.ort.ort_optimizersimportort_optimized_modelfromonnx_array_api.ort.ort_profileimportort_profile,merge_ort_profilefromonnx_array_api.plotting.stat_plotimportplot_ort_profilesuffix=""filename=example_path(f"data/small{suffix}.onnx")optimized=filename+".optimized.onnx"print(f"model={filename!r}")ifnotos.path.exists(optimized):ort_optimized_model(filename,output=optimized)print(f"optimized={optimized!r}")
model='data/small.onnx'optimized='data/small.onnx.optimized.onnx'
Profiling
feeds={"input":numpy.random.random((1,3,112,112)).astype(numpy.float32)}prof_base=ort_profile(filename,feeds,repeat=6,disable_optimization=True,providers=["CPUExecutionProvider"],)prof_base.to_excel(f"prof_base{suffix}.xlsx",index=False)prof_base
| cat | pid | tid | dur | ts | ph | name | args_op_name | op_name | args_thread_scheduling_stats | args_output_type_shape | args_output_size | args_parameter_size | args_activation_size | args_node_index | args_input_type_shape | args_provider | event_name | iteration | |
|---|---|---|---|---|---|---|---|---|---|---|---|---|---|---|---|---|---|---|---|
| 0 | Session | 85022 | 85022 | 483 | 3 | X | model_loading_uri | NaN | NaN | NaN | NaN | NaN | NaN | NaN | NaN | NaN | NaN | model_loading_uri | -1 |
| 1 | Session | 85022 | 85022 | 466 | 518 | X | session_initialization | NaN | NaN | NaN | NaN | NaN | NaN | NaN | NaN | NaN | NaN | session_initialization | -1 |
| 2 | Node | 85022 | 85022 | 0 | 1139 | X | n0_fence_before | Conv | n0 | NaN | NaN | NaN | NaN | NaN | NaN | NaN | NaN | fence_before | -1 |
| 3 | Node | 85022 | 85022 | 965 | 1141 | X | n0_kernel_time | Conv | n0 | {'main_thread': {'thread_pool_name': 'session-... | [{'float': [1, 64, 112, 112]}] | 3211264 | 7168 | 150528 | 0 | [{'float': [1, 3, 112, 112]}, {'float': [64, 3... | CPUExecutionProvider | kernel_time | -1 |
| 4 | Node | 85022 | 85022 | 0 | 2114 | X | n0_fence_after | Conv | n0 | NaN | NaN | NaN | NaN | NaN | NaN | NaN | NaN | fence_after | -1 |
| ... | ... | ... | ... | ... | ... | ... | ... | ... | ... | ... | ... | ... | ... | ... | ... | ... | ... | ... | ... |
| 261 | Node | 85022 | 85022 | 0 | 238872 | X | n13_fence_before | Add | n13 | NaN | NaN | NaN | NaN | NaN | NaN | NaN | NaN | fence_before | 4 |
| 262 | Node | 85022 | 85022 | 70 | 238873 | X | n13_kernel_time | Add | n13 | {'main_thread': {'thread_pool_name': 'session-... | [{'float': [1, 64, 56, 56]}] | 802816 | 0 | 1605632 | 13 | [{'float': [1, 64, 56, 56]}, {'float': [1, 64,... | CPUExecutionProvider | kernel_time | 4 |
| 263 | Node | 85022 | 85022 | 0 | 238949 | X | n13_fence_after | Add | n13 | NaN | NaN | NaN | NaN | NaN | NaN | NaN | NaN | fence_after | 4 |
| 264 | Session | 85022 | 85022 | 12851 | 226101 | X | SequentialExecutor::Execute | NaN | NaN | NaN | NaN | NaN | NaN | NaN | NaN | NaN | NaN | SequentialExecutor::Execute | 5 |
| 265 | Session | 85022 | 85022 | 12876 | 226084 | X | model_run | NaN | NaN | NaN | NaN | NaN | NaN | NaN | NaN | NaN | NaN | model_run | 5 |
266 rows × 19 columns
And the optimized model.
| cat | pid | tid | dur | ts | ph | name | args_op_name | op_name | args_thread_scheduling_stats | args_output_type_shape | args_output_size | args_parameter_size | args_activation_size | args_node_index | args_input_type_shape | args_provider | event_name | iteration | |
|---|---|---|---|---|---|---|---|---|---|---|---|---|---|---|---|---|---|---|---|
| 0 | Session | 85022 | 85022 | 497 | 2 | X | model_loading_uri | NaN | NaN | NaN | NaN | NaN | NaN | NaN | NaN | NaN | NaN | model_loading_uri | -1 |
| 1 | Session | 85022 | 85022 | 378 | 525 | X | session_initialization | NaN | NaN | NaN | NaN | NaN | NaN | NaN | NaN | NaN | NaN | session_initialization | -1 |
| 2 | Node | 85022 | 85022 | 0 | 1023 | X | r0_nchwc_fence_before | Conv | r0_nchwc | NaN | NaN | NaN | NaN | NaN | NaN | NaN | NaN | fence_before | -1 |
| 3 | Node | 85022 | 85022 | 672 | 1026 | X | r0_nchwc_kernel_time | Conv | r0_nchwc | {'main_thread': {'thread_pool_name': 'session-... | [{'float': [1, 64, 112, 112]}] | 3211264 | 7168 | 150528 | 0 | [{'float': [1, 3, 112, 112]}, {'float': [64, 3... | CPUExecutionProvider | kernel_time | -1 |
| 4 | Node | 85022 | 85022 | 0 | 1704 | X | r0_nchwc_fence_after | Conv | r0_nchwc | NaN | NaN | NaN | NaN | NaN | NaN | NaN | NaN | fence_after | -1 |
| ... | ... | ... | ... | ... | ... | ... | ... | ... | ... | ... | ... | ... | ... | ... | ... | ... | ... | ... | ... |
| 351 | Node | 85022 | 85022 | 0 | 249744 | X | ReorderOutput_token_16_fence_before | ReorderOutput | ReorderOutput_token_16 | NaN | NaN | NaN | NaN | NaN | NaN | NaN | NaN | fence_before | 4 |
| 352 | Node | 85022 | 85022 | 48 | 249745 | X | ReorderOutput_token_16_kernel_time | ReorderOutput | ReorderOutput_token_16 | {'main_thread': {'thread_pool_name': 'session-... | [{'float': [1, 64, 56, 56]}] | 802816 | 0 | 802816 | 18 | [{'float': [1, 64, 56, 56]}] | CPUExecutionProvider | kernel_time | 4 |
| 353 | Node | 85022 | 85022 | 0 | 249796 | X | ReorderOutput_token_16_fence_after | ReorderOutput | ReorderOutput_token_16 | NaN | NaN | NaN | NaN | NaN | NaN | NaN | NaN | fence_after | 4 |
| 354 | Session | 85022 | 85022 | 23834 | 225966 | X | SequentialExecutor::Execute | NaN | NaN | NaN | NaN | NaN | NaN | NaN | NaN | NaN | NaN | SequentialExecutor::Execute | 5 |
| 355 | Session | 85022 | 85022 | 23860 | 225951 | X | model_run | NaN | NaN | NaN | NaN | NaN | NaN | NaN | NaN | NaN | NaN | model_run | 5 |
356 rows × 19 columns
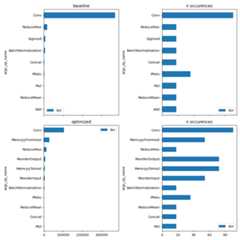
And the graph is:
unique_op=set(prof_base["args_op_name"])fig,ax=plt.subplots(2,2,figsize=(10,len(unique_op)),sharex="col")plot_ort_profile(prof_base,ax[0,0],ax[0,1],title="baseline")plot_ort_profile(prof_opti,ax[1,0],ax[1,1],title="optimized")fig.tight_layout()fig.savefig(f"plot_profiling{suffix}.png")
Merging profiles
Let’s try to compare both profiles assuming every iterationprocess the same image and the input and output size are thesame at every iteration.
~/github/onnx-array-api/onnx_array_api/ort/ort_profile.py:260: FutureWarning: The provided callable <function sum at 0x7fc0d2399d80> is currently using SeriesGroupBy.sum. In a future version of pandas, the provided callable will be used directly. To keep current behavior pass the string "sum" instead. .agg(~/github/onnx-array-api/onnx_array_api/ort/ort_profile.py:260: FutureWarning: The provided callable <function sum at 0x7fc0d2399d80> is currently using SeriesGroupBy.sum. In a future version of pandas, the provided callable will be used directly. To keep current behavior pass the string "sum" instead. .agg(
| args_op_name | args_output_type_shape | args_input_type_shape | args_provider | idx | durbase | countbase | duropti | countopti | |
|---|---|---|---|---|---|---|---|---|---|
| 0 | Add | [{'float': [1, 64, 56, 56]}] | [{'float': [1, 64, 56, 56]}, {'float': [1, 64,... | CPUExecutionProvider | 0 | 2420.0 | 6.0 | NaN | NaN |
| 1 | BatchNormalization | [{'float': [1, 64, 112, 112]}] | [{'float': [1, 64, 112, 112]}, {'float': [64]}... | CPUExecutionProvider | 0 | 2548.0 | 6.0 | 8064.0 | 6.0 |
| 2 | Concat | [{'float': [1, 2, 112, 112]}] | [{'float': [1, 1, 112, 112]}, {'float': [1, 1,... | CPUExecutionProvider | 0 | 166.0 | 6.0 | 127.0 | 6.0 |
| 3 | Conv | [{'float': [1, 1, 112, 112]}] | [{'float': [1, 2, 112, 112]}, {'float': [1, 2,... | CPUExecutionProvider | 0 | 2497.0 | 6.0 | NaN | NaN |
| 4 | Conv | [{'float': [1, 64, 112, 112]}] | [{'float': [1, 3, 112, 112]}, {'float': [64, 3... | CPUExecutionProvider | 0 | 5364.0 | 6.0 | 4311.0 | 6.0 |
| 5 | Conv | [{'float': [1, 64, 112, 112]}] | [{'float': [1, 64, 112, 112]}, {'float': [64, ... | CPUExecutionProvider | 0 | 101656.0 | 6.0 | 102240.0 | 6.0 |
| 6 | Conv | [{'float': [1, 64, 56, 56]}] | [{'float': [1, 64, 112, 112]}, {'float': [64, ... | CPUExecutionProvider | 0 | 9524.0 | 6.0 | 1767.0 | 6.0 |
| 7 | Conv | [{'float': [1, 64, 56, 56]}] | [{'float': [1, 64, 112, 112]}, {'float': [64, ... | CPUExecutionProvider | 0 | NaN | NaN | 53992.0 | 6.0 |
| 8 | Conv | [{'float': [1, 64, 56, 56]}] | [{'float': [1, 64, 112, 112]}, {'float': [64, ... | CPUExecutionProvider | 0 | 59088.0 | 6.0 | NaN | NaN |
| 9 | Conv | [{'float': [1, 8, 112, 112]}] | [{'float': [1, 2, 112, 112]}, {'float': [8, 2,... | CPUExecutionProvider | 0 | NaN | NaN | 19992.0 | 6.0 |
| 10 | Mul | [{'float': [1, 64, 112, 112]}] | [{'float': [1, 1, 112, 112]}, {'float': [1, 64... | CPUExecutionProvider | 0 | 2140.0 | 6.0 | 5791.0 | 6.0 |
| 11 | PRelu | [{'float': [1, 64, 112, 112]}] | [{'float': [1, 64, 112, 112]}, {'float': [64, ... | CPUExecutionProvider | 0 | 12364.0 | 6.0 | 1828.0 | 6.0 |
| 12 | PRelu | [{'float': [1, 64, 112, 112]}] | [{'float': [1, 64, 112, 112]}, {'float': [64, ... | CPUExecutionProvider | 1 | 2347.0 | 6.0 | 1783.0 | 6.0 |
| 13 | ReduceMax | [{'float': [1, 1, 112, 112]}] | [{'float': [1, 64, 112, 112]}] | CPUExecutionProvider | 0 | 13900.0 | 6.0 | 23211.0 | 6.0 |
| 14 | ReduceMean | [{'float': [1, 1, 112, 112]}] | [{'float': [1, 64, 112, 112]}] | CPUExecutionProvider | 0 | 20925.0 | 6.0 | 5553.0 | 6.0 |
| 15 | ReorderInput | [{'float': [1, 64, 112, 112]}] | [{'float': [1, 64, 112, 112]}] | CPUExecutionProvider | 0 | NaN | NaN | 6279.0 | 6.0 |
| 16 | ReorderInput | [{'float': [1, 64, 112, 112]}] | [{'float': [1, 64, 112, 112]}] | CPUExecutionProvider | 1 | NaN | NaN | 1533.0 | 6.0 |
| 17 | ReorderInput | [{'float': [1, 64, 112, 112]}] | [{'float': [1, 64, 112, 112]}] | CPUExecutionProvider | 2 | NaN | NaN | 1280.0 | 6.0 |
| 18 | ReorderOutput | [{'float': [1, 1, 112, 112]}] | [{'float': [1, 8, 112, 112]}] | CPUExecutionProvider | 0 | NaN | NaN | 146.0 | 6.0 |
| 19 | ReorderOutput | [{'float': [1, 64, 112, 112]}] | [{'float': [1, 64, 112, 112]}] | CPUExecutionProvider | 0 | NaN | NaN | 6803.0 | 6.0 |
| 20 | ReorderOutput | [{'float': [1, 64, 112, 112]}] | [{'float': [1, 64, 112, 112]}] | CPUExecutionProvider | 1 | NaN | NaN | 1323.0 | 6.0 |
| 21 | ReorderOutput | [{'float': [1, 64, 56, 56]}] | [{'float': [1, 64, 56, 56]}] | CPUExecutionProvider | 0 | NaN | NaN | 931.0 | 6.0 |
| 22 | Sigmoid | [{'float': [1, 1, 112, 112]}] | [{'float': [1, 1, 112, 112]}] | CPUExecutionProvider | 0 | 310.0 | 6.0 | NaN | NaN |
More detailed
gr.to_excel(f"plot_profiling_merged_details{suffix}.xlsx",index=False)gr
| durbase | duropti | countbase | countopti | |
|---|---|---|---|---|
| label | ||||
| [+CPU]Conv(f-1x2x112x112,f-8x2x7x7)->f-1x8x112x112 | 0.0 | 19992.0 | 0.0 | 6.0 |
| [+CPU]Conv(f-1x64x112x112,f-64x64x3x3,f-64,f-1x64x56x56)->f-1x64x56x56 | 0.0 | 53992.0 | 0.0 | 6.0 |
| [+CPU]ReorderInput(f-1x64x112x112)->f-1x64x112x112 | 0.0 | 9092.0 | 0.0 | 18.0 |
| [+CPU]ReorderOutput(f-1x64x112x112)->f-1x64x112x112 | 0.0 | 8126.0 | 0.0 | 12.0 |
| [+CPU]ReorderOutput(f-1x64x56x56)->f-1x64x56x56 | 0.0 | 931.0 | 0.0 | 6.0 |
| [+CPU]ReorderOutput(f-1x8x112x112)->f-1x1x112x112 | 0.0 | 146.0 | 0.0 | 6.0 |
| [-CPU]Add(f-1x64x56x56,f-1x64x56x56)->f-1x64x56x56 | 2420.0 | 0.0 | 6.0 | 0.0 |
| [-CPU]Conv(f-1x2x112x112,f-1x2x7x7)->f-1x1x112x112 | 2497.0 | 0.0 | 6.0 | 0.0 |
| [-CPU]Conv(f-1x64x112x112,f-64x64x3x3,f-64)->f-1x64x56x56 | 59088.0 | 0.0 | 6.0 | 0.0 |
| [-CPU]Sigmoid(f-1x1x112x112)->f-1x1x112x112 | 310.0 | 0.0 | 6.0 | 0.0 |
| [=CPU]BatchNormalization(f-1x64x112x112,f-64,f-64,f-64,f-64)->f-1x64x112x112 | 2548.0 | 8064.0 | 6.0 | 6.0 |
| [=CPU]Concat(f-1x1x112x112,f-1x1x112x112)->f-1x2x112x112 | 166.0 | 127.0 | 6.0 | 6.0 |
| [=CPU]Conv(f-1x3x112x112,f-64x3x3x3,f-64)->f-1x64x112x112 | 5364.0 | 4311.0 | 6.0 | 6.0 |
| [=CPU]Conv(f-1x64x112x112,f-64x64x1x1,f-64)->f-1x64x56x56 | 9524.0 | 1767.0 | 6.0 | 6.0 |
| [=CPU]Conv(f-1x64x112x112,f-64x64x3x3,f-64)->f-1x64x112x112 | 101656.0 | 102240.0 | 6.0 | 6.0 |
| [=CPU]Mul(f-1x1x112x112,f-1x64x112x112)->f-1x64x112x112 | 2140.0 | 5791.0 | 6.0 | 6.0 |
| [=CPU]PRelu(f-1x64x112x112,f-64x1x1)->f-1x64x112x112 | 14711.0 | 3611.0 | 12.0 | 12.0 |
| [=CPU]ReduceMax(f-1x64x112x112)->f-1x1x112x112 | 13900.0 | 23211.0 | 6.0 | 6.0 |
| [=CPU]ReduceMean(f-1x64x112x112)->f-1x1x112x112 | 20925.0 | 5553.0 | 6.0 | 6.0 |
Final plot
# let's filter out unsignificant operator.grmax=gr["durbase"]+gr["duropti"]total=grmax.sum()grmax/=totalgr=gr[grmax>=0.01]fig,ax=plt.subplots(1,2,figsize=(14,min(gr.shape[0],500)),sharey=True)gr[["durbase","duropti"]].plot.barh(ax=ax[0])ax[0].set_title("Side by side duration")gr=gr.copy()gr[["countbase","countopti"]].plot.barh(ax=ax[1])ax[1].set_title("Side by side count")fig.tight_layout()fig.savefig(f"plot_profiling_side_by_side{suffix}.png")
On CUDA
if"CUDAExecutionProvider"inget_available_providers():print("Profiling on CUDA")prof_base=ort_profile(filename,feeds,repeat=6,disable_optimization=True,providers=["CUDAExecutionProvider"],)prof_base.to_excel(f"prof_cuda_base{suffix}.xlsx",index=False)prof_opti=ort_profile(optimized,feeds,repeat=6,disable_optimization=True,providers=["CUDAExecutionProvider","CPUExecutionProvider"],)prof_opti.to_excel(f"prof_cuda_opti{suffix}.xlsx",index=False)unique_op=set(prof_base["args_op_name"])fig,ax=plt.subplots(2,2,figsize=(10,len(unique_op)),sharex="col")plot_ort_profile(prof_base,ax[0,0],ax[0,1],title="baseline")plot_ort_profile(prof_opti,ax[1,0],ax[1,1],title="optimized")fig.tight_layout()fig.savefig(f"plot_profiling_cuda{suffix}.png")merge,gr=merge_ort_profile(prof_base,prof_opti)merge.to_excel(f"plot_profiling_merged{suffix}.xlsx",index=False)gr.to_excel(f"plot_profiling_merged_details{suffix}.xlsx",index=False)grmax=gr["durbase"]+gr["duropti"]total=grmax.sum()grmax/=totalgr=gr[grmax>=0.01]fig,ax=plt.subplots(1,2,figsize=(14,min(gr.shape[0],500)),sharey=True)gr[["durbase","duropti"]].plot.barh(ax=ax[0])ax[0].set_title("Side by side duration")gr=gr.copy()gr[["countbase","countopti"]].plot.barh(ax=ax[1])ax[1].set_title("Side by side count")fig.tight_layout()fig.savefig(f"plot_profiling_side_by_side_cuda{suffix}.png")else:print(f"CUDA not available in{get_available_providers()}.")fig,ax=None,Noneax

Profiling on CUDA~/github/onnx-array-api/onnx_array_api/ort/ort_profile.py:260: FutureWarning: The provided callable <function sum at 0x7fc0d2399d80> is currently using SeriesGroupBy.sum. In a future version of pandas, the provided callable will be used directly. To keep current behavior pass the string "sum" instead. .agg(~/github/onnx-array-api/onnx_array_api/ort/ort_profile.py:260: FutureWarning: The provided callable <function sum at 0x7fc0d2399d80> is currently using SeriesGroupBy.sum. In a future version of pandas, the provided callable will be used directly. To keep current behavior pass the string "sum" instead. .agg(array([<Axes: title={'center': 'Side by side duration'}, ylabel='label'>, <Axes: title={'center': 'Side by side count'}, ylabel='label'>], dtype=object)Total running time of the script: (0 minutes 6.359 seconds)