pygad.visualize Module
This section of the PyGAD’s library documentation discusses thepygad.visualize module. It offers the methods for resultsvisualization in PyGAD.
This section discusses the different options to visualize the results inPyGAD through these methods:
plot_fitness(): Creates plots for the fitness.plot_genes(): Creates plots for the genes.plot_new_solution_rate(): Creates plots for the new solutionrate.plot_pareto_front_curve(): Creates plots for the pareto front formulti-objective problems.
In the following code, thesave_solutions flag is set toTruewhich means all solutions are saved in thesolutions attribute. Thecode runs for only 10 generations.
importpygadimportnumpyequation_inputs=[4,-2,3.5,8,-2,3.5,8]desired_output=2671.1234deffitness_func(ga_instance,solution,solution_idx):output=numpy.sum(solution*equation_inputs)fitness=1.0/(numpy.abs(output-desired_output)+0.000001)returnfitnessga_instance=pygad.GA(num_generations=10,sol_per_pop=10,num_parents_mating=5,num_genes=len(equation_inputs),fitness_func=fitness_func,gene_space=[range(1,10),range(10,20),range(15,30),range(20,40),range(25,50),range(10,30),range(20,50)],gene_type=int,save_solutions=True)ga_instance.run()
Let’s explore how to visualize the results by the above mentionedmethods.
Fitness
plot_fitness()
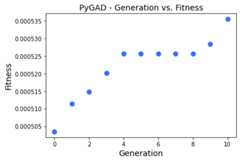
Theplot_fitness() method shows the fitness value for eachgeneration. It creates, shows, and returns a figure that summarizes howthe fitness value(s) evolve(s) by generation.
It works only after completing at least 1 generation. If no generationis completed (at least 1), an exception is raised.
This method accepts the following parameters:
title: Title of the figure.xlabel: X-axis label.ylabel: Y-axis label.linewidth: Line width of the plot. Defaults to3.font_size: Font size for the labels and title. Defaults to14.plot_type: Type of the plot which can be either"plot"(default),"scatter", or"bar".color: Color of the plot which defaults to the greenish color"#64f20c".label: The label used for the legend in the figures ofmulti-objective problems. It is not used for single-objectiveproblems. It defaults toNonewhich means no labels used.save_dir: Directory to save the figure.
plot_type="plot"
The simplest way to call this method is as follows leaving theplot_type with its default value"plot" to create a continuousline connecting the fitness values across all generations:
ga_instance.plot_fitness()# ga_instance.plot_fitness(plot_type="plot")

plot_type="scatter"
Theplot_type can also be set to"scatter" to create a scattergraph with each individual fitness represented as a dot. The size ofthese dots can be changed using thelinewidth parameter.
ga_instance.plot_fitness(plot_type="scatter")
plot_type="bar"
The third value for theplot_type parameter is"bar" to create abar graph with each individual fitness represented as a bar.
ga_instance.plot_fitness(plot_type="bar")

New Solution Rate
plot_new_solution_rate()
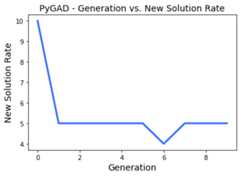
Theplot_new_solution_rate() method presents the number of newsolutions explored in each generation. This helps to figure out if thegenetic algorithm is able to find new solutions as an indication of morepossible evolution. If no new solutions are explored, this is anindication that no further evolution is possible.
It works only after completing at least 1 generation. If no generationis completed (at least 1), an exception is raised.
Theplot_new_solution_rate() method accepts the same parameters asin theplot_fitness() method (it also have 3 possible values forplot_type parameter). Here are all the parameters it accepts:
title: Title of the figure.xlabel: X-axis label.ylabel: Y-axis label.linewidth: Line width of the plot. Defaults to3.font_size: Font size for the labels and title. Defaults to14.plot_type: Type of the plot which can be either"plot"(default),"scatter", or"bar".color: Color of the plot which defaults to"#3870FF".save_dir: Directory to save the figure.
plot_type="plot"
The default value for theplot_type parameter is"plot".
ga_instance.plot_new_solution_rate()# ga_instance.plot_new_solution_rate(plot_type="plot")
The next figure shows that, for example, generation 6 has the leastnumber of new solutions which is 4. The number of new solutions in thefirst generation is always equal to the number of solutions in thepopulation (i.e. the value assigned to thesol_per_pop parameter inthe constructor of thepygad.GA class) which is 10 in this example.
plot_type="scatter"
The previous graph can be represented as scattered points by settingplot_type="scatter".
ga_instance.plot_new_solution_rate(plot_type="scatter")

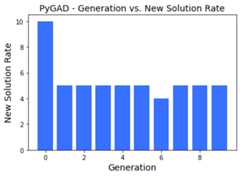
plot_type="bar"
By settingplot_type="scatter", each value is represented as avertical bar.
ga_instance.plot_new_solution_rate(plot_type="bar")
Genes
plot_genes()
Theplot_genes() method is the third option to visualize the PyGADresults. Theplot_genes() method creates, shows, and returns afigure that describes each gene. It has different options to create thefigures which helps to:
Explore the gene value for each generation by creating a normal plot.
Create a histogram for each gene.
Create a boxplot.
It works only after completing at least 1 generation. If no generationis completed, an exception is raised. If no generation is completed (atleast 1), an exception is raised.
This method accepts the following parameters:
title: Title of the figure.xlabel: X-axis label.ylabel: Y-axis label.linewidth: Line width of the plot. Defaults to3.font_size: Font size for the labels and title. Defaults to14.plot_type: Type of the plot which can be either"plot"(default),"scatter", or"bar".graph_type: Type of the graph which can be either"plot"(default),"boxplot", or"histogram".fill_color: Fill color of the graph which defaults to"#3870FF". This has no effect ifgraph_type="plot".color: Color of the plot which defaults to"#3870FF".solutions: Defaults to"all"which means use all solutions.If"best"then only the best solutions are used.save_dir: Directory to save the figure.
This method has 3 control variables:
graph_type="plot": Can be"plot"(default),"boxplot", or"histogram".plot_type="plot": Identical to theplot_typeparameterexplored in theplot_fitness()andplot_new_solution_rate()methods.solutions="all": Can be"all"(default) or"best".
These 3 parameters controls the style of the output figure.
Thegraph_type parameter selects the type of the graph which helpsto explore the gene values as:
A normal plot.
A histogram.
A box and whisker plot.
Theplot_type parameter works only when the type of the graph is setto"plot".
Thesolutions parameter selects whether the genes come from allsolutions in the population or from just the best solutions.
An exception is raised if:
solutions="all"whilesave_solutions=Falsein the constructorof thepygad.GAclass. .solutions="best"whilesave_best_solutions=Falsein theconstructor of thepygad.GAclass. .
graph_type="plot"
Whengraph_type="plot", then the figure creates a normal graph wherethe relationship between the gene values and the generation numbers isrepresented as a continuous plot, scattered points, or bars.
plot_type="plot"
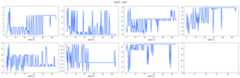
Because the default value for bothgraph_type andplot_type is"plot", then all of the lines below creates the same figure. Thisfigure is helpful to know whether a gene value lasts for moregenerations as an indication of the best value for this gene. Forexample, the value 16 for the gene with index 5 (at column 2 and row 2of the next graph) lasted for 83 generations.
ga_instance.plot_genes()ga_instance.plot_genes(graph_type="plot")ga_instance.plot_genes(plot_type="plot")ga_instance.plot_genes(graph_type="plot",plot_type="plot")
As the default value for thesolutions parameter is"all", thenthe following method calls generate the same plot.
ga_instance.plot_genes(solutions="all")ga_instance.plot_genes(graph_type="plot",solutions="all")ga_instance.plot_genes(plot_type="plot",solutions="all")ga_instance.plot_genes(graph_type="plot",plot_type="plot",solutions="all")
plot_type="scatter"
The following calls of theplot_genes() method create the samescatter plot.
ga_instance.plot_genes(plot_type="scatter")ga_instance.plot_genes(graph_type="plot",plot_type="scatter",solutions='all')

plot_type="bar"
ga_instance.plot_genes(plot_type="bar")ga_instance.plot_genes(graph_type="plot",plot_type="bar",solutions='all')

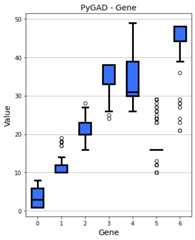
graph_type="boxplot"
By settinggraph_type to"boxplot", then a box and whisker graphis created. Now, theplot_type parameter has no effect.
The following 2 calls of theplot_genes() method create the samefigure as the default value for thesolutions parameter is"all".
ga_instance.plot_genes(graph_type="boxplot")ga_instance.plot_genes(graph_type="boxplot",solutions='all')
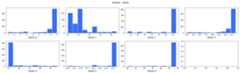
graph_type="histogram"
Forgraph_type="boxplot", then a histogram is created for each gene.Similar tograph_type="boxplot", theplot_type parameter has noeffect.
The following 2 calls of theplot_genes() method create the samefigure as the default value for thesolutions parameter is"all".
ga_instance.plot_genes(graph_type="histogram")ga_instance.plot_genes(graph_type="histogram",solutions='all')
All the previous figures can be created for only the best solutions bysettingsolutions="best".
Pareto Front
plot_pareto_front_curve()
Theplot_pareto_front_curve() method creates the Pareto front curvefor multi-objective optimization problems. It creates, shows, andreturns a figure that shows the Pareto front curve and pointsrepresenting the fitness. It only works when 2 objectives are used.
It works only after completing at least 1 generation. If no generationis completed (at least 1), an exception is raised.
This method accepts the following parameters:
title: Title of the figure.xlabel: X-axis label.ylabel: Y-axis label.linewidth: Line width of the plot. Defaults to3.font_size: Font size for the labels and title. Defaults to14.label: The label used for the legend.color: Color of the plot which defaults to the royal blue color#FF6347.color_fitness: Color of the fitness points which defaults to thetomato red color#4169E1.grid: EitherTrueorFalseto control the visibility ofthe grid.alpha: The transparency of the pareto front curve.marker: The marker of the fitness points.save_dir: Directory to save the figure.
This is an example of calling theplot_pareto_front_curve() method.
ga_instance.plot_pareto_front_curve()