Movatterモバイル変換


[0]ホーム

URL:


Skip to main page content
U.S. flag

An official website of the United States government

Dot gov

The .gov means it’s official.
Federal government websites often end in .gov or .mil. Before sharing sensitive information, make sure you’re on a federal government site.

Https

The site is secure.
Thehttps:// ensures that you are connecting to the official website and that any information you provide is encrypted and transmitted securely.

NIH NLM Logo
Log inShow account info
Access keysNCBI HomepageMyNCBI HomepageMain ContentMain Navigation
pubmed logo
Advanced Clipboard
User Guide

Full text links

Silverchair Information Systems full text link Silverchair Information Systems Free PMC article
Full text links

Actions

Share

.2025 Jan 11;53(2):gkae1199.
doi: 10.1093/nar/gkae1199.

High throughput variant libraries and machine learning yield design rules for retron gene editors

Affiliations

High throughput variant libraries and machine learning yield design rules for retron gene editors

Kate D Crawford et al. Nucleic Acids Res..

Abstract

The bacterial retron reverse transcriptase system has served as an intracellular factory for single-stranded DNA in many biotechnological applications. In these technologies, a natural retron non-coding RNA (ncRNA) is modified to encode a template for the production of custom DNA sequences by reverse transcription. The efficiency of reverse transcription is a major limiting step for retron technologies, but we lack systematic knowledge of how to improve or maintain reverse transcription efficiency while changing the retron sequence for custom DNA production. Here, we test thousands of different modifications to the Retron-Eco1 ncRNA and measure DNA production in pooled variant library experiments, identifying regions of the ncRNA that are tolerant and intolerant to modification. We apply this new information to a specific application: the use of the retron to produce a precise genome editing donor in combination with a CRISPR-Cas9 RNA-guided nuclease (an editron). We use high-throughput libraries in Saccharomyces cerevisiae to additionally define design rules for editrons. We extend our new knowledge of retron DNA production and editron design rules to human genome editing to achieve the highest efficiency Retron-Eco1 editrons to date.

© The Author(s) 2024. Published by Oxford University Press on behalf of Nucleic Acids Research.


Figures

Graphical Abstract
Graphical Abstract
Figure 1.
Figure 1.
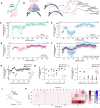
msDNA production of Retron-Eco1 variant libraries inE. coli. (A) Wild-type -Eco1 ncRNA structure. (B) Variant library schematic: variants were introduced on themsr (non-reverse-transcribed part of the ncRNA) or themsd (reverse-transcribed part of the ncRNA). After production of the msDNA libraries inE. coli, ssDNA was sequenced and variants quantified.msd variants were identified on the msDNA, whilemsr variants were identified through a barcode in the P4 loop. (C) msDNA production of all single-nucleotide substitutions relative to wild-type msDNA. Each open circle represents the mean of three biological replicates. (D) msDNA production of 1, 2, 3, 4 and 5 nucleotide deletions starting at a specified ncRNA position relative to wild-type msDNA. Each open circle represents the mean of three biological replicates. (E) msDNA production of 1, 3 and 5 nucleotide insertions starting at a specified ncRNA position relative to wild-type msDNA. Each open circle represents the mean of three biological replicates. (F) Summary of msDNA production relative to wild-type msDNA production of all single-nucleotide variants: insertions (pink), deletions (blue) and substitutions (green). msDNA production relative to wild-type msDNA is shown across the nucleotide positions in the ncRNA from 5′ to 3′. The black line on top is the mean of msDNA production of all the changes at that nucleotide position. Each open circle represents the mean of three biological replicates. (G) msDNA abundance of removing complementarity (black) and restoring complementarity (white) of stem P4 with different nucleotides along the distance from stem base relative to wild-type msDNA abundance. Each circle represents the mean of three biological replicates with error bars representing the standard error. The effect of breaking the stem is significant (one-way ANOVA using only broken stem and wild-type data,P < 0.0001) at positions 1, 4, 5, 6, 7, 8, 18, 20 and 21 compared with the wild-type stem (position 1,P = 0.005; position 4,P = 0.0254; position 5,P = 0.0261 position 6,P = 0.0194; position 7,P = 0.0007; position 8,P = 0.003; position 18,P = 0.0045; position 20,P = 0.0164; position 21,P = 0.0208) (Dunnett’s corrected). Restoring the stem structure significantly increases msDNA production only at positions 7 and 21 (position 7,P = 0.0023; position 21,P = 0.0285) (Bonferroni corrected for multiple comparisons). (H) msDNA abundance of removing complementarity (black) and restoring complementarity (white) of stem P2 with different nucleotides along the distance from stem base relative to wild-type msDNA abundance. Each circle represents the mean of three biological replicates with error bars representing the standard error. The effect of breaking the stem is significant (one-way ANOVA using only broken stem and wild-type data,P < 0.0001) at all positions compared with the wild-type stem except position 7 compared with the wild-type stem (position 1,P < 0.0001; position 2,P < 0.0001; position 3,P < 0.0001; position 4,P < 0.0001; position 5,P < 0.0001; position 6,P < 0.0001; position 7,P = 0.7977; position 8,P = 0.0029) (Dunnett’s corrected). Restoring the stem structure significantly increases msDNA production at positions 1, 2, 3 and 5 (position 1,P = 0.01; position 2,P = 0.001; position 3,P < 0.0001; position 5,P = 0.03) (Bonferroni corrected for multiple comparisons). (I) msDNA abundance of removing complementarity (black) and restoring complementarity (white) of stem P3 with different nucleotides along the distance from stem base relative to wild-type msDNA abundance. Each circle represents the mean of three biological replicates with error bars representing the standard error. The effect of breaking the stem is significant (one-way ANOVA using only broken stem data,P < 0.0001) at all positions compared with the wild-type stem (position 1,P < 0.0001; position 2,P < 0.0001; position 3,P < 0.0001; position 4,P < 0.0001; position 5,P < 0.0001) (Dunnett’s corrected). Restoring the stem structure only significantly increases msDNA production in position 1 (P = 0.0041) (Bonferroni corrected for multiple comparisons). (J) Eco1 RT recognition motif UUU in the terminal loop of stem P3. (K) msDNA production of every permutation of Retron-Eco1 RT recognition motif relative to wild-type msDNA abundance. Position 1 is shown at the top of the heat map, position 3 on the left and position 2 on the bottom. msDNA production is scaled on the red–white color bar, while the standard deviation is represented by the blue around the squares of the heat map. Each square represents the mean of three biological replicates. There is a significant effect of the RT recognition motif (one-way ANOVA,P < 0.0001), with every permutation significantly different than the wild-type UUU (P < 0.0001) except UUA and AUU (P = 0.8991 andP = 0.0551, respectively) (Dunnett’s corrected).
Figure 2.
Figure 2.
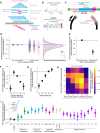
Machine learning on variant libraries guides novel predictors of msDNA production. (A) Machine learning algorithm performance on training set of ncRNA variants fromE. coli. Input is ncRNA sequence and output is inverse-normalized variant msDNA production. Each open circle represents an individual ncRNA sequence. Linear regressionR andP-values of ML predicted activity versus observed activity annotated on the plot. (B) Machine learning algorithm performance on held-out test data. Each open circle represents and individual ncRNA sequence. Linear regressionR andP-values of ML predicted activity versus observed activity annotated on the plot. (C) Predicted (blue, left set of paired points) and experimentally determined (purple, right set of paired points) msDNA production of varying GC percentages in stem P4. Open circles represent means of two biological replicates of individual ncRNA variants and closed circles represent the mean of all ncRNA variants tested for that GC percentage. Linear regression slope of the predicted (blue) points has a slope of −0.0156 and aP-value of < 0.0001. Linear regression slope of the observed (purple) points has a slope of −3.7995 and aP-value = 0.0069.
Figure 3.
Figure 3.
Precise editing of Retron-Eco1 editing variant libraries inS. cerevisiae. (A) HDR donor variant schematics and gRNA variants, with five donor lengths, two donor directions relative to the gRNA and five donor centers relative to edit and cut position for a total of 50 donors per editing site. There are five evenly spaced gRNAs per site relative to the edit position, for 250 donor/gRNA pairs per site. (B) There are 25 ncRNA chassis per donor/gRNA combination. Three sites integrated into the HIS locus of the yeast genome were tested: two synthesized and one from the human genome (NPAS2 locus). (C) Schematic for 4275 variant plasmids per site in the library. Each variant has a unique 10-bp barcode that can be read out from the plasmid or from the edit site in the genome. (D) All target-strand-homologous gRNA/donor variants’ barcode representation normalized against its non-target strand homologous gRNA/donor variant, with all other variables held constant (chassis, donor length, center and gRNA). The variants for each site are broken apart from one another and plotted in different colors, and each biological replicate of a site is summarized by the median (left panel) of the distribution of variants (right panel). (E) Data in Figure 3E summarized as the mean of all sites and all biological replicates (closed circle) (±standard deviation), with target-strand-homologous donors editing at significantly lower frequencies (one-samplet-test;P < 0.0001). (F) Barcode representation of cut sites normalized to the cut site at the barcode insertion site (±standard deviation), with cut sites at −16, +8 and +16 editing at significantly lower frequencies (one-samplet-test, Bonferroni correction for multiple comparisons;P < 0.0001,P < 0.0001 andP < 0.0001, respectively, all other comparisons non-significant). (G) Barcode representation of donor lengths normalized to 94 nucleotide donor length (±standard deviation), with donor lengths <94 nucleotides editing at significantly lower frequencies (one-samplet-test, Bonferroni correction for multiple comparisons;P < 0.0001,P < 0.0001 andP < 0.01, respectively, all other comparisons non-significant). (H) Heat map of normalized barcode representation of cut site versus donor center (94 nucleotide donor length), normalized to the cut site at the barcode insertion site and donor center of 5 bp upstream the barcode insertion site. Cut site and donor center interact significantly (two-way ANOVA;P-value of interaction <0.0001). (I) Barcode representation of all chassis ncRNA normalized to the CRISPEY ncRNA (±standard deviation) chassis with a1/a2 27-bp length, 10-bp and 12-bp P4 length, deletion at position 139, substitutions at C144T and T147A and ML chassis 8 and 9 all edit at significantly higher frequencies (one-samplet-test, Bonferroni correction for multiple comparisons;P = 0.004,P = 0.028,P = 0.036,P = 0.019,P = 0.049,P = 0.019,P = 0.024 andP = 0.009, respectively).
Figure 4.
Figure 4.
Validating yeast editing libraries with individual human variants. (A) Human editing schematic. HEK293T cells were transfected with a plasmid containing the editing ncRNA variant with a single nucleotide transversion as a precise edit, along with recoding the PAM NGG to NAT. The plasmid also contained a constitutively driven GFP-P2A-Eco1 RT. The editron targeted an intronic region of the NPAS2 gene on Chromosome 2 (‘site 3’ in the yeast data in Figure 3). The HEK293T line also had semi-randomly integratedS. pyogenes Cas9 by PiggyBac transposase under a dox-inducible promoter and a C-terminal NLS. Seventy-two hours after transfection, the HEK293T cells were sorted as GFP+/DAPI− (alive transfected cells) and their genomes were sequenced for precise edits. (B) Indel percent of the three tested gRNAs. Individual biological replicates are open circles. All gRNA indel rates are statistically different from one another (one-way ANOVA,P < 0.0001; Bonferroniposthoc test showedP < 0.05 for all comparisons). (C) Precise editing percentages of 52 nucleotide and 112 nucleotide long donors. Individual biological replicates are open circles. The 112 nucleotide donor is a significantly more efficient editor (pairedt-test,P = 0.025). (D) Precise editing percentages of target and non-target strand homologous donors. Individual biological replicates are open circles. Non-target strand homologous donors are significantly more efficient editors (pairedt-test,P = 0.043). (E) Precise editing percentages of four ncRNA chassis: wild-type Eco1 ncRNA, extended P1 (a1/a2) (23 and 27 bp) and machine learning chassis 9. Individual biological replicates are open circles. There is a significant effect of ncRNA chassis (one-way ANOVA,P = 0.01), with a1/a2 extensions of 23 (P = 0.0267) and 27 bp (P = 0.0046) performing significantly better than wild-type and ML chassis 9 not performing worse than wild-type (P = 0.0993) (Dunnett’s corrected). (F) Schematic of donor center relative to precise edit site and cut site. Three precise edits were spaced 20-bp apart, with the cut site centered on the middle edit. Three different donor positions were used per edit: 5′-sided, centered and 3′-sided. (G) Precise editing percentages of the nine different donor center/edit combinations. Three datapoints in the central cut/centered donor are repeated from (D), as these replicates served as the controls for both the donor center/cut site experiment and the target strand experiment. There is a significant effect of edit site and donor symmetry (one-way ANOVA,P = 0.0002), with all edits on the PAM-distal side of the cut (P = 0.0014 for 5′ donor center,P = 0.0012 for centered donor andP = 0.0016 for 3′ centered donor) and the 3′ donor center on the PAM-proximal side (P = 0.0009) performing significantly worse than a central cut and edit (Dunnett’s corrected). (H) Schematic illustrating final recommendations for editron design.
See this image and copyright information in PMC

Update of

Similar articles

See all similar articles

References

    1. Millman A., Bernheim A., Stokar-Avihail A., Fedorenko T., Voichek M., Leavitt A., Oppenheimer-Shaanan Y., Sorek R.. Bacterial retrons function in anti-phage defense. Cell. 2020; 183:1551–1561. - PubMed
    1. Bobonis J., Mitosch K., Mateus A., Karcher N., Kritikos G., Selkrig J., Zietek M., Monzon V., Pfalz B., Garcia-SantamarinaS.et al. .. Bacterial retrons encode phage-defending tripartite toxin–antitoxin systems. Nature. 2022; 609:144–150. - PubMed
    1. Gao L. Diverse enzymatic activities mediate antiviral immunity in prokaryotes. Science. 2020; 369:1077–1084. - PMC - PubMed
    1. Palka C., Fishman C.B., Bhattarai-Kline S., Myers S.A., Shipman S.L.. Retron reverse transcriptase termination and phage defense are dependent on host RNase H1. Nucleic Acids Res. 2022; 50:3490–3504. - PMC - PubMed
    1. Carabias A., Camara-Wilpert S., Mestre M.R., Lopéz-Méndez B., Hendriks I.A., Zhao R., Pape T., Fuglsang A., Luk S.H.-C., NielsenM.L.et al. .. Retron-Eco1 assembles NAD+-hydrolyzing filaments that provide immunity against bacteriophages. Mol. Cell. 2024; 84:2185–2202. - PubMed

MeSH terms

Substances

Related information

Grants and funding

LinkOut - more resources

Full text links
Silverchair Information Systems full text link Silverchair Information Systems Free PMC article
Cite
Send To

NCBI Literature Resources

MeSHPMCBookshelfDisclaimer

The PubMed wordmark and PubMed logo are registered trademarks of the U.S. Department of Health and Human Services (HHS). Unauthorized use of these marks is strictly prohibited.


[8]ページ先頭

©2009-2025 Movatter.jp