Movatterモバイル変換


[0]ホーム

URL:


Skip to main page content
U.S. flag

An official website of the United States government

Dot gov

The .gov means it’s official.
Federal government websites often end in .gov or .mil. Before sharing sensitive information, make sure you’re on a federal government site.

Https

The site is secure.
Thehttps:// ensures that you are connecting to the official website and that any information you provide is encrypted and transmitted securely.

NIH NLM Logo
Log inShow account info
Access keysNCBI HomepageMyNCBI HomepageMain ContentMain Navigation
pubmed logo
Advanced Clipboard
User Guide

Full text links

Free PMC article
Full text links

Actions

Share

Review
.2024 Oct 11;6(5):fcae362.
doi: 10.1093/braincomms/fcae362. eCollection 2024.

Brain state identification and neuromodulation to promote recovery of consciousness

Affiliations
Review

Brain state identification and neuromodulation to promote recovery of consciousness

Glenn J M van der Lande et al. Brain Commun..

Abstract

Experimental and clinical studies of consciousness identify brain states (i.e. quasi-stable functional cerebral organization) in a non-systematic manner and largely independent of the research into brain state modulation. In this narrative review, we synthesize advances in the identification of brain states associated with consciousness in animal models and physiological (sleep), pharmacological (anaesthesia) and pathological (disorders of consciousness) states of altered consciousness in humans. We show that in reduced consciousness the frequencies in which the brain operates are slowed down and that the pattern of functional communication is sparser, less efficient, and less complex. The results also highlight damaged resting-state networks, in particular the default mode network, decreased connectivity in long-range connections and especially in the thalamocortical loops. Next, we show that therapeutic approaches to treat disorders of consciousness, through pharmacology (e.g. amantadine, zolpidem), and (non-) invasive brain stimulation (e.g. transcranial direct current stimulation, deep brain stimulation) have shown partial effectiveness in promoting consciousness recovery. Although some features of conscious brain states may improve in response to neuromodulation, targeting often remains non-specific and does not always lead to (behavioural) improvements. The fields of brain state identification and neuromodulation of brain states in relation to consciousness are showing fascinating developments that, when integrated, might propel the development of new and better-targeted techniques for disorders of consciousness. We here propose a therapeutic framework for the identification and modulation of brain states to facilitate the interaction between the two fields. We propose that brain states should be identified in a predictive setting, followed by theoretical and empirical testing (i.e. in animal models, under anaesthesia and in patients with a disorder of consciousness) of neuromodulation techniques to promote consciousness in line with such predictions. This framework further helps to identify where challenges and opportunities lay for the maturation of brain state research in the context of states of consciousness. It will become apparent that one angle of opportunity is provided through the addition of computational modelling. Finally, it aids in recognizing possibilities and obstacles for the clinical translation of these diagnostic techniques and neuromodulation treatment options across both the multimodal and multi-species approaches outlined throughout the review.

Keywords: (disorders of) consciousness; anaesthesia; animal models; brain states; neuromodulation.

© The Author(s) 2024. Published by Oxford University Press on behalf of the Guarantors of Brain.


Conflict of interest statement

The authors report no conflicts of interest.

Figures

Graphical abstract
Graphical abstract
Figure 1
Figure 1
The arousal-awareness axes of consciousness and examples of metabolic and functional connectivity in patients with disorders of consciousness. (A) Graphical depiction of states of consciousness alongside the dimensions of arousal and awareness including healthy awake consciousness, different states of sleep (light, deep, REM), a scale from sedation to anaesthesia, and the DoC states of the minimally conscious state (MCS), the unresponsive wakefulness syndrome (UWS) and Cognitive Motor Dissociation (CMD). Note that these states exist on continuous scales. (B) Transversal view of the standardized uptake value of the brain collected with glucose positron emission tomography (fluorodeoxyglucose/FDG-PET) (see the study by Thibautet al. for details about data processing). The glucose uptake values range from 1 to 12 where higher values are associated with more glucose consumption, as observed in a healthy brain. (C) Scalp mesh with electroencephalogram (EEG) electrode locations indicated as black dots. Lines between electrodes depict the connectivity between functionally connected electrodes. Functional connectivity was determined by the weighted phase lag index on preprocessed data (see the study by Thibautet al. for details about the pre-processing). For clarity, the top 5 strongest outgoing connections per electrode are shown. Strength of the connection is represented by the height of the line (i.e. weak connections are low and yellow, and strong connections are high and red). Access to interactive figures that allow for deeper investigation into the concepts illustrated here can be found in the Supplementary material.
Figure 2
Figure 2
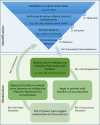
Therapeutic framework for identification and modulation of brain states. The framework consists of two parts: Identification and Modulation part that interact and support each other. Within each part, several levels of approaches can be distinguished, all of which are important for brain state research. From the top, the research focusing on brain state identification can utilize and develop techniques, such as electroencephalography (EEG) and magnetic resonance imaging (MRI), to capture the brain state, which can then be applied in various altered states of consciousness, such as disorders of consciousness (DoC) (I1), from which features can be extracted (I2), that can be evaluated on the relevancy for consciousness (I3). In the bottom part, modulation techniques, such as transcranial direct current stimulation (tDCS) and deep brain stimulation (DBS), can be identified to modulate these features, which could then be applied in patient populations (M1), where alterations in (c)overt signs of consciousness could be evaluated (M2), followed by an investigation on the whole-brain dynamics to examine brain state changes (M3). These two sides of the field are linked where successful manipulation of a feature, associated with amelioration of consciousness, could confirm its relevance as a feature of consciousness (M > I), and the other way around, relevant features could drive the direction of the neuromodulation field empirically (I > M). This framework is flexible enough to accommodate a variety of approaches and data types, but also provides enough structure to ensure consistency and rigour spanning from single unit recordings to whole-brain recordings in different levels of consciousness. It is adaptable to new discoveries and technologies as they emerge in various fields.
Figure 3
Figure 3
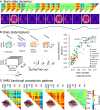
Methods for identification and characterization of brain state dynamics illustrated through fMRI connectivity patterns. (A) Illustration of the multi-modal dynamics of brain states showing how they can change with different timescales, while also displaying recurrences in a repertoire. The top shows an illustration of how brain states can be quantified (e.g. from bottom to top: through oscillatory EEG of fMRI activity, glucose metabolism or functional connectivity between regions) and how brain states fluctuate over time. For illustrator purposes, data was taken from 1B and 3C, but illustrated dynamics are purely illustrator and not based on real data.(B) The wide range of features that can be used to describe brain states (adapted from the study by Engemannet al.). The left figure displays these features in different categories, showing which dimensions they take into account, i.e. samples, time, area, frequency (freq.), sensors (sens.), and various ways to summarize them (e.g. mean, standard deviation (std)). The right figure shows how this was applied to EEG data, with the plentitude of features now ordered based on their importance in predicting if a DoC patient is fully unaware (UWS) or has residual awareness (MCS) (see for details). This ordering was done based on the cross-validated area under the curve (AUC). This illustrates that multifaceted investigation is important, alongside the need for the selection of the most relevant features for the differentiation between brain states and parallel behavioural state.(C) Patterns of functional connectivity that occur in a quasi-stable manner and alternate dynamically could be considered brain states. Functional connectivity is defined between areas in the auditory network (Aud), default mode network (DMN), fronto-parietal network (FP), motor network (Mot), salience network (Sal), and visual network (Vis) defined as 10-mm-diameter spheres around peak coordinates selected from the literature. The top part shows 4 recurring patterns or brain states (for details on their extraction, see the study by Demertziet al.). The bottom shows a representation of the functional connectivity between brain regions for each of these brain states. Positive connections are shown in red and negative ones in blue. The 5% strongest connections are presented. Access to interactive figures that allow for deeper investigation into the concepts illustrated here can be found in the Supplementary material.
Figure 4
Figure 4
Possible treatments tested for the therapy of patients with disorders of consciousness and their effect on the mesocircuit. Pathways of weakened excitation (green, solid) and excessive (purple, solid; only between globus pallidus and central thalamus) or loss (purple, dashed) of inhibition that characterize patients with a DoC are shown in the mesocircuit model. From the top right, going clock-wise is shown: the serotonin system that is affected by psilocybin and acts cortically; central stimulation through deep brain stimulation (DBS) acts mostly on the thalamus; low-intensity focused ultrasound also affects the thalamus; vagal nerve stimulation stimulates the brainstem by nerve stimulation (latter three are bottom-up processes); the gamma-aminobutyric acid (GABA)ergic drug zolpidem targets the globus pallidus; dopaminergic drugs amantadine and apomorphine act on the striatum, while the former also affects the frontal cortex; repetitive transcranial magnetic stimulation (rTMS) and transcranial direct current stimulation (tDCS) act cortically and stimulate activity in a top-down fashion. Figure adapted from .
Figure 5
Figure 5
Pharmacological neuromodulation-induced consciousness state changes in animal models. (A, B) Optogenetic activation of basal forebrain (BF) cholinergic neurones desynchronize cortical activity in awake mice. Light activation of basal forebrain cholinergic neurones reliably desynchronized cortical activity by reducing the power at low frequencies (1–5 Hz) and increasing the power at high frequencies (60–100 Hz).(A) Schematic illustration of experimental setup (left) and fluorescence microscopy image of basal forebrain cholinergic cells expressing channelrhodopsin-2 and enhanced yellow fluorescent protein. Asterisk indicates the position of optic fibre; arrowheads indicate the posterolateral and anteromedial borders of basal forebrain(B) Three example local field potential (LFP) traces show the effect of basal forebrain stimulation (blue bar; average of all experiments in the right panel). Figure modified from the study by Pintoet al.(C–F) Control of brain state transitions with a photo-switchable muscarinic agonist (Phthalimide-Azo-Iper (PAI))in vitro andin vivo, and the effect on the brain network is studied. Physiological synchronous emergent cortical activity consisting of slow oscillations is transformed into a higher frequency pattern in the cerebral cortex, bothin vitro andin vivo, as a consequence of PAI activation with white light (WL).(C) Chemical structures of trans- and cis-PAI photoisomers are shown. The molecule changes with light its capacity to bind to and/or activate proteins associated with neural signalling, reversibly switching from the straight trans configuration in the dark or under visible light, to the bent cis configuration when UV light is applied.(D) Photocontrol of brain wavesin vitro using PAI and direct illumination with white light. Representative LFP traces (top), raster plots of firing rate during the Up-states (middle) and spectrograms (bottom) under control conditions,cis-PAI andtrans-PAI after photoconversion with white light (WL). Colour scales are in arbitrary units (a.u.).(E)In vivo photomodulation of brain waves. Representative raw traces of LFP (top, in millivolt (mV)) and multiunit activity (bottom, in arbitrary units (a.u.)), showing the differences in oscillatory frequency and firing rate during the Up-states between the control,cis-PAI, andtrans-PAI after photoswitching with WL.(F, G) Changes in oscillatory frequencyin vitro (F; mean ± SEM are reported fromn = 17 ferret slices, one-way ANOVAs, with Welch test for pairwise comparisons, ** =P < 0.01, *** =P < 0.001) andin vivoG; mean ± SEM are reported fromn = 8 mice, one-way repeated-measures ANOVAs, with Fisher’s LSD for pairwise comparisons, * =P < 0.05) by PAI photoisomerization. Comparison of the different conditions analysed in this study: control,cis-PAI andtrans-PAI. Figures C–F have been adapted from the study Barbero-Castilloet al. Access to interactive figures that allow for deeper investigation into the concepts illustrated here can be found in the Supplementary material.
Figure 6
Figure 6
Neurophysiological effects of tDCS over the dorsolateral prefrontal cortex in a patient in the minimally conscious state. EEG data evoked by a transcranial magnetic stimulation (TMS; −800 ms before to 800 ms after, on eachx-axis) before and after transcranial direct current stimulation (tDCS) treatment (see the study by Mensenet al. for experimental details). The top left figure shows the event-related spectral perturbation (ERSP; frequency on they-axis, colour indicating increasing power blue->red) pre-treatment while the right figure shows the ERSP post-treatment. A marked decrease in the slow wave induced by the TMS pulse can be observed. The top middle figure displays the electrode configuration, with a red dot indicating the electrode for which the responses are displayed. The bottom figures show the pre-treatment (red) and post-treatment (blue) amplitude response (y-axis) for both the broadband and the filtered (2–6 Hz) signals on the left and right, respectively. Lines display mean responses over all TMS trials, shaded area shows standard deviation. These figures are from a single subject (n = 1) to illustrate that all individuals showed significant differences between pre- and post-tDCS treatment (statistics not reported, but clear from standard deviations). Despite the changes in brain state as a result of this tDCS treatment there seems to be an absence of behavioural effects. Access to interactive figures that allow for deeper investigation into the concepts illustrated here can be found in the Supplementary material.
Figure 7
Figure 7
Electrical-induced state changes to promote consciousness in animals and humans by means of thalamic stimulation. Consciousness depends on large-scale thalamocortical and corticocortical interactions. Many studies support non-specific thalamic nuclei (intralaminar nuclei) as critical structures.(A-B) Thalamic electrical stimulation in central thalamus arouses monkeys (adapted from the study by Bastoset al.).(A) The histological images, using an acetylcholinerase staining, show the thalamic stimulation leads in the central thalamus.(B) The effects of thalamic electrical stimulation on cortical state in monkeys are shown by an example of the behavioural wake-up score as a function of thalamic current (left) and the mean firing rates with respect to electrical stimulation onset and offset across all cortical areas (right).(C-D) Central–lateral thalamic stimulation arouses macaques from stable anaesthesia (adapted from the study by Redinbaughet al.).(C) Stimulation sites (n = 90) in one subject collapsed along the anteroposterior axis are shown in the image. Circles represent the middle contact in the stimulation array, diameter scales with induced arousal.(D) An example of the behavioural and neural recordings during 50-Hz stimulation is shown in the left panel. The population mean arousal score pre, during (stim) and post stimulations is represented in the right panel. Using linear mixed effect models over all stimulations (n = 261) pre significantly differed from during the stimulation (F = 119.28, * =P < 0.001) and during stimulation significantly differed from post (F = 124.64, * =P < 0.001). Other abbreviations: MD, mediodorsal thalamic nuclei; LD, laterodorsal thalamic nuclei; LP, lateral posterior thalamic nuclei; VPL, ventral posterolateral thalamic nuclei; EMG, electromyography; FEF, right frontal eye field area; LIP, lateral intraparietal area; S, superficial layers; M, medium layers; D, deep layers.(E–F) The electrical stimulation of different intralaminar nuclei has been demonstrated to restore consciousness in patients with disorders of consciousness.(E) Example of deep brain stimulation (DBS) for treatment of a patient with the unresponsive wakefulness syndrome. The stimulating electrode was implanted for stimulation of the CM-PF. Computerized tomography (upper) and radiography (lower) show the trajectory and location of DBS electrode (adapted from the study by Yamamotoet al.).(F) Bilateral DBS of the central thalamus modulates behavioural responsiveness in a patient who remained in minimally conscious state for 6 years following traumatic brain injury before the intervention. Comparison of pre-surgical baselines of achieving the maximal obtained behavioural score with this same metric with DBS on and DBS off periods during the cross-over phase (adapted from the study by Schiffet al.). Evaluated using two-tailed Pearson chi-square tests, where * =P < 0.001, Significant differences can be found between DBS-on and DBS-off for CRS-R arousal scores as well as limb control and oral feeding, all of which are better with DBS on.
See this image and copyright information in PMC

Similar articles

See all similar articles

References

    1. Nagel T. What is it like to be a bat ? Philos Rev. 1974;83:435–450.
    1. Deco G, Cruzat J, Cabral J, et al. . Awakening: Predicting external stimulation to force transitions between different brain states. Proc Natl Acad Sci U S A. 2019;116(36):18088–18097. - PMC - PubMed
    1. Demertzi A, Tagliazucchi E, Dehaene S, et al. . Human consciousness is supported by dynamic complex patterns of brain signal coordination. Sci Adv. 2019;5:eaat7603. - PMC - PubMed
    1. Mensen A, Bodart O, Thibaut A, et al. . Decreased evoked slow-activity after tDCS in disorders of consciousness. Front Syst Neurosci. 2020;14:62. - PMC - PubMed
    1. Thibaut A, Panda R, Annen J, et al. . Preservation of brain activity in unresponsive patients identifies MCS star. Ann Neurol. 2021;90(1):89–100. - PMC - PubMed

Publication types

Related information

LinkOut - more resources

Full text links
Free PMC article
Cite
Send To

NCBI Literature Resources

MeSHPMCBookshelfDisclaimer

The PubMed wordmark and PubMed logo are registered trademarks of the U.S. Department of Health and Human Services (HHS). Unauthorized use of these marks is strictly prohibited.


[8]ページ先頭

©2009-2025 Movatter.jp