Movatterモバイル変換


[0]ホーム

URL:


Skip to main page content
U.S. flag

An official website of the United States government

Dot gov

The .gov means it’s official.
Federal government websites often end in .gov or .mil. Before sharing sensitive information, make sure you’re on a federal government site.

Https

The site is secure.
Thehttps:// ensures that you are connecting to the official website and that any information you provide is encrypted and transmitted securely.

NIH NLM Logo
Log inShow account info
Access keysNCBI HomepageMyNCBI HomepageMain ContentMain Navigation
pubmed logo
Advanced Clipboard
User Guide

Full text links

Nature Publishing Group full text link Nature Publishing Group Free PMC article
Full text links

Actions

Share

.2024 Apr 30;14(1):9946.
doi: 10.1038/s41598-024-60467-y.

Role of volcanism and impact heating in mass extinction climate shifts

Affiliations

Role of volcanism and impact heating in mass extinction climate shifts

Kunio Kaiho. Sci Rep..

Abstract

This study investigates the mechanisms underlying the varied climate changes witnessed during mass extinctions in the Phanerozoic Eon. Climate shifts during mass extinctions have manifested as either predominant global cooling or predominant warming, yet the causes behind these occurrences remain unclear. We emphasize the significance of sedimentary rock temperature in comprehending these climate shifts. Our research reveals that low-temperature heating of sulfide leads to global cooling through the release of sulfur dioxide (SO2), while intermediate-temperature heating of hydrocarbons and carbonates releases substantial carbon dioxide (CO2), contributing to global warming. High-temperature heating additionally generates SO2 from sulfate, further contributing to global cooling. Different degrees of contact heating of the host rock can lead to different dominant volatile gas emissions, crucially driving either warming or cooling. Moreover, medium to high-temperature shock-heating resulting from asteroid impacts produces soot from hydrocarbons, also contributing to global cooling. Large-scale volcanic activity and asteroid impacts are both events that heat rocks, emitting the same gases and particles, causing climate changes. The findings elucidate the critical role of heating temperature and heating time in understanding major climate changes during mass extinctions.

Keywords: Asteroid impact; Climate variations; Emitted gases; Heating temperature; Mass extinction; Volcanic activity.

© 2024. The Author(s).


Conflict of interest statement

The author declares no competing interests.

Figures
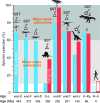
Figure 1
Figure 1
Percentages of species extinction in marine animals and tetrapods during major and minor mass extinctions. Blue columns indicate extinction values for marine species, while red columns represent extinction values for terrestrial species. Open histograms in H–A depict species extinction percentages for 2060–2080 CE. The abbreviations O, F, D, G–L, P, T, J, K–Pg, and H–A correspond to the following time periods: Ordovician, Frasnian, Devonian, Guadalupian–Lopingian transition, Permian, Triassic, Jurassic, Cretaceous–Paleogene boundary, Holocene–Anthropocene. These extinction percentage data are directly comparable due to the use of similar methods, including the conventional method and substage intervals. The numbers 1 to 5 denote the five major mass extinctions. Each silhouette represents a representative vertebrate animal from the respective age. The end-Jurassic mass extinction event is associated with the Morokweng impact crater formation in South Africa. SST: presence of SST data.
Figure 2
Figure 2
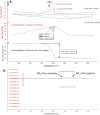
Temperature-dependent release of CO2 and SO2 gases from organic carbon-rich limestone containing 1 wt% sulfate (gypsum and anhydrite). (a) Temperature profiles illustrating the release of CO2 gas from organic carbon-rich limestone. (b) Temperature profiles illustrating the release of SO2 gas from samples containing 1 wt% gypsum (sulfate) and 1 wt% artificial anhydrite (sulfate). The curve labeled 44 amu represents the temperature for CO2 release, while the curve labeled 64 amu (b) corresponds to the temperature for SO2 release from gypsum and anhydrite. The molar ratio of SO2/g gypsum or anhydrite to CO2/g limestone is 4%, which corresponds to a weight ratio of 6%.
Figure 3
Figure 3
Temperature-dependent release of soot from sedimentary rocks, substantiated by compelling evidence. Temperature profiles illustrate the release of soot from organic carbon-rich limestone (a,b) and organic carbon-rich black shale (c). Refer to the “Methods” section for detailed information on samples and methodologies. During heating in panel (a) at 1050 °C and 1100 °C, the limestone powder underwent partial melting, indicating the conversion of CO2 to CO and O2, accompanied by the decomposition of soot. Importantly, this reaction is improbable in an open system. An examination of the Raman spectrum of a black material found on the inner wall of the ampoule confirmed its composition as soot (d). The outer diameter of the ampoules in panels (a,b) and panel (c) is 25 mm and 30 mm, respectively.
Figure 4
Figure 4
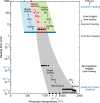
The temperature and heating durations required for the production of SO2, CO2, and soot were determined by integrating data from Figs. 2 and 3, along with findings from published papers. The figure illustrates the formation processes of various gases: SO2 from sulfide (based on Wang et al. using high-sulfur coal, with pyrolysis experiments conducted for 15 min at a rate of approximately 30 °C per minute, and Kaiho et al. using a heating rate of 8 °C per minute up to 1100 °C), CO2 from hydrocarbon and carbonate (derived from Kaiho et al. and the present study), SO2 from sulfate (from the present study), and soot from hydrocarbon (based on Krestinin et al. [isothermal pyrolysis of acetylene, benzene, and diacetylene], Yoshihara et al. under a shock-heated condition, He et al. under 2 and 4 atm shock temperature and pressure, model calculation of Chen et al., and the present study). The data points are represented by red and right-side blue bars, and black dots for 1-min heating, all obtained from the present study. The term “Low oxygen” corresponds to a pressure of 2 × 10–4 Pa. The colored areas on both sides of the frame, which encompass the data plots, represent the fitting of the experimental data to the Arrhenius equation. The Arrhenius equation elucidates the relationship between production temperature and heating time. The presence of experimental data points within these colored areas indicates how well they conform to the predicted behavior based on the Arrhenius equation. The production temperature on the horizontal axis indicates the heating temperature in each experiment.
Figure 5
Figure 5
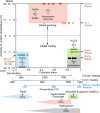
The three classifications of mass extinctions depicted in the upper part of this figure are based on surface temperature anomaly and the Coronene index (a sedimentary rock heating temperature index). The lower part of the figure illustrates the heating temperature based on experimental data and the major emission gases/particles influencing climate change. The colored vertical bars in the upper figure indicate the average values of the Coronene index for each mass extinction. Abbreviations and colors represent different events: End-F (end-Frasnian): green dots, G–L (Guadalupian–Lopingian transition): orange dots, End-P (end-Permian): red dots, End-T (end-Triassic): blue dots, and K–Pg (Cretaceous–Paleogene boundary): black dots. Specific emission gases in the lower figure, such as SO2, CO2, or soot, are determined by the heating temperature. The relationship between the three temperature scales connecting the upper and lower figures is based on the Arrhenius equation. The upper temperature scale indicates the instantaneous heating temperature, such as that resulting from impact and experiments on the formation of PAHs, including coronene. While the temperature at the impact point exceeds 10,000 °C, the heating temperature decreases to a few hundred degrees moving from the center of the crater outward. The middle temperature scale represents the temperature during 5 min of heating based on Kaiho et al. and experimental data from this paper. The bottom temperature scale represents the temperature heated by sill according to Aarnes et al., lasting for 100 years.
Figure 6
Figure 6
Relationship between heating temperature, global surface temperature anomaly, and extinction percentages. The color flames indicate the causes and outcomes of extinctions during specific periods: O: Ordovician, end-F: end-Frasnian, G: Guadalupian, P: Permian, T: Triassic, K–Pg: Cretaceous–Paleogene boundary, H–A: Holocene-Anthropocene. Toba: Toba volcanic eruption 74,000 years ago. Samals: Samals volcanic eruption in 1258 CE. Blue circles represent marine extinctions, while red squares indicate terrestrial extinctions, represented by tetrapods. In H–A, eight dots are from Kaiho, with the six open dots representing projections for the near future (2060–2080 CE). Soot amount and surface temperature anomaly at the end-Jurassic were calculated and obtained using Figure 5 of Kaiho and Oshima. Species extinction percentages for 2060–2080 CE are estimated based on 16 cases of global warming, environmental pollution, and forest devastation as causes. The production temperature scale aligns with that in Fig. 5.
See this image and copyright information in PMC

Similar articles

See all similar articles

References

    1. Svensen H, et al. Siberian gas venting and the end-Permian environmental crisis. Earth Planet. Sci. Lett. 2009;277:490–500. doi: 10.1016/j.epsl.2008.11.015. - DOI
    1. Bond DPG, Grasby SE. On the causes of mass extinctions. Palaeogeogr. Plaeoclimatol. Palaeoecol. 2017;478:3–29. doi: 10.1016/j.palaeo.2016.11.005. - DOI
    1. Rampino MR, Caldeira K, Prokoph A. What causes mass extinctions? Large asteroid/comet impacts, flood-basalt volcanism, and ocean anoxia—Correlations and cycles. Geol. Soc. Am. Spec. Pap. 2019;542:271–302.
    1. Kaiho K. Relationship between extinction magnitude and climate change during major marine and terrestrial animal crises. Biogeosciences. 2022;19:3369–3380. doi: 10.5194/bg-19-3369-2022. - DOI
    1. Burgess SD, Muirhead JD, Bowring SA. Initial pulse of Siberian Traps sills as the trigger of the end-Permian mass extinction. Nat. Commun. 2017;8:164. doi: 10.1038/s41467-017-00083-9. - DOI - PMC - PubMed

Related information

Grants and funding

LinkOut - more resources

Full text links
Nature Publishing Group full text link Nature Publishing Group Free PMC article
Cite
Send To

NCBI Literature Resources

MeSHPMCBookshelfDisclaimer

The PubMed wordmark and PubMed logo are registered trademarks of the U.S. Department of Health and Human Services (HHS). Unauthorized use of these marks is strictly prohibited.


[8]ページ先頭

©2009-2025 Movatter.jp