Movatterモバイル変換


[0]ホーム

URL:


Skip to main page content
U.S. flag

An official website of the United States government

Dot gov

The .gov means it’s official.
Federal government websites often end in .gov or .mil. Before sharing sensitive information, make sure you’re on a federal government site.

Https

The site is secure.
Thehttps:// ensures that you are connecting to the official website and that any information you provide is encrypted and transmitted securely.

NIH NLM Logo
Log inShow account info
Access keysNCBI HomepageMyNCBI HomepageMain ContentMain Navigation
pubmed logo
Advanced Clipboard
User Guide

Full text links

Nature Publishing Group full text link Nature Publishing Group Free PMC article
Full text links

Actions

Share

.2024 Apr 1;15(1):2809.
doi: 10.1038/s41467-024-47107-9.

Loss-of-function mutation in PRMT9 causes abnormal synapse development by dysregulation of RNA alternative splicing

Affiliations

Loss-of-function mutation in PRMT9 causes abnormal synapse development by dysregulation of RNA alternative splicing

Lei Shen et al. Nat Commun..

Abstract

Protein arginine methyltransferase 9 (PRMT9) is a recently identified member of the PRMT family, yet its biological function remains largely unknown. Here, by characterizing an intellectual disability associated PRMT9 mutation (G189R) and establishing a Prmt9 conditional knockout (cKO) mouse model, we uncover an important function of PRMT9 in neuronal development. The G189R mutation abolishes PRMT9 methyltransferase activity and reduces its protein stability. Knockout of Prmt9 in hippocampal neurons causes alternative splicing of ~1900 genes, which likely accounts for the aberrant synapse development and impaired learning and memory in the Prmt9 cKO mice. Mechanistically, we discover a methylation-sensitive protein-RNA interaction between the arginine 508 (R508) of the splicing factor 3B subunit 2 (SF3B2), the site that is exclusively methylated by PRMT9, and the pre-mRNA anchoring site, a cis-regulatory element that is critical for RNA splicing. Additionally, using human and mouse cell lines, as well as an SF3B2 arginine methylation-deficient mouse model, we provide strong evidence that SF3B2 is the primary methylation substrate of PRMT9, thus highlighting the conserved function of the PRMT9/SF3B2 axis in regulating pre-mRNA splicing.

© 2024. The Author(s).


Conflict of interest statement

Y.X. is a scientific cofounder of Panorama Medicine. All other authors declare that they have no competing interests.

Figures

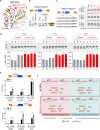
Fig. 1
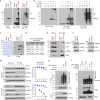
Fig. 1. The ID patient-associated PRMT9 G189R mutation abolishes its arginine methyltransferase activity.
a Domain structure of human PRMT9. The N-terminal TPR repeats are in blue, and the two tandem methyltransferase (MTase) domains are in purple. The ID-associated G189R mutation, which is located at the N-terminus of the first methyltransferase domain, is highlighted in red. G189 (red asterisk) is conserved in PRMT9 genes ranging from zebrafish to human.b G189R-mutant PRMT9 is catalytically inactive. In vitro methylation assay was performed by incubating WT, G189R-mutant, and catalytic-inactive (4A) recombinant PRMT9 enzymes with a fragment of SF3B2 (a.a. 400–550). 4A, catalytic-inactive PRMT9 mutant (VLDI to AAAA). n = 3; n is number of independent experiments unless otherwise stated.c G189R-mutant PRMT9 fails to interact with its methylation substrate SF3B2. A co-IP assay was performed to detect the interactions of Flag-tagged WT, G189R-mutant, and catalytic-inactive (4A) PRMT9 with the endogenous SF3B2 (n = 3).d G189R-mutant PRMT9 fails to restore SF3B2 arginine methylation (SF3B2 R508me2s) in PRMT9 KO cells. Western blot analysis was performed to detect SF3B2 R508 methylation level in WT and PRMT9 KO HeLa cells with rescue expression of Flag-tagged WT, G189R-mutant, and 4A-mutant PRMT9 (n = 3).e The G189R mutation does not affect the overall cytoplasmic localization of PRMT9, but G189R-mutant PRMT9 fails to catalyze SF3B2 arginine methylation, consistent with the results in (d). Immunofluorescence assay was performed to detect SF3B2 R508 methylation level (red) in WT and PRMT9 KO HeLa cells with rescue expression of Flag-tagged WT, G189R-mutant, and 4A-mutant PRMT9 (green). α-Flag demonstrates the subcellular localization of the Flag constructs (n = 3). Scale bar: 20 μm. Source data are provided as a Source Data file.
Fig. 2
Fig. 2. G189R-mutant PRMT9 is unstable and subject to ubiquitination by UBE3C.
a G189R-mutant PRMT9 protein is heavily ubiquitinated in cells. Flag-tagged WT or G189R-mutant PRMT9 were immunoprecipitated. Samples were detected by western blot using αFlag and αUb antibodies (n = 3).b Detection of PRMT9 ubiquitination using in vivo ubiquitination assay. HEK293T cells were transfected with Flag-tagged WT or G189R-mutant PRMT9 together with HA-tagged Ubiquitin and treated with the proteasome inhibitor MG132 before harvest (n = 3).c Purification of WT and G189R-mutant PRMT9 protein complex from HEK293 cells. The purified protein complex was visualized by Coomassie blue staining (left panel) and an αFlag western blot (right panel). n = 2.d Identification of PRMT9 protein complex by liquid chromatography–mass spectrometry (LC/MS) with two biological repeats (rep1 and rep 2). The number of unique peptides from individual proteins is listed. Known PRMT9 interaction proteins are labeled in black and novel interaction proteins are labeled in blue.e Validation of PRMT9 interaction proteins by co-immunoprecipitation. Flag-tagged WT or G189R-mutant PRMT9 were immunoprecipitated with an αFlag M2 magnetic beads, and the protein complexes were detected by western blot (n = 3).f UBE3C negatively regulates PRMT9 protein level. HeLa cells were transfected with UBE3C siRNA or Flag-tagged UBE3C to either knockdown or overexpress UBE3C (n = 3).g Knockdown UBE3C stabilizes PRMT9 protein. Protein stability of Flag-tagged WT or G189R-mutant PRMT9 was determined in control and UBE3C knockdown HeLa cells (left panel). PRMT9 western blot signal was quantified using ImageJ software (right panel). Data are presented as mean values ± SD. Error bars represent standard deviation calculated from three independent western blots.h UBE3C catalyzes PRMT9 ubiquitination in cells. In vivo ubiquitination assay was performed with GFP-tagged wild type (WT) and catalytic-deficient (C1051S) UBE3C (n = 3).i UBE3C catalyzes PRMT9 ubiquitination in vitro. In vitro ubiquitination assay was performed using indicated recombinant proteins (n = 3). * UBE3C auto-ubiquitination. Source data are provided as a Source Data file.
Fig. 3
Fig. 3.Prmt9 cKO mice show impaired learning and memory.
a Graphic illustration of Morris Water Maze test, with prominent ambient visual cues surrounding the test arena to facilitate associative learning.bPrmt9 cKO mice showed slower learning during the acquisition period. The y-axis shows the time taken to find the hidden platform during the eight training days. Data are presented as mean ± SEM. Main effect on groups,F (1,12) = 19.4,p = 0.0009. *p = 0.019, **p = 0.009, ***p < 0.001. Repeated measures two-way-ANOVA with Sidak’s multiple comparison test.c Representative mouse moving tracks and speed on Day 8 of training. Heatmap, time spent at location of arena; line graph, moving trajectory of mice. Marker color denotes swimming speed at the corresponding location.d Quantification of percent time spent in each quadrant during Day 8 of training.Prmt9 cKO mice spent significantly less time (p < 0.0001, unpairedt test) in the target quadrant (TQ). Data are presented as mean ± SEM.ePrmt9 cKO mice showed impaired memory. Prmt9 cKO mice spent significantly less time in the target quadrant during the probe trial (p = 0.0013, unpairedt test). Data are presented as mean ± SEM.fPrmt9 cKO mice showed slower learning of the new platform location during Day 10–12 reverse learning period. Data are presented as mean ± SEM.p = 0.008 for the effect of genotype, repeated measures two-way rmANOVA.gPrmt9 cKO mice spent less time in the new target quadrant during the Day 11 of the probe trial (p < 0.0001, unpairedt test). Data are presented as mean ± SEM. Two-way rmANOVA with Sidak’s MCT. For (ag), WT, n = 6 (4M2F); cKO, n = 6 (3M3F).h Schematic diagram of a Pavlovian fear conditioning paradigm. A different cohort of mice was used. WT, n = 6 (3M3F); cKO, n = 6 (2M4F). Day 1 had five training sessions in which a mild foot shock (US) was paired with an auditory cue (CS). On day 2, mice were placed in the same context with no US or CS stimulus presented. Freezing time was measured.iPrmt9 cKO mice showed decreased fear conditioning learning.Prmt9 cKO mice exhibited a significantly decreased freezing time and different time course in associating the unconditional (audio cue) stimulus with foot shock and freezing behavior compared with controls,p = 0.04, for the effects of genotype, repeated measures two-way ANOVA. Data are presented as mean ± SEM.jPrmt9 cKO mice show reduced contextual-induced freezing behavior (p = 0.005, unpairedt test). Data are presented as mean ± SEM. For (hj), WT, n = 6 (3M3F); cKO, n = 6 (2M4F).
Fig. 4
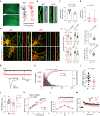
Fig. 4.Prmt9 cKO hippocampus neurons show impaired excitatory synapse development.
a Photomicrograph of CA1 hippocampus neurons and their representative dendritic arborization. Scale bar, 200 μm.b Representative apical dendritic segments with reconstructed dendritic spines. Scale bar, 10 μm.cPrmt9 cKO CA1 neurons (n = 11) showed reduced dendritic spine density compared to that from WT (n = 10) neurons (p = 0.0027, unpairedt test). Data are presented as mean ± SEM.dPrmt9 cKO mice showed reduced dendritic spine head volume/size in CA1 neurons (cKO, n = 141 spines/7 neurons; WT, n = 133 spines/8 neurons.p = 0.019, Kolmogorov-Smirnov test). Box plot indicates min, lower quartile Q1, median, upper quartile Q3 and max.e Representative co-labeling of synapse markers, including the glutamate receptor subunits (GluA1/GluN1) and the pre- and post-synaptic proteins (Synapsin I/PSD95) in WT control andPrmt9 cKO mice (n = 3). Scale bar, 20 μm.f Quantification of GluA1/GluN1 and Synapsin I/PSD95 puncta density and double labeling. CulturedPrmt9 cKO hippocampal neurons show reduced puncta density for GluN1 (p = 0.0003) and GluA1 (p = 0.002) compared to WT/control neurons (two-way ANOVA with Sidak’s MCT). In addition, cKO hippocampal neurons show reduced density for PSD95 puncta (p = 0.002). Reduced proportion of functional excitatory synapses, defined by the proportion of colocalized GluA1/GluN1 (p < 0.0001, n = 13 neurons for control and cKO) and Synapsin I/PSD95 (p < 0.0001, n = 14 neurons for control and cKO) was observed in cKO neurons as well. Box plot indicates min, lower quartile Q1, median, upper quartile Q3 and max.g Exemplary whole cell mEPSC traces from WT andPrmt9 cKO CA1 neurons.h Cumulative and percentage distribution of mEPSC amplitudes from WT control andPrmt9 cKO CA1 neurons. Prmt9 cKO neurons showed decreased mEPSC amplitude (p = 0.015, Kolmogorov–Smirnov test).iPrmt9 cKO CA1 neurons show reduced mEPSC frequency (WT, n = 16 neurons; cKO, 15 neurons.p = 0.004).jPrmt9 cKO CA1 neurons exhibit significantly smaller AMPA/NMDA current ratio (WT, n = 10 neurons; cKO, n = 11 neurons.p = 0.02). Data are presented as mean ± SEM.k Input–output responses in CA1 field potential recordings, measured by fEPSP slope as a function of fiber volley amplitude (WT, n = 9 slices; cKO, n = 8 slices.p = 0.003).l Paired pulse responses across 20–100 ms ISI as a measure of presynaptic function (WT, n = 10 slices; cKO, n = 10 slices.p = 0.46 for the effects of genotype).mPrmt9 cKO hippocampus CA1 show a significantly lowered LTP magnitude, measured as the last 10-min responses (WT, n = 10 slices; cKO, n = 10 slices.p < 0.0001 for the effects of genotype).
Fig. 5
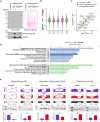
Fig. 5. PRMT9 regulates pre-mRNA splicing of genes involved in synapse development and function.
a SF3B2 is the primary substrate of PRMT9 in mouse hippocampus and it is highly methylated in vivo. PRMT9 only produces3H-labeled SF3B2 methylation signal in the KO, but not WT cells (black triangle). Samples were visualized by Ponceau staining (n = 3).b Violin plot demonstration of alternative splicing (AS) events identified inPrmt9 KO hippocampus. The middle line of the boxplot represents median value. The low and high ends of the box represent the 25% and 75% quantiles, respectively. The two whiskers extend to 1.5 times the interquartile range. The number of significant events within each category are indicated within parentheses along x-axis labels. WT: n = 3; KO: n = 3.c Scatter plot of gene expression levels in WT andPrmt9 KO hippocampus samples. Genes with significant changes in alternative splicing are depicted in yellow. Genes selected for RT-PCR validation of AS are highlighted in boxes.d Pathway enrichment analysis of alternatively spliced genes. Pathways were grouped by database resource origins (BioPlanet pathway or WikiPathway). The length of bars depicts the Benjamini-Hochberg adjustedp values calculated from a one-sided hypergeometric test. Odds ratio of the enrichment is indicated by bar opacity.e RT-PCR validation of alternatively spliced genes uponPrmt9 KO. RNA-seq read coverage across individual alternatively spliced exons in WT andPrmt9 KO samples is illustrated using the Sashimi plots. The number of reads mapped to each splice junction is shown. Percent Spliced In (PSI) values are indicated on the upper-right sides of the plots. RT-PCR was performed to validate selected alternative splicing events. Inclusion versus exclusion ratio was calculated. Data are presented as mean values ± SD. Error bars represent standard deviation calculated from three independent experiments. The splice site highlighted by a red triangle is a cryptic splice site that is not annotated in the reference genome (for the Celf5 gene). *,P < 0.05; **,P < 0.01; ***,P < 0.001. Source data are provided as a Source Data file.
Fig. 6
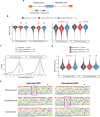
Fig. 6. PRMT9-regulated splicing targets exhibit nonconsensus anchoring site sequences.
a A schematic illustration of splicing cis-regulatory elements located in the intron sequence of pre-mRNA. Branch point and anchoring site locations are highlighted in gray and green, respectively.b Violin plot demonstration of the maximum entropy score of the 5' and 3' splice sites in upstream or downstream introns of differentially spliced cassette exons. The middle line of the boxplot represents median value. The low and high ends of the box represent the 25% and 75% quantiles, respectively. The two whiskers extend to 1.5 times the interquartile range. The statistical significance against background native cassette exons was assessed using a two-sided Wilcoxon’s rank-sum test. ns, not significant.c Density plot of the relative positions of predicted branch point (BP) locations distanced from their corresponding 3' splice sites. Native exon, n = 21,626; Included in PRMT9 KO, n = 599; Excluded in PRMT9 KO, n = 714.d Violin plot demonstration of BP scores from predicted branch point sites. The middle line of the boxplot represents median value. The low and high ends of the box represent the 25% and 75% quantiles, respectively. The two whiskers extend to 1.5 times the interquartile range. The statistical significance against background native cassette exons was assessed using a two-sided Wilcoxon’s rank-sum test. ns, not significant. Native exon, n = 21,626; Included in PRMT9 KO, n = 599; Excluded in PRMT9 KO, n = 714.e Sequence logo demonstration of the nucleotide frequency upstream of the predicted branch point sites. The height of the symbols within the stack indicates the observed frequency of the corresponding nucleotide at that position. The 0 point marks the position of the branch point adenosine (marked with an asterisk). Sequences from −25 nt to 4 nt relative to the branch point were shown, which include the reported anchoring site sequence covering 6 to 25 nt upstream of the branch point. The boxes highlight the sequence variations in PRMT9-regulated alternatively spliced exons in comparison to all native exons.
Fig. 7
Fig. 7. PRMT9-mediated SF3B2 R508me2s regulates splicing through the pre-mRNA anchoring site.
a Cryo-EM structure of the human spliceosome complex (PDB: 6FF4). Branch point on the pre-mRNA is shown in red. SF3B2 R508 is highlighted in green.b A schematic illustration of theStag2 splicing minigene. The alternative exon 31 is labeled in blue. The anchoring site is highlighted in green (upper panel). RT-PCR was performed to detect the alternative splicing products in control andPRMT9 KO HEK293 cells, as well as in cells expressing WT and R508K mutant SF3B2 (lower panel). n = 3.c Single nucleotide variations at the anchoring site differentially regulateStag2 minigene splicing. WT and mutant Stag2 splicing minigenes that contain single nucleotide mutations at −12, −13, and −14 nt upstream of the BP were compared by RT-PCR. The relative ratios of inclusion vs total (Inc/Total) were quantified using ImageJ software (n = 3).dPRMT9 KO promotes exon inclusion and renders splicing to be insensitive to −13nt nucleotide variations. The splicing patterns ofStag2 minigenes containing WT or single nucleotide mutations at −12, −13, and −14 nt upstream of the BP were detected in control andPRMT9 KO HEK 293 T cells by RT-PCR (n = 3).e PRMT9 negatively regulates SF3B2 interaction with nonconsensus anchoring sites. CLIP-qPCR was performed with the hippocampus tissues from WT andPrmt9 KO mice using the SF3B2 antibody. The amount of SF3B2-bound RNA was quantified by qPCR. Data are presented as mean ± SD (n = 3). *,p < 0.05; **,p < 0.01, ns, not significant.f Proposed working model: PRMT9-mediated SF3B2 R508me2s regulates RNA splicing through modulating SF3B2–anchoring site interaction and 3’ splice site selection. Source data are provided as a Source Data file.
See this image and copyright information in PMC

Similar articles

See all similar articles

References

    1. Bedford MT, Clarke SG. Protein arginine methylation in mammals: who, what, and why. Mol. Cell. 2009;33:1–13. doi: 10.1016/j.molcel.2008.12.013. - DOI - PMC - PubMed
    1. Blanc RS, Richard S. Arginine methylation: the coming of age. Mol. Cell. 2017;65:8–24. doi: 10.1016/j.molcel.2016.11.003. - DOI - PubMed
    1. Yang Y, Bedford MT. Protein arginine methyltransferases and cancer. Nat. Rev. Cancer. 2013;13:37–50. doi: 10.1038/nrc3409. - DOI - PubMed
    1. Guccione E, Richard S. The regulation, functions and clinical relevance of arginine methylation. Nat. Rev. Mol. Cell Biol. 2019;20:642–657. doi: 10.1038/s41580-019-0155-x. - DOI - PubMed
    1. Wu Q, Schapira M, Arrowsmith CH, Barsyte-Lovejoy D. Protein arginine methylation: from enigmatic functions to therapeutic targeting. Nat. Rev. Drug Discov. 2021;20:509–530. doi: 10.1038/s41573-021-00159-8. - DOI - PubMed

MeSH terms

Substances

Related information

Grants and funding

LinkOut - more resources

Full text links
Nature Publishing Group full text link Nature Publishing Group Free PMC article
Cite
Send To

NCBI Literature Resources

MeSHPMCBookshelfDisclaimer

The PubMed wordmark and PubMed logo are registered trademarks of the U.S. Department of Health and Human Services (HHS). Unauthorized use of these marks is strictly prohibited.


[8]ページ先頭

©2009-2025 Movatter.jp