Movatterモバイル変換


[0]ホーム

URL:


Skip to main page content
U.S. flag

An official website of the United States government

Dot gov

The .gov means it’s official.
Federal government websites often end in .gov or .mil. Before sharing sensitive information, make sure you’re on a federal government site.

Https

The site is secure.
Thehttps:// ensures that you are connecting to the official website and that any information you provide is encrypted and transmitted securely.

NIH NLM Logo
Log inShow account info
Access keysNCBI HomepageMyNCBI HomepageMain ContentMain Navigation
pubmed logo
Advanced Clipboard
User Guide

Full text links

Free PMC article
Full text links

Actions

Share

Review
.2023;43(8):105.
doi: 10.1007/s13157-023-01722-2. Epub 2023 Nov 28.

Practical Guide to Measuring Wetland Carbon Pools and Fluxes

Sheel Bansal  1Irena F Creed  2Brian A Tangen  1Scott D Bridgham  3Ankur R Desai  4Ken W Krauss  5Scott C Neubauer  6Gregory B Noe  7Donald O Rosenberry  8Carl Trettin  9Kimberly P Wickland  10Scott T Allen  11Ariane Arias-Ortiz  12Anna R Armitage  13Dennis Baldocchi  14Kakoli Banerjee  15David Bastviken  16Peter Berg  17Matthew J Bogard  18Alex T Chow  19William H Conner  20Christopher Craft  21Courtney Creamer  22Tonya DelSontro  23Jamie A Duberstein  20Meagan Eagle  24M Siobhan Fennessy  25Sarah A Finkelstein  26Mathias Göckede  27Sabine Grunwald  28Meghan Halabisky  29Ellen Herbert  30Mohammad M R Jahangir  31Olivia F Johnson  1  32Miriam C Jones  7Jeffrey J Kelleway  33Sara Knox  34Kevin D Kroeger  24Kevin A Kuehn  35David Lobb  36Amanda L Loder  37Shizhou Ma  38Damien T Maher  39Gavin McNicol  40Jacob Meier  1Beth A Middleton  5Christopher Mills  41Purbasha Mistry  38Abhijit Mitra  42Courtney Mobilian  21Amanda M Nahlik  43Sue Newman  44Jessica L O'Connell  45Patty Oikawa  46Max Post van der Burg  1Charles A Schutte  47Changchun Song  48Camille L Stagg  5Jessica Turner  49Rodrigo Vargas  50Mark P Waldrop  22Marcus B Wallin  51Zhaohui Aleck Wang  52Eric J Ward  5Debra A Willard  7Stephanie Yarwood  53Xiaoyan Zhu  54
Affiliations
Review

Practical Guide to Measuring Wetland Carbon Pools and Fluxes

Sheel Bansal et al. Wetlands (Wilmington).2023.

Abstract

Wetlands cover a small portion of the world, but have disproportionate influence on global carbon (C) sequestration, carbon dioxide and methane emissions, and aquatic C fluxes. However, the underlying biogeochemical processes that affect wetland C pools and fluxes are complex and dynamic, making measurements of wetland C challenging. Over decades of research, many observational, experimental, and analytical approaches have been developed to understand and quantify pools and fluxes of wetland C. Sampling approaches range in their representation of wetland C from short to long timeframes and local to landscape spatial scales. This review summarizes common and cutting-edge methodological approaches for quantifying wetland C pools and fluxes. We firstdefine each of the major C pools and fluxes and providerationale for their importance to wetland C dynamics. For each approach, we clarifywhat component of wetland C is measured and its spatial and temporal representativeness and constraints. We describe practical considerations for each approach, such aswhere andwhen an approach is typically used,who can conduct the measurements (expertise, training requirements), andhow approaches are conducted, including considerations on equipment complexity and costs. Finally, we reviewkey covariates andancillary measurements that enhance the interpretation of findings and facilitate model development. The protocols that we describe to measure soil, water, vegetation, and gases are also relevant for related disciplines such as ecology. Improved quality and consistency of data collection and reporting across studies will help reduce global uncertainties and develop management strategies to use wetlands as nature-based climate solutions.

Supplementary information: The online version contains supplementary material available at 10.1007/s13157-023-01722-2.

Keywords: Accretion; Accumulation; Biomass; Bulk density; Carbon cycling; Chambers; Core; Decomposition; Dissolved gas; Dissolved organic carbon; Eddy covariance; Greenhouse gas; Groundwater; Hydrology; Incubation; Lateral transport; Litter; Methane; Methods; Microbes; Models; Net primary productivity; Plants; Porewater; Radiometric dating; Remote sensing; Sediment; Soil organic carbon; Vegetation; Water.

© The Author(s) 2023.


Conflict of interest statement

Competing InterestsThe authors declare that the research was conducted in the absence of any commercial or financial relationships that could be construed as a potential conflict of interest.

Figures
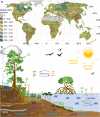
Fig. 1
Fig. 1
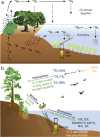
(a) Global distribution of wetland extent (fraction per 0.25 degree pixel [~ 25 km2 at the equator]) using Wetland Area Dataset for Methane Modeling (WAD2M). Map based on inundation data from Zhang et al. (2021c); Bansal et al. (2023); note the legend colors correspond with quantiles of wetland fraction to help visualize spatial variation across the globe (b) conceptual model of wetland carbon pools and fluxes [CH4, methane; CO2, carbon dioxide; DIC, dissolved inorganic carbon; DOC, dissolved organic carbon; N2O, nitrous oxide;pCH4, partial pressure of CH4 in water;pCO2, partial pressure of CO2 in water; POC, particulate organic carbon; SOC, soil organic carbon]
Fig. 2
Fig. 2
Wetland carbon publications from 1980 to 2022. (a) Annual number (bars) and percent (dots) of publications with keywords ‘wetland’ AND ‘carbon’; it should be noted that earlier studies did not focus on ‘carbon’ per se, but did focus on productivity and transfer of organic matter among trophic levels; (b) cumulative number of publications with keywords ‘wetland’ AND ‘carbon’ (top bar) AND additional keyword(s) (other bars). The ‘*’ symbol indicates any characters can follow. Both panels are based on searches conducted in the Web of Science database (www.webofknowledge.com) in April 2023
Fig. 3
Fig. 3
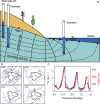
Wetlands have high spatial and temporal heterogeneity in their carbon (C) pools and fluxes. Methodological approaches shown here have different temporal (x-axis) and spatial (y-axis) scopes of inference to assess different carbon pools and fluxes (colors). *Vegetation (green) includes both harvest and allometric methods. *Soil C includes both soil carbon pools and accumulation rates. [CHN, carbon-hydrogen–nitrogen; DIC, dissolved inorganic carbon; DOC, dissolved organic carbon; Herb, herbaceous; NPP, net primary productivity;pGHG, partial pressure of dissolved greenhouse gases (GHGs) in water; POC, particulate organic carbon; SETs, surface elevation tables]
Fig. 4
Fig. 4
Long-term and short-term controls on net organic carbon sequestration in wetlands. The thickness of arrows indicates their relative strength of influence of controls. The + and – signs indicate the positive and negative relationships, respectively, between controls and net carbon sequestration rate. Image created by Irena Creed and Purbasha Mistry and was based on Chapin et al. (2011). [C:N, carbon to nitrogen ratio; NPP, net primary productivity]
Fig. 5
Fig. 5
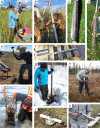
Examples of soil coring and devices, including: (a) barrel corer with a gas powered post driver; (b) piston corer with tripod (for core extraction); (c) Russian (Macauley) peat corer; (d,e) gouge auger; (f) Livingstone piston corer modified with serrated barrel for coring through fibrous sediment; (g) core freezer (also referred to as the ‘frozen finger’); (h) Snow, Ice, and Permafrost Research corer; (i) box-style corer; (j) soil coring tube inserted into the soil with core cap and handle above the soil surface; (k) hand drill corer. Images with permission from Cathleen Sampselle (a), Ariane Arias-Ortiz (b, e), Carl Trettin (c), Satya Kent (d), Donald Rosenberry (f), Dong Yoon Lee (i), Camille Stagg (j), and Mark Waldrop (g, h, k). See additional images of corers in various figures presented in Osborne and DeLaune (2013)
Fig. 6
Fig. 6
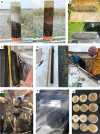
Examples of collection, processing, and analysis of soil cores, including: (a) visual comparison of open barrel cores from nutrient unenriched (left) and enriched (right) sites in the Everglades, Florida, USA; (b) visual comparison of cores from organic-soil (top) and mineral-soil (bottom) marshes in Louisiana, USA; (c) measuring depth of core extracted in Palo Verde, Costa Rica using an open barrel corer that was split vertically post-collection to extract the core; (d) measuring (left) and processing (right) a core collected using a gouge auger at the Salt Marsh Accretion Response to Warming eXperiment (SMARTX) in Maryland, USA; (e) extruding and slicing core increments from a polyvinyl chloride (PVC) open barrel corer in an intertidal freshwater wetland, Louisiana, USA; (f) storing core increment for transport; (g) soil samples following determination of carbon content using Loss-on-Ignition (LOI). Images with permission from Sue Newman (a, modified from Reddy and DeLaune 2008), Camille Stagg (b), Amanda Nahlik (c), Satya Kent (d, left), Genevieve Noyce (d, right), Dong Yoon Lee (e), Siobhan Fennessy (f), and Olivia Johnson (g)
Fig. 7
Fig. 7
(a) Conceptual diagram of wetland porewater, surface water, and groundwater and associated carbon (C) constituents including gaseous (red) and dissolved (dark blue) carbon dioxide (CO2,pCO2), methane (CH4,pCH4), and oxygen (O2, DO), Dissolved Organic C (DOC), Dissolved Inorganic C (DIC), Particulate Organic C (POC), and Particulate Inorganic C (PIC). Note that porewater is technically located in the unsaturated zone below the soil surface and above the water table; however, the term ‘porewater’ is typically used in the wetland scientific literature to indicate any water near the sediment surface, such as in the root zone, even if soils are saturated and below the water table; (b) DIC speciation for brackish water at 25 °C and 5 g kg−1 salinity (5,000 ppm). Images with permission from Kimberly P. Wickland (a) and based on Stumm and Morgan (2012) (b). [CO2(aq), aqueous or dissolved CO2; CO32−, carbonate ion; HCO3., bicarbonate ion; H2CO3, carbonic acid]
Fig. 8
Fig. 8
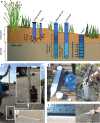
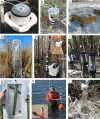
Methods to sample surface water, porewater, and groundwater: (a) schematic diagram of tension lysimeter, sipper, water-table well, piezometer, and peeper; (b) water sampler devices to collect deeper water: a plastic bottle attached to a 2 m polyvinyl chloride (PVC) pole using plumbing clamps with a string attached to a rubber stopper (inset photo); (c) a plastic bottle attached to a 2 m PVC pole using zip ties to sample surface water from the shore or from a boat to avoid disturbance; (d) peeper (also called dialysis sampler) with vertically stacked independent wells (left) to measure dissolved constituents as described in MacDonald et al. (2013). Each sample well is connected to Tygon tubing to collect sample water and re-fill with deionized water (right); (e) metal tube sipper (left) with holes along the bottom 60 mm for collection of subsurface porewater or shallow groundwater (right); Images with permission from Olivia Johnson (b, c, e) and Jorge Villa (d)
Fig. 9
Fig. 9
One example sequence of direct headspace determination through equilibration. (a) Fill a syringe with 25 mL of sample water; (b) add 35 mL of analyte-free inert gas (e.g., N2 or He) to syringe and then shake for 3 to 5 min by hand or mechanical shaker (not shown); (c) connect sample syringe to an empty syringe with an attached needle (steps c and d and the extra 1-way valves are to limit moisture entering the vial and may not be required depending on gas analyzer); (d) transfer headspace gas to the empty syringe; (e) insert the needle into a vacuum-evacuated crimp-top serum vial with butyl stopper; and (f) push the headspace gas into the vial. Both syringes have Luer Lock tips for connecting 1-way or 3-way stopcock valves. Care should be taken to ensure valves are oriented correctly at each step to avoid loss or contamination of sample. Images with permission from Sheel Bansal
Fig. 10
Fig. 10
Continuum of organic carbon in water (based on Thurman  and modified from Chow et al. 2022). Particulate (gray shading) and dissolved (yellow shading) organic carbon are defined as greater or less than 0.45 µm (micron) size, respectively. The types of organisms and molecular compounds span a range of sizes. Methods to isolate different materials require different filtration methods. Image with permission from Kelly Wing-Yee Cheah
Fig. 11
Fig. 11
Examples of high-frequency in situ sensor data and equipment: (a) time series of dissolved inorganic carbon (DIC, blue dots and line) concentrations measured using a Channelized Optical System (CHANOS) at the tidal creek of the Sage Lot Pond marsh, Waquoit Bay, Massachusetts, USA; discrete samples of laboratory measured DIC concentrations (cyan circles) were used to validate CHANOS DIC (Wang et al. 2015); a multi-linear regression model of DIC (MLR DIC) estimates (pink, dashed line) concentrations (Chu et al. 2018); precipitation amount (mm, black bars); (b) time series of measured (green dots) and modeled (red dots and line) dissolved methane (CH4) concentrations using a Membrane Inlet Mass Spectrometry (MIMS) showing disruption of daily patterns following a storm event in a wetland in the Prairie Pothole Region of North America; (c) schematic diagram and picture of a partial pressure of carbon dioxide (pCO2) sensor (Haase and Sanford 2018). Images with permission from Zhaohui Aleck Wang (a), Christopher Martins (b), and Karl Haase (c)
Fig. 12
Fig. 12
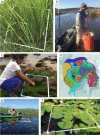
Various methods to assess aboveground biomass. (a) 0.25 m2 polyvinyl chloride (PVC) quadrat marking a clip plot forTypha biomass; (b) using a cylindrical unit sampler with a modified rake to collect submerged aquatic vegetation in coastal South Carolina (USA) estuarine wetlands (Bauer et al. 2020); (c) collecting macroalgae using a PVC quadrat from Vishakhapatnam coast of Andhra Pradesh in western Bay of Bengal, India; (d) map of vegetation zones within a prairie pothole wetland (Williams 2015); (e,f) sampling floating vegetation using a PVC quadrat from a kayak in Munuscong Marsh along St. Marys River, a Great Lakes connecting channel between Lakes Superior and Huron, North America. Images with permission from Olivia Johnson (a), Beau Bauer (b), Kakoli Banerjee and Prajna Paramita (c), Shelby Williams (d), and Logan St. John (e, f)
Fig. 13
Fig. 13
(a) Wetland tree biomass survey plot (20 × 25 m size); All trees > 10 cm diameter at breast height (dbh, 1.3 m) are measured in the green area, all saplings > 2.5 and < 10 cm dbh are measured in the orange circle, and seedlings < 2.5 cm dbh and shrubs are measured in the yellow hatched section; the dotted lines represent 10 m transect locations for dead and downed wood surveys; (b) drying whole trees and weighing (inset) specimens to determine biomass of the main trunk; (c) measuring dbh using a diameter tape measure; (d) standard knee data required for biomass calculation (Middleton 2020b). Images with permission from Jamie Duberstein (a), Herman W Hudson III (b), William Conner (c), and Beth Middleton (d, with permission of Elsevier)
Fig. 14
Fig. 14
(a) Collection of belowground biomass and soils to a fixed size and depth into the rooting zone using a shovel; (b) root ingrowth core made of canvas mesh using the Kellog LTER protocol (KBS LTER 2008); (c) root washing station ofSpartina alterniflora andPhragmites australis cores from a salt marsh in Connecticut, USA; (d) example ofTypha rhizomes and roots. Images with permission from Olivia Johnson (a, d) and Madeleine Meadows-Mcdonnell (b, c)
Fig. 15
Fig. 15
Methods to measure tree growth rates and net primary productivity: (a) tree coring using an increment borer; (b) dendrometer band measurements to the nearest 0.25 mm to determine radial growth rates; (c) root ingrowth bag divided into distinct depth intervals; (d,e) litter fall traps to estimate overstory aboveground litter biomass production. Images with permission from Jamie A. Duberstein (a, b), William H. Conner (d), Nicole Cormier and Andrew S. From (c), and Beth A. Middleton (e)
Fig. 16
Fig. 16
Common methods for assessing surficial soil deposition or erosion: (a) glass fiber filter paper sediment trap collecting tidal deposits of sediment and plant detritus in a saltmarsh; (b) measuring deposition above a feldspar marker using a soil probe; (c) processing a core above a feldspar marker horizon; (d) slice of soil showing feldspar marker overlain by accumulated sediment; (e) sedimentation tile overlain by sediment; (f) vertical pin; (g,h) surveying an elevation benchmark using a real-time kinematic global positioning system (RTK-GPS); (i) dendrogeomorphic bank erosion; and (j) dendrogeomorphic vertical change to assess erosion and deposition around tree roots and stem, respectively. Images with permission from Jeffrey Kelleway (a), Greg Noe (b, c, d, e, f, i, j), and Brian Tangen (g, h)
Fig. 17
Fig. 17
(a) An example of a surface elevation table (SET) with a feldspar marker horizon (top left of photo); (b) a conceptual diagram of rod SET system (RSET) with a marker horizon (Lynch et al. 2015). Image with permission from Gregory B. Noe (a) and James C. Lynch (b)
Fig. 18
Fig. 18
Conceptual diagram (a) of the lead (Pb) cycle as it decays from uranium-238 (238U), thorium-230 (230Th), radium-226 (226Ra), radon-222 (222Rn), to lead-210 (210Pb) from soils to the atmosphere and back down to wetland soils through dry and wet deposition (Arias-Ortiz et al. 2018); (b) conceptual diagram of the carbon-14 (14C) cycle where atmospheric carbon is incorporated into plants, which subsequently die, decompose, and are incorporated into soils or dissolved carbon species [12CO2, carbon-12 CO2;13CO2, carbon-13 CO2;14CO2, carbon-14 CO2;14C/12C, ratio of carbon-12 to carbon-14;14N, nitrogen-14;210Pbsup, supported210Pb; CH4, methane; CO2, carbon dioxide; CO32−, carbonate ion; DOC, dissolved organic carbon; HCO3., bicarbonate ion; POC, particulate organic carbon]
Fig. 19
Fig. 19
(a) Coastal wetland soil core depth profile of lead-210 (210Pb) excess (green), cesium-137 (137Cs) (blue), and radium-226 (226Ra) (red) from a sediment core collected in Sage Lot Pond, Waquoit Bay National Estuarine Research Reserve, Massachusetts, USA (Gonneea et al. 2019).137Cs peak occurs in 1963 at ~ 15 cm depth, while210Pbexcess reaches background levels (i.e., ~ 0.1 dpm g−1) by 35 cm where the210Pb line meets the226Ra; note very low226Ra activity, which is common in organic soils; (b) age-depth model from a peat core collected in Great Dismal Swamp National Wildlife Refuge, Virginia and North Carolina, USA, integrating data from radiocarbon dates,210Pb, and pollen biostratigraphy. Years on x-axis are in calendar years before present (bp), with 1950 as year 0. The vertical black line indicates the coring year (2017, − 67 bp). The green line represents %Ambrosia pollen. The red and yellow polygons are violin plots that show the probability-density functions for discrete age estimates. Red violin plots are based on pollen biostratigraphy showing a sharp increase inAmbrosia at 150 ± 20 years bp following colonial land clearance and an increase inAcer at − 10 ± 10 years bp following expansion of maple gum forests after canal construction, and a210Pb estimate of 33 ± 20 years bp. The210Pb age determination for this example was made by selecting the depth at which210Pb reached background levels and assigning it an age of 100 ± 20 years before coring in 2017. Yellow violin plots are based on radiocarbon age estimates. The red line represents the best fit line. The gray shading indicates 2 standard deviations uncertainty associated with the age-depth model. The age-depth model was made using the Bayesian age modeling program Bacon (Blaauw and Christen 2011), inserting the210Pb and pollen ages as calendar years and the radiocarbon dates in radiocarbon years, calibrated to calendar ages using the Bacon modeling program
Fig. 20
Fig. 20
(a) A floating gas flux chamber made of polyvinyl chloride (PVC) connected with inlet and outlet tubes to a high frequency gas analyzer; (b) clear, static chamber over vegetation at the edge of an experimental wetland (at Northern Prairie Wildlife Research Center, North Dakota, USA): red arrow pointing to ice pack to keep chamber cool and yellow arrow pointing to fan to mix air; (c) non-growing season chamber measurement in permafrost regions of China; (d) whole-plant chamber overPhragmites for emergent macrophyte and soil fluxes; (e) gas flux measurements of tree stems using the Small Nimble In Situ Fine-Scale Flux (SNIFF) method with cavity ring-down spectroscopy (Picarro, GasScouter) gas analyzer from six stem heights within subtropicalCasuarina sp. lowland forest; (f) measurements of methane transport and carbon dioxide respiration from the stems of mangroveKandelia; (g) leaf chamber equipped with a digital thermometer overTypha; (h) deploying inverted cone ebullition trap (2.5-cm diameter PVC) with plastic funnel (20-cm diameter) attached to air-tight collection bottle on top with valve; (i) submerged peatland ebullition trap using a syringe at Fletcher Creek Ecological Preserve, Ontario, Canada. Images with permission from Olivia Johnson (a, b, h), Xiaoxin Sun (c), Scott Jones (d), Luke Jeffery (e), Jiafang Huang (f), and Maria Strack (i)
Fig. 21
Fig. 21
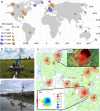
(a) Location of the 51 wetland tower sites from the FLUXNET-2015 and FLUXNET-CH4 databases that report eddy covariance (EC) measurements of carbon dioxide (CO2) and methane (CH4) fluxes (https://fluxnet.org/). The size of the dots represents the number of years of measurements, blue dots represent sites with CO2 fluxes only, and orange dot sites have both CO2 and CH4 fluxes; (b) an EC tower in the AmeriFlux network located in a freshwater marsh site in the Salvador Wildlife Management Area, Louisiana, USA (US-LA2); (c) site map of EC tower sites from the Chequamegon Heterogenous Ecosystem Energy-Balance Study Enabled by High-density Extensive Array of Detectors 2019 (CHEESEHEAD19; Butterworth et al. 2021) study. Red polygons represent June to October, 2019 EC tower footprint climatology, with red shading depicting relative contribution of spatial locations to total footprint; (c, top right inset) aerial image of lakeshore tower NW4 showing 90% footprint climatology in shading, with distance from tower noted in km, showing maximum fetch of 500 to 600 m from the tower, (c, bottom left inset) wind rose plot from site SE3 showing frequency of wind speed (WS) as a function of wind direction; (d) an EC tower of the AmeriFlux network located in a flooded marsh site Old Woman Creek National Estuarine Research Reserve off of Lake Erie, Ohio, USA (US-OWC). Images with permission from Eric Ward (b); CHEESEHEAD19 (http://cheesehead19.org) (c); base map of panel c produced by J. Mineau, University of Wisconsin with U.S. Forest Service base map; aerial image of site NW4 from Google Earth Imagery; footprint and wind rose plots by B. Butterworth, National Oceanic and Atmospheric Administration CIRES; and Gil Bohrer (d)
Fig. 22
Fig. 22
(a) Litter bags placed on the sediment surface and tied to a center pole to keep samples in place during periods of high water and to help locate bags during recovery of samples in a tidal freshwater forested wetland in South Carolina, USA; (b) physically tagged standing litter in Lake Dagow, Germany; (c) graph of biomass remaining in litter bags over time in fresh, oligohaline, mesohaline, and polyhaline marshes in Louisiana, USA (Stagg et al. 2018); (d) litter bag retrieved from a freshwater herbaceous marsh in Louisiana, USA. Images with permission from Camille Stagg (a, c, d) and Manuela Abelho (b)
Fig. 23
Fig. 23
(a) Intact soil cores (4-cm diameter, 30-cm deep) collected from the Cowlitz River in Oregon, USA. Soils were incubated in glass containers and capped to maintain anaerobic conditions. Lids were fitted with blue rubber septa for gas collection and three redox probes at different depths to capture vertical spatial gradients; (b) sections of cores from a boreal riparian forest incubated within glass (mason) jar incubation vessels. Incubations were capped during the measurement period and kept dark and at constant temperature in an incubator. Gases are sampled with a syringe through a septum Luer Lock fitting in the lid. Images with permission from Stephanie Yarwood (a) and Mark Waldrop (b)
Fig. 24
Fig. 24
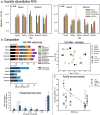
Examples of data to assess the (a) quantity, (b) composition, and (c) activity of the wetland microbial community. (a) Quantification of bacterial (EUB, left) and archaeal (ARC, right) 16S rRNA gene copies in natural and restored wetlands using quantitative polymerase chain reaction (PCR) (modified from Prasse et al. 2015); (b) microbial community composition measured using 16S rRNA gene sequencing (Prasse et al. 2015) (top left), a principal component analysis ordination based on 16S rRNA bacterial and archaeal amplicon sequencing (% variance explained) (modified from Prasse et al. 2015) (top right), and concentrations of phospholipid fatty acid (PFLA) biomarkers (Bac = total bacteria, G +  = Gram positive bacteria, G- = Gram negative bacteria, Actino = actinobacteria, MOB = methane oxidizing bacteria, TFA = total fatty acids) (modified from Chowdhury and Dick 2012) (bottom left); (c) activities of Beta-glucosidase (BG, an enzyme for breaking down complex polymers such as cellulose) and Ohio Rapid Assessment Method (ORAM) scores in a forested wetland (modified from Rokosch et al. 2009)
Fig. 25
Fig. 25
(a) Conceptual diagram of an automated measurement of stage (depth) using a staff gauge for discrete measurements and an automated pressure transducer attached to a high frequency data logging platform with battery power, solar panels, voltage regulator, and communications hardware; (b) field technician taking a discrete measurement of stream discharge using a handheld flowmeter. Paired discrete measurements of stage and discharge are used to develop site-specific relationships that can estimate streamflow discharge using continuous measurements of stream stage. Images from Sauer and Turnipseed (2010) (a) and Turnipseed and Sauer (2010) (b)
Fig. 26
Fig. 26
(a) Conceptual diagram of groundwater flow characterized using measurements of hydraulic head at specific locations relative to the wetland surface water using a water-table well and piezometers (Rosenberry and Hayashi 2013). The water-table well (left) shows higher hydraulic head of the groundwater relative to wetland stage on a horizontal axis, indicating the potential for groundwater to discharge laterally to the adjacent wetland. The piezometer (immediately to the right of the water-table well) has lower hydraulic head than the water table, indicating a downward component of movement of groundwater through the flow domain. The piezometer located within the wetland (right) shows hydraulic head that is higher relative to wetland stage, indicating groundwater has the potential to flow upward, into the wetland. Equipotential lines are lines of equal hydraulic head. Dashed lines indicate flow paths and direction of groundwater flow; (b) lines of equal hydraulic head in soils surrounding wetlands (thin black lines) and perpendicular groundwater flow lines (blue lines with arrow) based on a network of 7, 2, or 3 water-table monitoring wells surrounding a hypothetical wetland. Numbers indicate hydraulic head (m) associated with each water-table well and wetland stage (75 m). Water flows from higher to lower head. Letters indicate the wetland shoreline segment associated with each of the seven monitoring wells (Rosenberry and Hayashi 2013); (c) an example of coupling Radon-222 (.222Rn) (a natural groundwater tracer, squares with blue line) and the partial pressure of carbon dioxide (pCO2, dots with red line) demonstrating how sub-daily fluctuations in groundwater seepage contribute to aquatic C dynamics. Image from Rosenberry and Hayashi (2013) (a, b) and Santos et al. (2012) (c)
Fig. 27
Fig. 27
(a) Images of flow traps (runoff trays) that direct overland flow to a single location for collection and analysis; with protective cover off (top left) and on (bottom left), with sample bottle (right, I-Chem Storm Water Sampler from Forestry Suppliers) with cover. The plastic cover over the bottle slows the rate of water collection, thereby providing a better representation of water from an entire runoff event, not just the start of the event. A coarse filter below the dome is used to prevent clogging by coarse debris. A drainage system (e.g., trench) is excavated downslope from the collection hole to avoid overtopping of the collection bottle (Page et al. 2020); (b) diagram and picture of a pit-fall sand trap used to estimate contribution of aeolian sand to sedimentation in a backbarrier marsh (Rodriguez et al. 2013). Images used with permission from Bryan Page (a) and Antonio Rodriguez (b) [ABS, Acrylonitrile–Butadiene–Styrene; PVC, polyvinyl chloride]
Fig. 28
Fig. 28
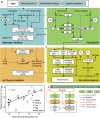
Example of (a) a conceptual process-based model Wetland-DNDC (Zhang et al. ; Lloyd et al. 2013); (b) eddy covariance annual methane (CH4) emissions from multiple wetland types (symbols) as a function of mean annual temperature (black line) (Delwiche et al. 2021); (c) a carbon stock and flow model of an herbaceous wetland. [C, carbon; CO2, carbon dioxide; Eh, redox potential; GPP, gross primary productivity; LAI, leaf area index; NPP, net primary productivity]
Fig. 29
Fig. 29
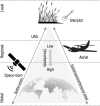
Carbon monitoring systems and platforms in relation to uncertainty and remote sensing resolution domains. Site/plot scale data (top) have lower uncertainty, but also have the lowest spatial scale of inference. Space-born satellites can provide global-scale data, but also have the highest uncertainty (modified from Campbell et al. 2022). [UAS, Uncrewed Aircraft Systems]
Fig. 30
Fig. 30
(a) Spectral reflectance during growing (green) and dormant (brown) seasons under flooded (dashed lines) and dry (solid lines) conditions (Narron et al. 2022). Growing season reflectance is overall higher than during the dormant season, but flooding attenuates light, lowering reflectance regardless of season, especially at longer wavelengths; (b) Sentinel-1 Ground Range Detected (GRD) C-Band Synthetic Aperture Radar (SAR) backscatter (VH polarization). Water areas show as dark regions, indicating high absorption and attenuation of the SAR signal, whereas lighter features indicate uplands (modified from Twele et al. 2016); (c) Light Detection and Ranging (LiDAR) intensity over a pond and surrounding upland. Blue to red indicates lower to higher intensity of LiDAR returns to the sensor, respectively. The pond mainly has very low intensity returns (very dark blue) and absorbs the LiDAR signal, but occasionally has very high intensity returns (red color) due to specular reflection off the water surface (modified from Acharjee et al. 2016). Image with permission from Venkat Devarajan (c)
Fig. 31
Fig. 31
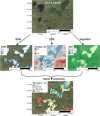
Example of a workflow to generate spatially explicit predictions (bottom) of wetland methane (CH4) fluxes using imagery (middle) over a defined area of interest (top). In this example, the area of interest is the Cottonwood Lake Study Area in North Dakota (USA), part of the Prairie Pothole Region of North America; (middle, left) Dynamic Surface Water Extent (DSWE) classification using Landsat imagery (Jones 2019); (middle, center) Digital Elevation Model (DEM) using Light Detection and Ranging (LiDAR); (middle right) Normalized Difference Vegetation Index (NDVI) using Landsat imagery; (bottom) growing season CH4 emissions based on Bansal et al. (2023). Areal images from National Agriculture Imagery Program (NAIP) Digital Ortho Photo Image (https://www.fisheries.noaa.gov/inport/item/49508)
See this image and copyright information in PMC

Similar articles

See all similar articles

Cited by

References

    1. Abella SR, Zimmer BW. Estimating organic carbon from loss-on-ignition in northern Arizona forest soils. Soil Science Society of America Journal. 2007;71:545–550. doi: 10.2136/sssaj2006.0136. - DOI
    1. Åberg J, Wallin B. Evaluating a fast headspace method for measuring DIC and subsequent calculation of pCO2 in freshwater systems. Inland Waters. 2014;4:157–166. doi: 10.5268/IW-4.2.694. - DOI
    1. Abraham BS, Caglayan D, Carrillo NV, et al. Shotgun metagenomic analysis of microbial communities from the Loxahatchee nature preserve in the Florida Everglades. Environmental Microbiome. 2020;15:2. doi: 10.1186/s40793-019-0352-4. - DOI - PMC - PubMed
    1. Abril G, Bouillon S, Darchambeau F, et al. Technical Note: Large overestimation of pCO2 calculated from pH and alkalinity in acidic, organic-rich freshwaters. Biogeosciences. 2015;12:67–78. doi: 10.5194/bg-12-67-2015. - DOI
    1. Abril JM. A new theoretical treatment of compaction and the advective-diffusive processes in sediments: A reviewed basis for radiometric dating models. Journal of Paleolimnology. 2003;30:363–370. doi: 10.1023/B:JOPL.0000007220.16908.d4. - DOI

Publication types

Related information

Grants and funding

LinkOut - more resources

Full text links
Free PMC article
Cite
Send To

NCBI Literature Resources

MeSHPMCBookshelfDisclaimer

The PubMed wordmark and PubMed logo are registered trademarks of the U.S. Department of Health and Human Services (HHS). Unauthorized use of these marks is strictly prohibited.


[8]ページ先頭

©2009-2025 Movatter.jp