Movatterモバイル変換


[0]ホーム

URL:


Skip to main page content
U.S. flag

An official website of the United States government

Dot gov

The .gov means it’s official.
Federal government websites often end in .gov or .mil. Before sharing sensitive information, make sure you’re on a federal government site.

Https

The site is secure.
Thehttps:// ensures that you are connecting to the official website and that any information you provide is encrypted and transmitted securely.

NIH NLM Logo
Log inShow account info
Access keysNCBI HomepageMyNCBI HomepageMain ContentMain Navigation
pubmed logo
Advanced Clipboard
User Guide

Full text links

Elsevier Science full text link Elsevier Science Free PMC article
Full text links

Actions

Share

.2023 Nov 20;3(11):100644.
doi: 10.1016/j.crmeth.2023.100644.

Third-generation rabies viral vectors allow nontoxic retrograde targeting of projection neurons with greatly increased efficiency

Affiliations

Third-generation rabies viral vectors allow nontoxic retrograde targeting of projection neurons with greatly increased efficiency

Lei Jin et al. Cell Rep Methods..

Abstract

Rabies viral vectors have become important components of the systems neuroscience toolkit, allowing both direct retrograde targeting of projection neurons and monosynaptic tracing of inputs to defined postsynaptic populations, but the rapid cytotoxicity of first-generation (ΔG) vectors limits their use to short-term experiments. We recently introduced second-generation, double-deletion-mutant (ΔGL) rabies viral vectors, showing that they efficiently retrogradely infect projection neurons and express recombinases effectively but with little to no detectable toxicity; more recently, we have shown that ΔGL viruses can be used for monosynaptic tracing with far lower cytotoxicity than the first-generation system. Here, we introduce third-generation (ΔL) rabies viral vectors, which appear to be as nontoxic as second-generation ones but have the major advantage of growing to much higher titers, resulting in significantly increased numbers of retrogradely labeled neurons in vivo.

Keywords: CP: Neuroscience.

Copyright © 2023 The Author(s). Published by Elsevier Inc. All rights reserved.


Conflict of interest statement

Declaration of interests I.R.W. is a consultant for Monosynaptix, LLC, advising on the design of neuroscientific experiments.

Figures
None
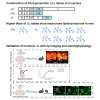
Graphical abstract
Figure 1
Figure 1
Rabies virus with just the polymerase gene deleted (ΔL) is phenotypically similar to double-deletion-mutant (ΔGL) virus but replicates to much higher titers within complementing cells (A–D) Deletion of just the polymerase gene L reduces transgene expression to levels that are very low but still sufficient to support reporter allele recombination in Cre reporter cells. (A) Negative controls (uninfected cells). Top: uninfected HEK 293T cells stained for rabies virus nucleoprotein (green) and for Cre (red). Histograms to the right show flow cytometric quantification of baseline fluorescence of uninfected cells in these channels. Bottom: uninfected reporter cells that express mCherry following Cre recombination. Little signal is seen in these negative controls. (B) Cells infected with a first-generation (ΔG) vector expressing Cre. Both Cre and N are expressed at very high levels, and infected Cre reporter cells brightly express mCherry (note that dilutions at which roughly half of cells were infected were chosen for this figure). (C) Consistent with our previous findings, expression of both nucleoprotein and Cre from a second-generation (ΔGL) vector is drastically reduced with respect to the first-generation vector, with expression levels comparable to those seen in negative controls. Despite this, the low Cre levels are still high enough to activate mCherry expression in reporter cells. (D) A third-generation (ΔL) vector expresses nucleoprotein and Cre at similarly very low levels, but again, Cre expression is nonetheless high enough to successfully activate mCherry expression in reporter cells. (E and F) Third-generation (ΔL) vectors grow to much high titers in cultured cells than second-generation (ΔGL) ones do. (E) Viral titers in supernatants of complementing cells (expressing L, G, or both) infected with ΔL, ΔGL, or ΔG viruses at a multiplicity of infection (MOI) of 0.01 (“multi-step growth curves”), with supernatants collected every 24 h for 5 days. Whereas a ΔGL virus only achieves 1.05e6 infectious units (iu)/mL over the duration of the experiment, the ΔL virus grows to 6.2-fold higher on the same cell line and 12.5-fold higher on a line expressing L alone. The highest ΔL titers obtained in this experiment were significantly higher than the highest obtained with a first-generation (ΔG) virus (single-factor ANOVA, p = 3.24e−3, n = 3 replicates per condition). (F) Similarly, at an MOI of 1 (“single-step” growth curves), the ΔGL virus titer peaks at 2.37e6 iu/mL, whereas the peak titer of the ΔL virus is 2.60e7 iu/mL, 11.0-fold higher than that of the ΔGL virus and not significantly different from that of the ΔG virus (single-factor ANOVA, p = 0.105, n = 3 replicates per condition). Graphs in (E) and (F) show the means ± SEM. See Data S1 for titers and statistical comparisons.
Figure 2
Figure 2
Third-generation (ΔL) rabies viral vectors retrogradely label many more projection neuronsin vivo than do second-generation (ΔGL) ones and leave cells morphologically normal for at least 6 months (A) Design of experiments retrogradely targeting corticothalamic cells in reporter mice. Either second-generation vector RVΔGL-Flpo or RVΔGL-Cre, or third-generation vector RVΔL-Flpo or RVΔL-Cre, was injected into somatosensory thalamus (ventral posteromedial nucleus/posterior nucleus) of either Ai65F (Flpo reporter) or Ai14 (Cre reporter). Mice were perfused 1 week (E and G), 4 weeks (F and H), 4 months (B), or 6 months later (C). (B) Corticothalamic neurons in S1 of Ai14 mice labeled with RVΔL-Cre at 4 months postinjection. Cells appear morphologically completely normal, with no blebbing or decomposition of processes. Scale bars: 200 μm (left) and 2 μm (right). (C) Corticothalamic neurons in S1 of Ai14 mice labeled with RVΔL-Cre at 6 months postinjection. Cells still appear morphologically completely normal. Scale bars: 200 μm (left) and 2 μm (right). (D) Quantification of the total number of basal dendritic spines per μm in RVΔL-Cre-infected corticothalamic neurons between 4 weeks and 6 months after rabies infection. There was no significant difference between the spine densities at the two different survival times (single-factor ANOVA, p = 0.26312, 4 weeks: n = 14 FOVs of 2 Ai14 mice; 6 months: n = 15 FOVs of 2 Ai14 mice; see Data S1 for counts and statistics). (E–H) Efficacy comparison of Flpo- and Cre-expressing ΔGL and ΔL vectors. (E) Corticothalamic neurons in S1 of Ai65F mice labeled with RVΔGL-Flpo (left) or RVΔL-Flpo (center) at 1 week postinjection. Scale bar: 200 μm, applies to both images. Counts of labeled cortical neurons are shown on the right (each data point is the total number in one series consisting of every sixth 50 μm section from a given brain—see STAR Methods—so that the total number of labeled S1 neurons in each brain would be approximately six times the corresponding number shown here). The ΔL virus labeled 24 times as many cortical neurons than the ΔGL virus did, although the difference in this case is not significant due to high variance (single-factor ANOVA, p = 0.0608, n = 8 mice per group). (F) Corticothalamic neurons in S1 of Ai65F mice labeled with RVΔGL-Flpo (left) or RVΔL-Flpo (center) at 4 weeks postinjection. Scale bar: 200 μm, applies to both images. Counts of labeled cortical neurons are shown on the right. The ΔL virus labeled 6.25 times as many cortical neurons as the ΔGL virus did, an extremely significant difference (single-factor ANOVA, p = 0.000321, n = 8 mice per group). (G) Corticothalamic neurons in S1 of Ai14 mice labeled with RVΔGL-Cre (left) or RVΔL-Cre (center) at 1 week postinjection. Scale bar: 200 μm, applies to both images. Counts of labeled cortical neurons are shown on the right. The ΔL virus labeled 1.4 times as many cortical neurons as the ΔGL virus did, a highly significant difference (single-factor ANOVA, p = 0.00420, n = 4 mice per group). (H) Corticothalamic neurons in S1 of Ai14 mice labeled with RVΔGL-Cre (left) or RVΔL-Cre (center) at 4 weeks postinjection. Scale bar: 200 μm, applies to both images. Counts of labeled cortical neurons are shown on the right. The ΔL virus labeled 1.25 times as many cortical neurons as the ΔGL virus did, an extremely significant difference (single-factor ANOVA, p = 0.000738, n = 4 mice each group).
Figure 3
Figure 3
Differential tropism of ΔL rabies virus, rAAV2-retro, and CAV-2 RVΔL-Cre, rAAV2-retro-hSyn-Cre (from Addgene), or CAV-Cre (from the Plateforme de Vectorologie de Montpellier) was injected undiluted into the cortical anterior cingulate area (ACA) of reporter mice, with injections being of equal volumes (200 μL); after a 4 week survival time, brain sections were imaged, and labeled neurons in three brain regions were counted. Note that each data point is the total number in one series consisting of every sixth 50 μm section from a given brain (see STAR Methods) so that the total number of labeled neurons in the given region of each brain would be approximately six times the corresponding number shown here. (A) In hippocampus, more neurons were labeled by RVΔL-Cre than by either of the other viruses, although the difference with rAAV2-retro was not quite statistically significant (single-factor ANOVA with Tukey’s multiple comparison test, p = 0.05345). CAV-Cre labeled almost no hippocampal cells. (B) In basolateral amygdala, RVΔL labeled more cells than CAV-2 but fewer cells than rAAV2-retro. (C) In ipsilateral primary motor cortex, RVΔL labeled significantly more cells overall, and significantly more cells in individual layers 2/3, 5, and 6, than either of the other two viruses. RVΔL labeled 2.46 times as many cells as rAAV2-retro and 3.14 times as many cells as CAV-2 (means of 2,661, 1,080, and 846.25 cells, respectively; again note that each count is of labeled neurons found in a series containing every sixth 50 μm section [see STAR Methods]). See Figure S4 for results from similar experiments with the injections in the anteromedial visual area; see also Data S2, S3, S4, S5, S6, and S7 for sets of high-resolution confocal images of series of coronal sections from mice labeled with each of the three viruses for each of the two injection sites. See Data S1 for all counts and statistical comparisons.
Figure 4
Figure 4
Neurons labeled by ΔL rabies virus survive for at least 16 weeks (A) Experimental design for longitudinal structural two-photon imagingin vivo. Second-generation (ΔGL) or third-generation (ΔL) virus expressing Cre was injected in primary visual cortex of reporter mice, and then fields of view near the injection sites were imaged repeatedly for the following 16 weeks (see STAR Methods). (B) Example renderings of the same volume of cortex labeled by RVΔL-Cre and imaged with a two-photon microscope at two different time points, 2 (left) and 10 weeks (right). Every labeled neuron visible at 2 weeks is still present at 10 weeks. Scale bar: 50 μm. See also Video S1. (C and F) Example two-photon images of single FOVs of cortex labeled by either the second-generation vector RVΔGL-Cre (C) or the third-generation vector RVΔL-Cre (F), imaged at different time points, from 1 (top left) to 12 weeks (bottom right). All labeled neurons visible at earlier time points are still present at later ones for both viruses. Scale bars: 50 μm, applies to all images. (D and G) Absolute numbers of cells visibly labeled by RVΔGL-Cre (D) or RVΔL-Cre (G) for all structural FOVs in the study at the 1 and 4 week time points. Numbers of visibly labeled cells increased by 56.27% for ΔGL and by 67.77% for ΔL, as we found previously for second-generation vectors, suggesting accumulation and persistent activity of recombinase on this timescale. These increases were both extremely significant (one-tailed paired t tests, p = 0.000132 [ΔGL] and 0.00001003 [ΔL], n = 8 FOVs, across 4 mice, for each virus), but there was no significant difference between the increases seen for the two viruses (two-tailed unpaired t test, p = 0.5187, n = 8 FOVs per group). Note that the higher numbers of labeled neurons in the ΔGL case is not meaningful and simply reflects the numbers that happened to be present in the FOVs selected quasi-randomly on the basis of sufficient sparsity to allow resolution of individual neurons. (E and H) Percentages of cells visibly labeled by RVΔGL-Cre (E) and RVΔL-Cre (H) over time, relative to the numbers visible at 1 week after rabies injection; each connected set of dots represents numbers seen in a given FOV at the different time points. For both viruses, the numbers of labeled neurons remain nearly constant from the 4 week time point onward, as we found previously for the ΔGL virus. Imaging was discontinued for some mice at week 12 or 14 due to cloudiness of the optical windows. Each dot in (D) and (E) and in (G) and (H) represents one of the 8 FOVs, across 4 mice, for each virus.
Figure 5
Figure 5
Membrane properties of basolateral amygdalar neurons retrogradely labeled by rAAV2-retro and ΔL rabies virus (A) Experimental design. rAAV2-retro-hSyn-Cre or RVΔL-5Cre was injected into the nucleus accumbens of reporter mice. 4 or 12 weeks after injection, brain slices were prepared for whole-cell patch-clamp recordings from labeled cells in the basolateral amygdala (BLA). (B) Confocal images of BLA neurons labeled by the two viruses following the two survival times. (C–G) None of the four groups (two viruses, two survival times) differed significantly from the others in any of the measured membrane properties: resting membrane potential (C), membrane capacitance (D), rheobase (E), input resistance (F), or action potential number vs. input current (G). Each dot in (C)–(F) represents the value for a single recorded BLA neuron. Dots and error bars in (G) represent the mean (±SEM) firing frequencies in response to a series of current injections ranging from 0 to 350 pA in increments of 50 pA. 3 mice were used per experimental group, with numbers of recorded neurons as follows: ΔL 4 weeks: 25 cells from 9 slices; ΔL 12 weeks: 28 cells from 10 slices; AAV 4 weeks: 28 cells from 9 slices; AAV 12 weeks: 27 cells from 9 slices. See STAR Methods, quantification and statistical analysis, for details of comparisons.
Figure 6
Figure 6
Imaging of ΔL-labeled neurons’ visual response properties over 16 weeks (A) Experimental design for longitudinal functional two-photon imagingin vivo. ΔL virus expressing Cre was injected in the primary visual cortex of reporter mice expressing GCaMP6s after Cre recombination, and then the injection sites were imaged while the awake mice were presented with drifting grating stimuli of different orientations and temporal frequencies repeatedly for 16 weeks following virus injection. (B) Example FOV from a GCaMP6s imaging session 16 weeks after RV injection. Individual analyzed cells are randomly pseudocolored. Scale bar: 50 μm. (C and D) Long-term stability of orientation and temporal frequency tuning in RVΔL-Cre-labeled neurons. The top rows show maximum intensity projections of the imaged GCaMP6s signal in two different FOVs at three different time points for each FOV. Scale bars: 20 μm, apply to all images. Visual response tuning curves of the two circled cells in each FOV at the corresponding time point, obtained with drifting gratings presented at 12 directions of motion and 5 temporal frequencies (TFs) (mean ΔF/F ± SEM, averaged over 10 repeats), are shown under each image. (E) Percentages of labeled cells that were visually tuned (see STAR Methods) from 6 different FOVs in 3 mice imaged over 14 weeks. Connected sets of dots in a given color indicate data from a single mouse (data from 2 FOVs are shown per mouse). (F) Comparison of the percentages of labeled cells that were visually tuned at 2 and 14 weeks. The percentages increased moderately but significantly between the two time points from 60% to 68% (paired two-sample t test, p = 0.0178, n = 6 FOVs across 3 mice). (G) Although in general we were not able to track individual neurons over multiple imaging sessions due to limitations of our imaging capabilities, in some cases, we were able to do so. This graph shows the numbers of cells that were tuned at 4 weeks that were identifiable at 14 weeks and that were still tuned at that later time point: 94% of these neurons were still tuned at 14 weeks. Each dot represents the number of such cells within each FOV (n = 6 FOVs across 3 mice).
See this image and copyright information in PMC

Comment in

Similar articles

See all similar articles

Cited by

References

    1. Wickersham I.R., Finke S., Conzelmann K.K., Callaway E.M. Retrograde neuronal tracing with a deletion-mutant rabies virus. Nat. Methods. 2007;4:47–49. doi: 10.1038/nmeth999. - DOI - PMC - PubMed
    1. Wickersham I.R., Lyon D.C., Barnard R.J.O., Mori T., Finke S., Conzelmann K.K., Young J.A.T., Callaway E.M. Monosynaptic restriction of transsynaptic tracing from single, genetically targeted neurons. Neuron. 2007;53:639–647. doi: 10.1016/j.neuron.2007.01.033. - DOI - PMC - PubMed
    1. Wall N.R., Wickersham I.R., Cetin A., De La Parra M., Callaway E.M. Monosynaptic circuit tracing in vivo through Cre-dependent targeting and complementation of modified rabies virus. P Natl Acad Sci USA. 2010;107:21848–21853. doi: 10.1073/pnas.1011756107. - DOI - PMC - PubMed
    1. Jin L., Sullivan H.A., Zhu M., Lavin T.K., Matsuyama M., Lea N.E., Xu R., Hou Y., Rutigliani L., Pruner M., et al. Long-term labeling and imaging of synaptically-connected neuronal networks <em>in vivo</em> using nontoxic, double-deletion-mutant rabies viruses. bioRxiv. 2021 doi: 10.1101/2021.12.04.471186. Preprint at. - DOI
    1. Chatterjee S., Sullivan H.A., MacLennan B.J., Xu R., Hou Y., Lavin T.K., Lea N.E., Michalski J.E., Babcock K.R., Dietrich S., et al. Nontoxic, double-deletion-mutant rabies viral vectors for retrograde targeting of projection neurons. Nat. Neurosci. 2018;21:638–646. doi: 10.1038/s41593-018-0091-7. - DOI - PMC - PubMed

Publication types

MeSH terms

Related information

Grants and funding

LinkOut - more resources

Full text links
Elsevier Science full text link Elsevier Science Free PMC article
Cite
Send To

NCBI Literature Resources

MeSHPMCBookshelfDisclaimer

The PubMed wordmark and PubMed logo are registered trademarks of the U.S. Department of Health and Human Services (HHS). Unauthorized use of these marks is strictly prohibited.


[8]ページ先頭

©2009-2025 Movatter.jp