Movatterモバイル変換


[0]ホーム

URL:


Skip to main page content
U.S. flag

An official website of the United States government

Dot gov

The .gov means it’s official.
Federal government websites often end in .gov or .mil. Before sharing sensitive information, make sure you’re on a federal government site.

Https

The site is secure.
Thehttps:// ensures that you are connecting to the official website and that any information you provide is encrypted and transmitted securely.

NIH NLM Logo
Log inShow account info
Access keysNCBI HomepageMyNCBI HomepageMain ContentMain Navigation
pubmed logo
Advanced Clipboard
User Guide

Full text links

American Chemical Society full text link American Chemical Society Free PMC article
Full text links

Actions

Review
.2023 Feb 8;123(3):1040-1102.
doi: 10.1021/acs.chemrev.2c00580. Epub 2023 Jan 9.

Primary Structure of Glycans by NMR Spectroscopy

Affiliations
Review

Primary Structure of Glycans by NMR Spectroscopy

Carolina Fontana et al. Chem Rev..

Abstract

Glycans, carbohydrate molecules in the realm of biology, are present as biomedically important glycoconjugates and a characteristic aspect is that their structures in many instances are branched. In determining the primary structure of a glycan, the sugar components including the absolute configuration and ring form, anomeric configuration, linkage(s), sequence, and substituents should be elucidated. Solution state NMR spectroscopy offers a unique opportunity to resolve all these aspects at atomic resolution. During the last two decades, advancement of both NMR experiments and spectrometer hardware have made it possible to unravel carbohydrate structure more efficiently. These developments applicable to glycans include, inter alia, NMR experiments that reduce spectral overlap, use selective excitations, record tilted projections of multidimensional spectra, acquire spectra by multiple receivers, utilize polarization by fast-pulsing techniques, concatenate pulse-sequence modules to acquire several spectra in a single measurement, acquire pure shift correlated spectra devoid of scalar couplings, employ stable isotope labeling to efficiently obtain homo- and/or heteronuclear correlations, as well as those that rely on dipolar cross-correlated interactions for sequential information. Refined computer programs for NMR spin simulation and chemical shift prediction aid the structural elucidation of glycans, which are notorious for their limited spectral dispersion. Hardware developments include cryogenically cold probes and dynamic nuclear polarization techniques, both resulting in enhanced sensitivity as well as ultrahigh field NMR spectrometers with a1H NMR resonance frequency higher than 1 GHz, thus improving resolution of resonances. Taken together, the developments have made and will in the future make it possible to elucidate carbohydrate structure in great detail, thereby forming the basis for understanding of how glycans interact with other molecules.


Conflict of interest statement

The authors declare no competing financial interest.

Figures

Figure 1
Figure 1
Schematic representationof glycan structures using the SNFG format(https://www.ncbi.nlm.nih.gov/glycans/snfg.html#nomn):, (a) oligosaccharide Em-1-2-19 isolated from Asianelephant milk, (b) the repeating unitof the O-antigen polysaccharide fromE. coli O187, (c) structure ofTannerella forsythia ATCC 43037 S-layer O-glycan,, (d) structure of thehighly glycosylated Epstein–Barr virus major envelope glycoproteingp350 (PDB 2H6O) in which the N-glycans are shown using3D-SNFG symbols,, based on the previously developed3D-CFG symbols, and (e) sialoglycopeptide(SGP) isolated from yolk of hen eggs.
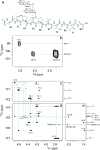
Figure 2
Figure 2
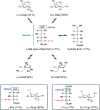
Ring–chain tautomerism ofd-galactoseshowing thepyranose, furanose, open-chain, and hydrate forms (top). Open-chainand α-pyranose forms ofl-arabinose (bottom left).Open-chain and β-pyranose forms ofl-fructose (bottomright). The relative populations of each monosaccharide forms at 30°C (d-Gal andl-Fru) and 31 °C (l-Ara) are shown in parentheses.
Figure 3
Figure 3
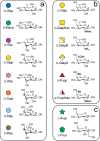
(a) The eightβ-d-aldohexopyranoses (4C1 conformer) shown in chemical representation(right); the stereocenters that differ from those ofd-glucoseare highlighted using colored circles. (b) The β-anomeric andpyranose ring form of selected monosaccharides of thed-galactoseseries shown in chemical representation (right); the moieties thatdiffer from those ofd-galactopyranose are highlighted inbold. (c) The α-pyranose forms ofl-arabinose (aldopentose)andl-fructose (ketohexose) shown in chemical representation(right). In (a–c), the corresponding monosaccharides are alsorepresented in SNFG notation (left).
Figure 4
Figure 4
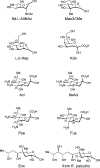
Chemical structures ofthe recently reported novel monosaccharides:N-acetyl6-deoxy-l-altrosamine (6d-l-AltNAc), 3-C-methyl-d-mannose(Man3CMe), acinetaminic acid (Aci), 8-epiacinetaminic acid (8eAci), fusaminic acid (Fus), erwiniose(Erw), and C4-branched monosaccharidefromR. palustris. Notethat Aci is the C5 epimer of pseudaminic acid (Pse), where the latterwas identified in 1984. Ketodeoxyoctonicacid (Kdo) andl-glycero-d-manno-heptose (Hep) are major components of the LPS coreof gram-negative bacteria.
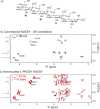
Figure 5
Figure 5
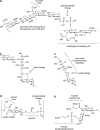
(a) Chemical structure of the secondary cell wall polymer ofPaenibacillus alvei showing the diphosphodiester linkageto the bacterial peptidoglycan. (b)Representation of a selected region of the EPS fromStreptococcusthermophilus, showing the residues that are connected tothe 3,9-dideoxy-d-threo-d-altro-nononicacid moiety., (c) Representation of the open-chaind-GalNAc residue linked to ad-Galp residue via anacetal linkage, as present in the core oligosaccharides ofProteus penneri andShewanella oneidensis., (d) Chemical structure of the WTA ofBacillus subtilis. (e) Selectedregion of the O-antigen polysaccharide ofProteus mirabilis O38 showing theN-acetyl-phosphoethanolamine andN-acetyl-l-aspartic acid substituents.
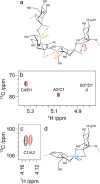
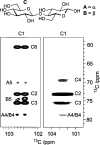
Figure 6
Figure 6
Plotsof13C NMR chemical shifts of common aldohexopyranoses.The marker shapes correspond to the respective monosaccharide SNFGsymbols, whereas the solid and dashed lines are used to differentiatethe α and β configuration, respectively. The anomericpositions (C1), C5, and C6 are annotated in all cases and nitrogen-bearingcarbons (C2) are also indicated in the case of amino sugars.
Figure 7
Figure 7
Representation of the3JH1,H2,3JH2,H3,3JH3,H4, and3JH4,H5 coupling constant values (leftto right, respectively)of β-anomeric and pyranose ring forms of selected monosaccharideswithgluco-,manno-,allo-,galacto-,altro-,talo-, andido-configurations using bar charts.,,− The coupling constants values (Hz) are indicated at the top of eachbar.
Figure 8
Figure 8
Representation of2JCH ofthe α- and β-anomeric and pyranose ring forms of (4C1 conformer) of galactose, glucose,and mannose, where the magnitude of the coupling constants valuescorrelate with the width of the bubbles. The dashed lines indicate2JCH with positive signs.
Figure 9
Figure 9
Component analysis ofthe ST1 exopolysaccharide (EPS) fromStreptococcus thermophilus by derivatization with chiral(S)-(+)-2-methylbutyryl (SMB) groups.1H NMR spectra of the EPS-SMB hydrolysate (bottom),d-galactose-SMB(middle), andd-glucose-SMB (upper). Adapted and reproducedwith permission from ref (191). Copyright 2010 Springer.
Figure 10
Figure 10
Summary of classical NMR experiments used for1H and13C chemical shifts assignments of carbohydrates, anomericconfiguration determination, and sequence analysis; the key correlationsobserved in each spectrum are indicated in red and/or blue color.
Figure 11
Figure 11
Comparison of the anomeric region of the1H,13C-CT-CE-HSQC spectrum (a),13C-decoupled1H,13C-HSQC spectrum (b) and coupled1H,13C-HSQC spectrum (c) of a polysaccharide ofVibrio parahemolyticus AN-16000.
Figure 12
Figure 12
Detailed analysis of strong coupling effects on1JCH values measured in the1H dimension(blue) and13C dimension (red) compared to the value predictedfrom theory. An AHBHXC spin systemis used to simulate 2D coupled1H,13C-HSQC spectra.The measured1JCH values areplotted against (Δν/3JHH).1JAX = 145 Hz,3JAB = 10 Hz, and2JBX = −5 Hz; a dashed black line is drawnat 145 Hz, the1JCH value usedin simulation. A significant discrepancy between1JCH values measured in the1H and13C is found when 3 ≤ (Δν/3JHH) ≤ 12. Reproduced with permissionfrom ref (164). Copyright2011 Elsevier.
Figure 13
Figure 13
Illustration of a1H,13C-heteronuclear “sequentialwalk” in an H2BC spectrum for the assignment process of thecomplete spin system for a 3-substituted β-d-QuiN residuein an oligosaccharide from the LPS ofFrancisella victoria based on the overlaid HSQC (green) and H2BC (red) spectra startingfrom the anomeric H1/C1 cross-peak in the HSQC spectrum via correlationsin the H2BC spectrum to H1/C2, but also to C1/H2, all the way to theH6/C6 cross-peak of the methyl group. Reproduced with permission fromref (267). Copyright2011 Elsevier.
Figure 14
Figure 14
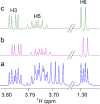
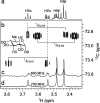
(a) Selected regions of the1H NMRspectrum of rutinose,α-l-Rhap-(1→6)-d-Glcp. (b) The corresponding regions of the 1D1H,1H-CSSF-TOCSY spectrum in which the H6 resonance of rhamnoseat 1.290 ppm was targeted. The mixing time used was 80 ms. (c) Thecorresponding 1D1H,1H-CSSF-TOCSY spectrum inwhich the H6 resonance of rhamnose at 1.295 ppm was targeted. Theintensities of the H6 resonances are reduced relative to those fromthe ring protons. Reproduced with permission from ref (279). Copyright 2011 ElsevierPublisher.
Figure 15
Figure 15
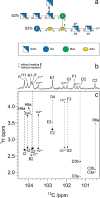
(a) Structure of thedeacylated R-LPS ofBrucella melitensis strain Bm_wbkD in SNFG format. (b) Selectedsection of the anomeric region of the13C NMR spectrumand (c) band-selective constant-time1H,13C-HMBCspectrum recorded over a spectral regionof 5.4 ppm × 9.0 ppm with 2048 × 256 data points, usinga selective13C excitation pulse applied at the centerof the region for anomeric carbons.
Figure 16
Figure 16
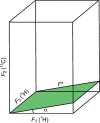
Schematic representationof a 3D1H,1H-NOESY-1H,13C-HSQC NMR spectrum, where theF2 axisdisplays the carbon-13 frequencies and the tiltedplaneF*/F3 containscontributions from both1H and13C NMR chemicalshifts, thereby resolving spectral overlap present in a regular 2DNMR spectrum. Adapted with permission from ref (287). Copyright 2007 ElsevierPublisher.
Figure 17
Figure 17
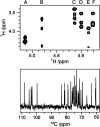
Spectra from a PANSY NMR experiment utilizing dual receivers.The1H,1H-TOCSY spectrum, resulting from a 120ms isotropicmixing time in the experiment, shows correlations from the six anomericprotons of the repeating unit in the ST1 EPS fromStreptococcusthermophilus (top). During the spin-lock time, a separateone-dimensional13C experiment with proton decoupling wasacquired (bottom). Reproduced with permission from ref (191). Copyright 2010 SpringerPublisher.
Figure 18
Figure 18
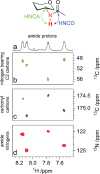
(a) The amide protonregion of the1H NMR spectrum ofthe13C-enriched O-specific polysaccharide fromE. coli O142. Selected regions of the (b)1H,13C plane of the 3D BEST-HNCA, (c)1H,13C plane of the 3D BEST-HNCO, and (d)1H,15N-SOFAST-HMQCspectra showing correlations from the amide protons. Adapted and reproducedwith permission from ref (148). Copyright 2014 Springer.
Figure 19
Figure 19
1H,13C-ASAP-HSQC NMR spectrum ofa 200 mMmaltose sample in D2O. The experiment was acquired in ∼7 min using one scan pert1 incrementand 15% NUS sampling. The spectrum was processed using compressedsensing, linear prediction as well as zero filling. The high resolutionthus obtained allows for the distinction of cross-peaks from 9α/βand from 11α/β of maltose, which both are approximately3 Hz apart. Reproduced with permission from ref (298). Copyright 2017 Elsevier.
Figure 20
Figure 20
1H,13C-ASAP-HSQC-TOCSY spectrumof a 250 mMstachyose sample in D2O for which 512  ×  1024(t2,t1) datapoints were recorded. The experiment was acquired using one scan pert1 increment in ∼ 3.5 min and processedto give a digital resolution in the indirect dimension of 3.7 Hz.The patterns of correlation for the four sugars are highlighted withthe color code given next to the structure of stachyose. Reproducedwith permission from ref (300). Copyright 2019 Elsevier.
Figure 21
Figure 21
NMR by ordered acquisition using1H-detection (NOAH-4)supersequence BSCR records 2D spectra in a single experiment: (B)1H,13C-HMBC, (S) multiplicity-edited1H,13C-HSQC (cross-peaks from hydroxymethyl groups, atδC < 67, are shown in blue color), (C)1H,1H-COSY, and (R)1H,1H-ROESY witha mixing time of 300 ms (cross-peaks from dipolar interactions areshown in red color). The tetrasaccharide stachyose with a concentrationof 48 mM in D2O was used for the experiment, which wasperformed in 22 min on a 600 MHz NMR spectrometer equipped with acryoprobe.
Figure 22
Figure 22
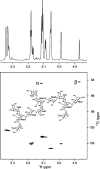
1H NMR analysis at 700 MHz ofd-Qui(6-deoxy-d-glucose) in D2O 70 °C. The monosaccharideis present in the pyranose ring form with an anomeric α:βratio of 1:2. Highlighted regions of (a) the experimental pure shift1H spectrum (black), (b) the experimental1H spectrum(blue), and (c) the corresponding simulated1H spectrumby total-line shape analysis using the PERCH NMR software (red). Reproducedwith permission from ref (140). Copyright 2013 Elsevier.
Figure 23
Figure 23
(a) Selected region of the 1D1H NMR spectrumofd-Quip showing the H2 and H3 resonancesofthe α-anomeric form (minor) and H3 and H5 resonances of theβ-anomeric form (major). (b) Selected region of the13C-coupled1H,13C-HSQC spectrum showing one-bondproton–carbon correlations from the H2α, H3α, andH5β protons. The spectra of (a,b) were both recorded at a1H frequency of 600 MHz. In the 2D NMR spectrum, strong couplingartifacts are observed for the higher frequency component of the13C-coupled H2α resonance, and the lower frequency componentof the13C-coupled H3α resonance; these respectivesignals are3J coupled to H3α andH2α protons attached to12C atoms (see dashed lines).Note that this strong coupling phenomenon occurs at this specificmagnetic field because Δ(νH3α –νH2α) ∼1JC3α,H3α/2 ∼1JC2α,H2α/2. Comparison of pure shift1H NMR spectra recorded at a1H frequency of 600 MHz (c)and 700 MHz (d) using the ZS real-time BIRD pulse sequence describedby Aguilar et al., employing 64 datachunks; the spectral region is the same as that in (a). Note thatin the pure shift1H spectrum of (c), the H2 and H3 resonancesof α-d-Quip are not fully homodecoupleddue to strong coupling effects mentioned above.
Figure 24
Figure 24
Selected regions of1H,13C-HSQCspectra ofd-fucose in D2O: (a) conventional gHSQCand (b) real-timepure shift gHSQC. 1D traces are integral projections onto theF2 (1H) axis. Reproduced with permissionfrom ref (339). Copyright2013 Wiley.
Figure 25
Figure 25
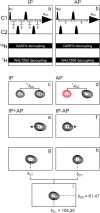
Graphic representationof (a) in-phase (IP) and (b) antiphase (AP)schemes employed in the virtual decoupling of the13C,13C-TOCSY spectrum of the13C-enriched O-antigenPS ofE. coli O142, whereT = 1/4·1JCC. Selected region of the IP (c) and AP (d)13C,13C-TOCSY spectra (τm = 20 ms) showingthe cross-peak correlation between the C6 and C1 of the β-d-GlcpNAc residue. In (d) the cross-peak inred color has an opposite sign than the cross-peak indicated in black.(e,f) Spectra resulting from the linear combinations of the IP andAP spectra of (c,d). The cross-peaks are then shifted downfield (e)and upfield (f) by 0.5·1JCC; the resulting spectra (g and h, respectively) are added up to achievethe homonuclear virtual decoupled spectrum (i).
Figure 26
Figure 26
Overlay of selected regions of13C,13C-TOCSYspectra (τm = 20 ms) of the13C-enrichedO-antigen PS ofE. coli O142 showing correlationsfrom (a) anomeric carbons and (b) nitrogen-bearing C2 carbons. Thespectrum recorded using the IPAP scheme with virtual decoupling of1JC1,C2 in the direct dimensionis shown in red color, whereas the spectrum recorded using the DIPAPscheme with simultaneous decoupling of1JC1,C2 and1JC2,C3 in the direct dimension is shown in cyan color. The classical13C,13C-TOCSY spectrum is shown in gray color.
Figure 27
Figure 27
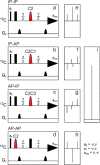
Graphic representation of the double in-phase antiphase(DIPAP)schemes added to the13C,13C-TOCSY experimentfor the virtual decoupling of the1JC1,C2 and1JC2,C3 couplingsof nitrogen bearing C2 carbons resonances. During this experiment, four different spectra (e–h) withdifferent magnetization components (IP-IP, IP-AP, AP-IP, and AP-AP)are obtained after the execution of the respective schemes (a,b).A selective on-resonance refocusing pulse centered at the middle ofthe C2 carbon resonances (∼ 50 ppm) is used during the IP-IPand AP-AP schemes (a and d, respectively). A shaped refocusing on/off-resonancepulse centered at the middle of both the C1 (∼ 100 ppm) andnitrogen bearing C2 resonances (∼ 50 ppm) is used in the IP-APscheme (b). For practical reasons, the on/off-resonance pulse requiredfor the refocusing of the C2 and C3 resonances during the AP-IP scheme(c) can be set at the center of the hexose and hexosamine ring carbonresonances (∼ 62 ppm). Finally, a linear combination of thespectra (e–h) is used to obtain the virtual decoupled spectrum(i).
Figure 28
Figure 28
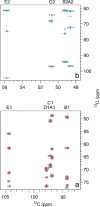
Overlay of the1H,13C-HSQC(black color)and the1H,13C-CT-HSQC spectra (green and redcolor) of [UL-13C]-sucrose, showing the anomeric and ringatoms regions, as well as that of the hydroxymethyl groups (a–c,respectively). The latter spectrum was recorded with a constant timedelay (2T) of 22 ms and the1H chemicalshifts are displaced by −0.045 ppm for clarity; the sign ofthe cross-peaks are opposite for carbons directly attached to an oddversus an even number of neighboring non-carbonyl carbons (shown inred and green color, respectively).
Figure 29
Figure 29
1H,13C-CT-HSQC spectra (2T = 22 ms) of the13C-enriched O-antigen polysaccharidefromE. coli O91 showing the anomeric region (a),the region for the ring atoms and those from the hydroxymethyl groups(b), and the region of the methyl groups (c). Representation of thestructure of the aforementioned polysaccharide in schematic representation(d), where the carbon atoms directly attached to an odd number ofneighboring non-carbonyl carbons are indicated with red dots; in the1H,13C-CT-HSQC spectrum, the cross-peaks from theseatoms have an opposite sign that those from carbons directly attachedto an even number of neighboring non-carbonyl carbons (shown in redand black, respectively in a–c).
Figure 30
Figure 30
(a) Structure of thetetrasaccharide–decapeptide reportedby Šardzík et al. (b–d)Selected regions of the1H,13C-HSQC spectrum(700 MHz), where the correlations from the carbohydrate and peptidemoieties are indicated in black and red color, respectively. (b) Theregion for the side-chain protons of amino acids, H3 of sialic acidand acetyl methyl groups. (c) The region for the ring atoms and hydroxymethylgroups of carbohydrates (highlighted with a dashed line) and thatfor α-protons of amino acids; (d) the anomeric region.
Figure 31
Figure 31
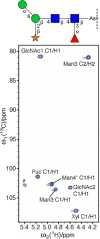
Glycosylation detected by a1H,13C-HSQC NMRspectrum in the denatured plant protein bromelain. The spectral regioncovers cross-peaks from the anomeric resonances of the sugar residuesin the N-linked hexasaccharide, shown by SNFG representation. Notethat the13C NMR chemical shift of the proximal GlcNAcresidue linked to Asn resonates at ∼ 81 ppm, whereas the othersugar residues have their13C chemical shifts for anomericcarbons in the range 101–108 ppm. Adapted and reproduced withpermission from ref (349). Copyright 2015 Wiley.
Figure 32
Figure 32
NMR spectra of terminalGal and/or terminalN-acetylneuraminicacid residues of Fc-conjugated N-glycan show distinct1H,13C-correlations. (A) [UL-13C6]Gal resonances observed in a1H,13C-HSQC spectrumof Gal-terminated Fc. (B) A corresponding spectrum in which the Fchas anN-acetyl-[1,2,3-13C3]neuraminic acid residue attached to the Gal residue of the α-(1→3)-Manbranch in the N-glycan structure. (C)1H,13C-HSQCspectrum of glycosylated Fc domain in which both branches of the N-glycanhave been isotopically labeled with [UL-13C6]Gal andN-acetyl-[1,2,3-13C3]neuraminic acid. (D,E)1H,13C-HSQC spectraof the region for C3–H3 correlations from terminalN-acetylneuraminic acid residues of the α-(1→3/6)-Manbranches. Reproduced with permission from ref (361). Copyright 2012 AmericanChemical Society.
Figure 33
Figure 33
1H,13C-HSQC NMR spectra of IgG1 Fc with a Man5 N-glycan followingaddition of [13C,15N]GlcNAc, denoted by *N inthe glycan name and shown as ablue square with a white star in the SNFG representation. (A) A 2D1H,13C-HSQC spectrum of the *N-Man5 N-glycan followingEndoF1-catalyzed hydrolysis is shown as gray contours. Blue contoursshow the positions of peaks from IgG1 Fc bearing a *N-Man5 N-glycan.1JCC couplings are not resolvedbecause of the limited resolution in the13C dimension.(B) 1D13C-observe NMR spectrum of *N-Man5 Fc with1JCC values indicated. (C) 2D1H,15N-HSQC spectra before and after N-glycan hydrolysiswith the same colors used in (A). Reproduced with permission fromref (362). Copyright2015 American Chemical Society.
Figure 34
Figure 34
Full spectral region(A) and oligosaccharide region (B) of the2D13C,13C-NOESY spectrum of13C-labeledIgG-Fc acquired at 125 MHz with a mixing time of 600 ms and (C)13C,13C-TOCSY spectrum, in which the magnetizationtransfer was performed with the FLOPSY pulse sequence with a mixingtime of 1.2 s. Adapted and reproduced with permission from ref (364). Copyright 2009 Elsevier.
Figure 35
Figure 35
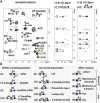
NMR identification of glycan structures on SARS-CoV-2receptorbinding domain (RBD) glycoprotein. (A) Anomeric region of the1H,13C-HSQC spectrum of RBD (left); selected planesfor C1 GalNAc on the 4SulLDN fragment and for C1 GalNAc on 6′SLDNfrom an edited 3D HCCH-TOCSY spectrum showing the correlations toall13C atoms within the pyranose spin system (right).(B) GalNAc, Gal and GlcNAc containing epitopes in N-linked glycanson RBD. Reproduced with permission from ref (366). Copyright 2020 The Authors.
Figure 36
Figure 36
(a) Structure of thedisaccharide–decapeptide reported byŠardzík et al., showingcarbon–proton long-range inter-residue correlations from the1H,13C-HMBC and1H,13C-BS-CT-HMBCspectra. (b) Selected region of the1H,13C-HMBCspectrum showing correlations from anomeric carbons. (c–e)Different regions of the1H,13C-BS-CT-HMBC spectrumshowing correlations from carbonyl carbons.
Figure 37
Figure 37
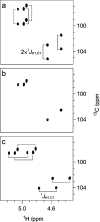
Conventional and L-PROSYNOESY experiments acquired on anN-acetylated α-(2→8)-linkedsialic acid tetramer(a) at 5 °C and 1 GHz. (b) Hydroxyl group region of a conventionalNOESY, optimized with a single mixing time of 100 ms, which is theupper boundary when considering the fast chemical exchange of hydroxylgroups with water; conventional NOESY spectrum shows only short-rangecross-peaks of hydroxyl groups. (c) Homonuclear L-PROSY NOESY spectrumacquired under similar conditions, with 10 loops and 40 ms per loop,yielding an average enhancement of ∼ 4.5× over the conventionalNOESY as well as the multiple new long-range correlations labeledin red. Placed along theF1 axes are thehydroxyl proton regions acquired using 1D excitation sculpting. Adaptedand reproduced with permission from ref (381). Copyright 2021 American Chemical Society.
Figure 38
Figure 38
(a) Representationof the structure of the repeating unit, →4)-α-d-Manp-(1→2)-α-d-Manp-(1→2)-β-d-Manp-(1→3)-α-d-GlcpNAc(1→ , of the O-antigen polysaccharideofEscherichia coli O176, where the dipole pairswhose cross-correlations are observed in the spectrum of (b) are representedin green, orange, and purple colors. Selected regions of the proton–carbondipole–dipole cross-correlated relaxation spectrum (1H,13C-DDCCR) recorded with a constant time period (2T) of 10 ms, showing correlations from (b) anomeric protonsand (c) the anomeric carbon of residue C. (d) Representation of thestructure of the →4)-α-d-Manp-(1→2)-α-d-Manp-(1→moiety of the aforementioned O-specific polysaccharide, where thetwo dipoles whose correlation is observed in the spectrum of (c) areshown in blue color. The asterisk indicates a tentative assignmentdue to spectral overlap.
Figure 39
Figure 39
Selectedregion of the13C,13C-CT-COSY (CT= 11.1 ms) and band-selective13C,13C-TOCSY(τmix = 144 ms) of [UL-13C12]-cellobiose (left and right, respectively), showing intra- and inter-residuecorrelations from the anomeric carbon of the terminal β-d-glucosyl residue in the disaccharide.
Figure 40
Figure 40
(a) Structure of the O-antigen polysaccharide ofE. coli O142 in SNFG notation. Selected regions of (b,c)a1H,13C-CT-HSQC-NOESY (2T =22 ms, τm = 100 ms) and (d) a1H,13C-LR-CT-HSQC(2T = 22 ms, and optimized fornJCH = 20 Hz) spectra of the13C-enriched O-specific polysaccharide fromE. coli O142 showing correlations from anomeric protons. The intensity ofthe cross-peak shown within the green box has been multiplied by afactor of 2. The asterisks denote resonances of minor impurities.
Figure 41
Figure 41
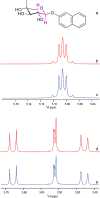
(a) Schematic structureof 2-naphthyl 4-C-methyl-β-d-xylopyranoside.Selected regions from the1H NMRspectrum of the monosaccharide glycoside in methanol-d4 at 37 °C showing the resonance from the anomericproton using (b) NMR spin simulation (PERCH) and (c) from experiment,and resonances from ring protons using (d) NMR spin simulation and(e) from experiment. The1H NMR chemical shift for H2 is3.562 ppm, and that of H3 is 3.560; at temperatures of either 60 or10 °C, the anomeric proton retains its simpledoublet appearance due to the3JH1,H2 coupling constant of 7 Hz.
Figure 42
Figure 42
Schematic diagram ofa combined dynamic nuclear polarization setupfor liquid state NMR spectroscopy. The sample is hyperpolarized inthe cold magnet system (left) and transferred by a stream of hot solventinto the NMR system (right) for data acquisition with improved sensitivity.The magnetic field strength during the transfer of the hyperpolarizedfluid through a magnetic tunnel (black line) or without tunnel (redline) is shown as an insert. Reprinted with permission from ref (455). Copyright 2015 Authors.
Scheme 1
Scheme 1. Enzymatic Transglycosylation Reactions Shown Schematically Usingortho-Nitrophenyl β-d-[1-13C;1-2H]galactopyranoside as the Donor and Galactose As the Acceptor (left) andortho-Nitro-phenyl β-d-Galactopyranoside as Donor andd-[UL-13C;UL-2H]Glucopyranose as Acceptor (right)
Isotope labelingis highlightedby red color. For the latter reaction, the disaccharide products referredto as A, B, and C have the corresponding labels for resonances fromsubstitution positions in dDNP13C NMR spectra; cf. Figure 43. Adapted withpermission from refs ( and 463). Copyright 2018 and 2020 American Chemical Society.
Figure 43
Figure 43
Dissolution dynamic nuclear polarization (dDNP) NMR spectroscopyin which the13C spectra are summed 4–18 s aftertransfer to the NMR tube. (top) Hyperpolarizedd-[UL-13C;UL-2H]glucopyranose without enzyme or donormolecule, (middle) mixed withortho-nitro-phenylβ-d-galactopyranoside and lactozyme 2600L, and (bottom)mixed with the donor andlacZ β-galactosidase.The13C resonances labeled by A, B, and C correspond tothe substitution position in 6-substituted glucose, 4-substitutedglucose, and 3-substituted β-d-glucose, respectively.Reproduced with permission from ref (463). Copyright 2020 American Chemical Society.
Figure 44
Figure 44
Low and medium magneticfields used for1H NMR spectraof methyl β-maltoside in D2O at 26 °C and a1H spectrometer frequency of 60 MHz (top) and 600 MHz (bottom).The1H NMR chemical shift at 3 ppm was set to 0 Hz.
Figure 45
Figure 45
High magnetic field used for1H (a) and1H,13C-HSQC (b) NMR spectra (anomericregion) of the dodecasaccharide(anomeric mixture at the reducing end) in D2O at 25 °Cand a1H spectrometer frequency of 900 MHz. Its structurecorresponds to three repeating units of theSalmonella enteritidis O-antigen with the sequence →3)-α-d-Galp-(1→2)-α-d-Manp-(1→4)-α-l-Rhap-(1→, to which tyvelose (3,6-dideoxy-d-arabino-hexopyranose) groups are α-(1→3)-linkedto each of the mannosyl residues. The rhamnosyl residue at the reducingend of the dodecasaccharide is present as a mixture of anomeric forms.
See this image and copyright information in PMC

References

    1. Flynn R. A.; Pedram K.; Malaker S. A.; Batista P. J.; Smith B. A. H.; Johnson A. G.; George B. M.; Majzoub K.; Villalta P. W.; Carette J. E.; et al. Small RNAs Are Modified with N-Glycans and Displayed on the Surface of Living Cells. Cell 2021, 184, 3109–3124. 10.1016/j.cell.2021.04.023. - DOI - PMC - PubMed
    1. Essentials of Glycobiology, 4th ed.; Varki A., Prestegard J. J., Schnaar R. L., Seeberger P. H., Cummings R. D., Esko J. D., Hart G. W., Aebi M., Mohnen D., Kinoshita T., et al., Eds.; Cold Spring Harbor: New York, 2022. - PubMed
    1. Urashima T.; Asakuma S.; Messer M.. Milk Oligosaccharides. In Comprehensive Glycoscience; Kamerling J. P., Ed.; Elsevier, 2007; Vol. 4, pp 695–724.
    1. Uemura Y.; Asakuma S.; Yon L.; Saito T.; Fukuda K.; Arai I.; Urashima T. Structural Determination of the Oligosaccharides in the Milk of an Asian Elephant (Elephas Maximus). Comp. Biochem. Physiol. Part A 2006, 145, 468–478. 10.1016/j.cbpa.2006.08.001. - DOI - PubMed
    1. Varki A.; Cummings R. D.; Aebi M.; Packer N. H.; Seeberger P. H.; Esko J. D.; Stanley P.; Hart G.; Darvill A.; Kinoshita T.; et al. Symbol Nomenclature for Graphical Representations of Glycans. Glycobiology 2015, 25, 1323–1324. 10.1093/glycob/cwv091. - DOI - PMC - PubMed

Publication types

LinkOut - more resources

Full text links
American Chemical Society full text link American Chemical Society Free PMC article
Cite
Send To

NCBI Literature Resources

MeSHPMCBookshelfDisclaimer

The PubMed wordmark and PubMed logo are registered trademarks of the U.S. Department of Health and Human Services (HHS). Unauthorized use of these marks is strictly prohibited.


[8]ページ先頭

©2009-2025 Movatter.jp