Movatterモバイル変換


[0]ホーム

URL:


Skip to main page content
U.S. flag

An official website of the United States government

Dot gov

The .gov means it’s official.
Federal government websites often end in .gov or .mil. Before sharing sensitive information, make sure you’re on a federal government site.

Https

The site is secure.
Thehttps:// ensures that you are connecting to the official website and that any information you provide is encrypted and transmitted securely.

NIH NLM Logo
Log inShow account info
Access keysNCBI HomepageMyNCBI HomepageMain ContentMain Navigation
pubmed logo
Advanced Clipboard
User Guide

Full text links

Atypon full text link Atypon Free PMC article
Full text links

Actions

Share

.2022 Sep 27;119(39):e2202485119.
doi: 10.1073/pnas.2202485119. Epub 2022 Sep 19.

Human cone elongation responses can be explained by photoactivated cone opsin and membrane swelling and osmotic response to phosphate produced by RGS9-catalyzed GTPase

Affiliations

Human cone elongation responses can be explained by photoactivated cone opsin and membrane swelling and osmotic response to phosphate produced by RGS9-catalyzed GTPase

Vimal Prabhu Pandiyan et al. Proc Natl Acad Sci U S A..

Abstract

Human cone outer segment (COS) length changes in response to stimuli bleaching up to 99% of L- and M-cone opsins were measured with high resolution, phase-resolved optical coherence tomography (OCT). Responses comprised a fast phase (∼5 ms), during which COSs shrink, and two slower phases (1.5 s), during which COSs elongate. The slower components saturated in amplitude (∼425 nm) and initial rate (∼3 nm ms-1) and are well described over the 200-fold bleaching range as the sum of two exponentially rising functions with time constants of 80 to 90 ms (component 1) and 1,000 to 1,250 ms (component 2). Measurements with adaptive optics reflection densitometry revealed component 2 to be linearly related to cone pigment bleaching, and the hypothesis is proposed that it arises from cone opsin and disk membrane swelling triggered by isomerization and rate-limited by chromophore hydrolysis and its reduction to membrane-localized all-trans retinol. The light sensitivity and kinetics of component 1 suggested that the underlying mechanism is an osmotic response to an amplified soluble by-product of phototransduction. The hypotheses that component 1 corresponds to G-protein subunits dissociating from the membrane, metabolites of cyclic guanosine monophosphate (cGMP) hydrolysis, or by-products of activated guanylate cyclase are rejected, while the hypothesis that it corresponds to phosphate produced by regulator of G-protein signaling 9 (RGS9)-catalyzed hydrolysis of guanosine triphosphate (GTP) in G protein-phosphodiesterase complexes was found to be consistent with the results. These results provide a basis for the assessment with optoretinography of phototransduction in individual cone photoreceptors in health and during disease progression and therapeutic interventions.

Keywords: cone photoreceptors; opsin bleaching; optical coherence tomography; optoretinogram; photosensitivity.


Conflict of interest statement

The authors declare no competing interest.

Figures
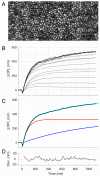
Fig. 1.
Fig. 1.
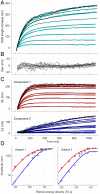
Light exposures that bleach large fractions of cone opsins generate rate- and amplitude-saturated COS elongation responses. (A) OCT en face image of a portion of the temporal retina of subject 1 at 7° eccentricity that was stimulated with brief bleaching exposures. Each light dot corresponds to a single cone. Changes in COS OPL (ΔOPL) were measured with OCT from 247 cones at 30 Hz and averaged. (B) Kinetics of average ΔOPL in response to light exposures ranging ∼200-fold in retinal energy density; the most intense stimulus is estimated to isomerize (bleach) more than 90% of the L- and M-cone opsins (cfSI Appendix, Fig. S2). The responses to the four most intense stimuli are nearly identical and are plotted as black traces, while the responses to lower-intensity stimuli are plotted in gray. Each trace is an average of two to four repetitions, with 4 to 5 min of dark adaptation in between stimuli. (Additional experiments with longer recording durations showed that the slope of the saturating traces at 2 s was effectively zero and also further quantified rate saturation [SI Appendix, Fig. S1 and section 1].) (C) The average (black trace) of the four rate- and amplitude-saturated traces ofB was fitted by least squares (MATLAB; lsqcurvefit) with the sum (cyan) of two rising exponential functions. The time constants and asymptotic amplitudes of the two functions are τ1 = 78 ms, ΔOPL1(∞) = 323 nm (red) and τ2 = 980 ms, ΔOPL2(∞) = 332 nm (blue), respectively. (D) Residual deviations of the data trace inC from the fitted curve plotted on an expanded ordinate scale; the root mean square (RMS) deviation of the data (black) trace from the fitted curve (cyan) inC is 3.9 nm. For similar saturated data from subject 2, the parameters describing the two components were τ1 = 92 ms, ΔOPL1(∞) = 350 nm and τ2 = 1,200 ms, ΔOPL2(∞) = 238 nm, respectively, and the RMS deviation was 4.6 nm. (Changes in the physical length of the COS are obtained by the relationΔLCOS=ΔOPL/nCOS, wherenCOS = 1.41 is the refractive index of the COS.)
Fig. 2.
Fig. 2.
COS elongation responses can be decomposed into sums of the same two exponentially rising components over the full-intensity range of the responses. (A) Response family from Fig. 1B converted to COS physical length changeΔL(t)=ΔOPL(t)/nCOS withnCOS = 1.41, the refractive index of the COS, and fitted with weighted sums of the two exponentially rising components extracted from the fitting of the saturated COS elongation response (Fig. 1C). (B) Deviations of the traces inA from the fitted curves; the average RMS deviation is 4.1 nm. For a similar family of responses for subject 2 analyzed in the same manner, the average RMS deviation was 4.6 nm. (C) Reconstruction of components 1 and 2. InC,Upper, theoretical component 2 was subtracted from each data trace, and the residual data trace (black) was plotted along with theoretical component 1 (red traces) extracted in the fitting procedure used to generateA. InC,Lower, theoretical component 1 was subtracted from the data traces, and the residuals (black traces) were plotted along with component 2 theory traces (blue). (D) Dependence of the amplitudes of component 1 (red circles) and component 2 (blue circles) on the retinal energy density for two subjects. For subject 1, the analysis used to extract the amplitudes from the traces is illustrated inAC; a similar response family was measured and analyzed for subject 2. The extracted amplitudes of component 1 (red symbols) are fitted with a hyperbolic saturation function,R/RComp1,max=Q/(Q+Q50), and those of component 2 are fitted with an exponential saturation function,R/RComp2,max=1exp(Q/Qe); the parameter values of the saturation functions of the two subjects’ data areRComp1, max = 229 nm,Q50 = 8.9 × 10⁵ Td s,RComp2, max = 235 nm, andQe = 4.8 × 10⁶ Td s for subject 1 andRComp1, max = 248 nm,Q50 = 1.2 × 10⁶ Td s,RComp2, max = 170 nm, andQe = 3.1 × 10⁶ Td s for subject 2. In the small signal regime, the amplitudes of both components scale linearly with retinal energy density, and so, they can be characterized by their “rate gain,”γi=ΔV0ΔI=Ri,maxτiQi, whereV0=dRdt|t0 is the initial velocity of the response,ΔI is the energy density (Troland seconds),Ri, max is the saturated amplitude of the component (i = 1, 2), τi the time constant of the exponential rise, and1/Qi=1/Q50 or 1/Qe is the photosensitivity of the component. The ratioγ1/γ2 of the rate gains is 63 for subject 1 and 54 for subject 2.
Fig. 3.
Fig. 3.
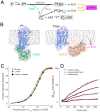
Opsin and disk membrane swelling caused by chromophore isomerization, hydrolysis, and conversion to at-ROL may account for component 2 of the COS elongation response. (A) State space and flow schematic of reactions governing deactivation of photoisomerized cone pigment (photoactivated cone pigment [P*] = Meta II cone opsin) and production of at-ROL. At the high bleach levels that give rise to component 2, phosphorylation of P* by GRKs (including [G-protein receptor kinase] GRK1 and GRK7) is predictably saturated, and binding to PnPi of arrestin (ARR) (including ARR1 and ARR7) is limited by the relatively small amount of ARR in the dark-adapted COS, so that hydrolysis of all-trans retinal chromophore becomes the dominant pathway of P* deactivation (58). RDH (RDH8 and possibly, other RDHs) is hypothesized to form a transient complex with P* to which hydrolyzed at-RAL may be weakly bound (86) and catalyzes the reduction of at-RAL to at-ROL with cofactor NADPH. (The phosphatase [P’ase] reaction, included for completeness, is unlikely to be material on the timescale of the experiments [i.e., a few seconds].) (B) Molecular structures of two key states in the scheme ofA. (B,Left) GK1 bound to P* (83). (B,Right) Lipid-anchored RDH8 associates transiently with unliganded cone opsin (Pops), to whose intramembrane surface at-RAL is thought to weakly associate (86); at-RAL must diffuse to the membrane–cytosol interface and position its aldehyde group for RDH-catalyzed reduction to at-ROL. at-ROL is oriented with its dipole axis parallel to the membrane lipids (87) and should preferentially remain with its alcohol group near the membrane surface (18). (C) Predicted average bleaching of M and L opsin in situ in the whole COS by the stimuli used in the OCT experiments of Figs. 1 and 2 expressed in the units of energy density at the COS waveguide entrance (green and red symbols indicate M and L pigments, respectively, which are slightly differentially bleached due to their different absorption spectra). The thicker black line plotsSI Appendix, Eq.S2.6, the fraction bleached over the whole COS given as the exponential approximation to the solution ofSI Appendix, Eq.S2.4′, while the thin black line plots bleaching at the COS waveguide entrance (SI Appendix,Eq. 2.5), where 1/αmaxγ = 1.38 × 10⁸ photons μm−2 is the photosensitivity of cone opsin in situ at the pigment λmax andfDens = 0.79 (SI Appendix, Table S1). (The black symbols plot the average of the M- and L-opsin values used in the model.) (D) Kinetic predictions of the model. The black traces replot a subset of the extracted component 2 traces along with the fitted exponential curves (red) of Fig. 2 and the model traces (magenta). The black filled circles inC show the bleach levels for the specific stimuli corresponding to the traces. The topmost data trace is the saturated component 2 response; its asymptotic level is 200 nm, but this is not reached on this time base (cfSI Appendix, section 1).
Fig. 4.
Fig. 4.
Reactions governing the production of Pi by RGS9-catalyzed GTP hydrolysis and Pi recycling by GAPDH in the glycolytic cycle can explain the light sensitivity, kinetics, and magnitude of component 1 of the COS elongation response. (A) State space and flow schematic of phototransduction reactions leading to the production of Pi. The pale green rectangle in the upper left portion of the schematic highlights the cycle by which the isomerized G protein coupled receptor (GPCR) P* catalytically activates its G protein, producing G* (Gtα–GTP). The blue-box regions highlight reactions involving G* and phosphodiesterase (PDE dimer) in six distinct states, depending on binding partners:E0, unliganded/inactive;E1*, partially activated by binding of one G*;E2*, fully activated by binding of two G*;E1*•RGS9,E1* with one RGS9 complex bound;E2*•RGS9,E2* with one RGS9 complex attached;E2*•2RGS9,E2* with two RGS9s bound. For lower-intensity stimulation, the reactions in the dark gray rectangle predominate; as intensity increases to the extreme levels of the optoretinography (ORG) experiments, the increased production of G* drives the reactions to the right (the lighter gray region of the diagram). (B) Molecular structures of the three complexes that generate Pi (cyan highlights) by RGS9-catalyzed GTP hydrolysis of Gtcα–GTP bound to a PDE6 catalytic subunit:E1*•RGS9,E2*•RGS9, andE2*•2RGS9. (InA, the dashed arrows show the possible paths arising from G* dissociation from the three complexes without GTP hydrolysis, and the colored rectangles serve to visually isolate portions of the reaction scheme.) (C andD) Predictions of the reaction scheme. The scheme was embodied in a system of ordinary differential equations and solved for different flash strengths (SI Appendix, section 4). InC, the predicted maximum level of ΔPi for a subset of intensities (cyan-filled circles) is compared with an empirical hyperbolic saturation function (red curve) that describes the amplitude of component 1 when plotted as a function of the number of photoisomerizations (Φ) per COS. Φ = 1.2 × 10⁷ photoisomerizations corresponds to an equimolar quantity of P* and total G protein (i.e., one P* for every G protein in the COS). InD, the component 1 responses (black traces) to this subset of intensities are plotted along with the exponentials originally fitted to them (red traces) (Fig. 2C) and the increases in Pi, ΔPi(t) (cyan traces), predicted by the model (the measured traces for the two most intense flashes were effectively indistinguishable and were averaged). Symbols inD plot the maximal amplitudes of the model traces (cyan). Note thatC andD share the same ordinate scale and units.
See this image and copyright information in PMC

Similar articles

See all similar articles

Cited by

See all "Cited by" articles

References

    1. Lim L. S., Mitchell P., Seddon J. M., Holz F. G., Wong T. Y., Age-related macular degeneration. Lancet 379, 1728–1738 (2012). - PubMed
    1. de Jong P. T., Age-related macular degeneration. N. Engl. J. Med. 355, 1474–1485 (2006). - PubMed
    1. Drexler W. F., Optical Coherence Tomography (Springer International, 2015).
    1. Fujimoto J. G. H., Foreword: 25 years of optical coherence tomography. Invest. Ophthalmol. Vis. Sci. 57, 2 (2016). - PubMed
    1. Roorda A., Williams D. R., The arrangement of the three cone classes in the living human eye. Nature 397, 520–522 (1999). - PubMed

Publication types

MeSH terms

Substances

Related information

Grants and funding

LinkOut - more resources

Full text links
Atypon full text link Atypon Free PMC article
Cite
Send To

NCBI Literature Resources

MeSHPMCBookshelfDisclaimer

The PubMed wordmark and PubMed logo are registered trademarks of the U.S. Department of Health and Human Services (HHS). Unauthorized use of these marks is strictly prohibited.


[8]ページ先頭

©2009-2025 Movatter.jp