Movatterモバイル変換


[0]ホーム

URL:


Skip to main page content
U.S. flag

An official website of the United States government

Dot gov

The .gov means it’s official.
Federal government websites often end in .gov or .mil. Before sharing sensitive information, make sure you’re on a federal government site.

Https

The site is secure.
Thehttps:// ensures that you are connecting to the official website and that any information you provide is encrypted and transmitted securely.

NIH NLM Logo
Log inShow account info
Access keysNCBI HomepageMyNCBI HomepageMain ContentMain Navigation
pubmed logo
Advanced Clipboard
User Guide

Full text links

HighWire full text link HighWire Free PMC article
Full text links

Actions

Share

Randomized Controlled Trial
.2022 Oct 26;42(43):8113-8124.
doi: 10.1523/JNEUROSCI.0836-22.2022. Epub 2022 Sep 15.

Pharmacological Manipulations of Physiological Arousal and Sleep-Like Slow Waves Modulate Sustained Attention

Affiliations
Randomized Controlled Trial

Pharmacological Manipulations of Physiological Arousal and Sleep-Like Slow Waves Modulate Sustained Attention

Elaine Pinggal et al. J Neurosci..

Abstract

Sustained attention describes our ability to keep a constant focus on a given task. This ability is modulated by our physiological state of arousal. Although lapses of sustained attention have been linked with dysregulations of arousal, the underlying physiological mechanisms remain unclear. An emerging body of work proposes that the intrusion during wakefulness of sleep-like slow waves, a marker of the transition toward sleep, could mechanistically account for attentional lapses. This study aimed to expose, via pharmacological manipulations of the monoamine system, the relationship between the occurrence of sleep-like slow waves and the behavioral consequences of sustained attention failures. In a double-blind, randomized-control trial, 32 healthy human male participants received methylphenidate, atomoxetine, citalopram or placebo during four separate experimental sessions. During each session, electroencephalography (EEG) was used to measure neural activity while participants completed a visual task requiring sustained attention. Methylphenidate, which increases wake-promoting dopamine and noradrenaline across cortical and subcortical areas, improved behavioral performance whereas atomoxetine, which increases dopamine and noradrenaline predominantly over frontal cortices, led to more impulsive responses. Additionally, citalopram, which increases sleep-promoting serotonin, led to more missed trials. Based on EEG recording, citalopram was also associated with an increase in sleep-like slow waves. Importantly, compared with a classical marker of arousal such as α power, only slow waves differentially predicted both misses and faster responses in a region-specific fashion. These results suggest that a decrease in arousal can lead to local sleep intrusions during wakefulness which could be mechanistically linked to impulsivity and sluggishness.SIGNIFICANCE STATEMENT We investigated whether the modulation of attention and arousal could not only share the same neuromodulatory pathways but also rely on similar neuronal mechanisms; for example, the intrusion of sleep-like activity within wakefulness. To do so, we pharmacologically manipulated noradrenaline, dopamine, and serotonin in a four-arm, randomized, placebo-controlled trial and examined the consequences on behavioral and electroencephalography (EEG) indices of attention and arousal. We showed that sleep-like slow waves can predict opposite behavioral signatures: impulsivity and sluggishness. Slow waves may be a candidate mechanism for the occurrence of attentional lapses since the relationship between slow-wave occurrence and performance is region-specific and the consequences of these local sleep intrusions are in line with the cognitive functions carried by the underlying brain regions.

Keywords: arousal; attention; electroencephalography; neuromodulation; sleep; vigilance.

Copyright © 2022 the authors.


Figures

Figure 1.
Figure 1.
Experimental protocol.a, Each experimental session started with participants being administered one out of four treatments (PLA: placebo; MPH: methylphenidate; ATM: atomoxetine; CIT: citalopram) and completing the first Visual Analog Scale [VAS] (time = 0). The administration of the treatments was randomized across sessions (within-subject design). A second VAS was completed before starting the continuous temporal expectancy task (CTET), 90 min after treatment administration. Finally, after the CTET (and another task not analyzed here) and 180 min after treatment administration, participants completed a third VAS. High-density EEG was recorded during the CTET.b, The CTET task was used to test sustained attention. In the CTET, participants are instructed to monitor a stream of visual stimuli (black and white checkboards) displayed on a screen placed in front of them. There are two types of stimuli: target stimuli for which participants are instructed to press a response button, and nontarget stimuli that do not require a response. The only distinguishing factor between the nontarget and target stimuli is the duration of the stimulus presentation (nontarget: 800 ms; target: 1120 ms).
Figure 2.
Figure 2.
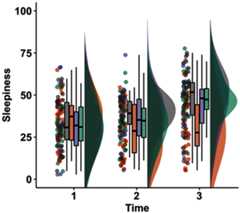
Effect of treatments of subjective sleepiness. Participants were asked to complete a VAS about their subjective sleepiness at three time-points during each recording session: at drug administration (t = 0 min), before the CTET (t = 90 min), and after the CTET (t = 180 min). The raincloud plot (see Materials and Methods) for each drug treatment (placebo PLA: gray, methylphenidate MPH: orange, atomoxetine ATM: purple, citalopram CIT: green) and time is shown.
Figure 3.
Figure 3.
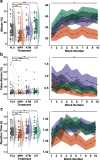
Pharmacological modulations of behavioral performance. Left panels show the sample and individual averages computed across all CTET blocks (N = 10 blocks) for each treatment (placebo PLA:N = 32; citalopram CIT:N = 31; atomoxetine ATM:N = 31; and methylphenidate MPH:N = 32) in the form of raincloud plots (see Materials and Methods). Right panels show the sample averages for each drug treatment and block separately.a, Percentages of missed target trials (misses).b, Percentages of false alarms.c, Averaged reaction times on correctly detected targets. On the left panels, stars denote the significance level (ns: nonsignificant, *p < 0.05, **p < 0.01, ***p < 0.001) of the difference between placebo and the three treatments used in this protocol (MPH vs PLA, ATM vs PLA, CIT vs PLA), as determined by linear mixed-effect models. On the right panels, stars denote the significance level (ns: nonsignificant, *p < 0.05, **p < 0.01, ***p < 0.001) of the interaction between block number and drug treatment, as determined by linear mixed-effect models.
Figure 4.
Figure 4.
ERPs.a, ERPs locked on stimulus offset for target (continuous lines) and nontarget (dashed lines) trials and split by drug treatment (placebo PLA: gray, methylphenidate MPH: orange, atomoxetine ATM: purple, citalopram CIT: green). ERPs are averaged across participants (PLA:N = 32; CIT:N = 31; ATM:N = 31; and MPH:N = 32). ERPs computed on two electrodes are shown: Fz (Frontal, left) and Pz (parietal, right). Colored lines show the sample average and colored areas the SEM. The yellow area ([0, 0.3] s postoffset window) shows the interval of the archetypal P3 used to compute the P3 amplitude (see Materials and Methods).b, Topographical maps of the P3 amplitude (difference of the ERP amplitude between target and nontarget trials and average on a [0, 0.3] s window) for each drug treatment.c, Topographical maps of the statistical differences in P3 amplitude between MPH and PLA (left), ATM and PLA (middle), and CIT and PLA (right). Thet values obtained with pairedt tests for each electrode are shown. Significant clusters of electrodes (pcluster < 0.05) are shown with black dots (cluster-permutation approach; see Materials and Methods). A significant cluster was found only for MPH.
Figure 5.
Figure 5.
SSVEPs. Visual stimuli were flashed at a 25-Hz rate on the screen, entraining neural activity at the same frequency (frequency tagging) and generating Steady-State Visually Evoked Potentials (SSVEPs). This frequency tagging can be observed when computing the power spectrum of the EEG signal and extracting the SNR of the frequency tag (see Materials and Methods).a, SNR by frequency and drug treatment, computed for electrode Cz and across participants (placebo PLA:N = 32; citalopram CIT:N = 31; atomoxetine ATM:N = 31; and methylphenidate MPH:N = 32). A clear peak at 25 Hz (highlighted in yellow) is present for all treatments (PLA: gray, MPH: orange, ATM: purple, CIT: green).b, Topographical maps for the SNR at 25 Hz for each drug treatment.c, Topographical maps of the statistical differences in 25 Hz SNR between MPH and PLA (left), ATM and PLA (middle), and CIT and PLA (right). Thet values obtained with pairedt tests for each electrode are shown. Significant clusters of electrodes (pcluster < 0.05) are shown with black dots (cluster-permutation approach; see Materials and Methods). A significant cluster was found only for MPH.
Figure 6.
Figure 6.
Power of α oscillations. We computed the (PSD) to analyze the impact of treatments on α oscillations, a common marker of physiological arousal. The power of α oscillations was obtained by averaging the log power of the PSD on a [8, 11] Hz window and for each electrode, participant, and drug treatment (placebo PLA:N = 32; citalopram CIT:N = 31; atomoxetine ATM:N = 31; and methylphenidate MPH:N = 32).a, Average PSD for electrode Cz and for each drug treatment (PLA: gray, MPH: orange, ATM: purple, CIT: green). The α power window is highlighted in yellow.b, Topographical maps of α power for each drug treatment.c, Topographical maps of the statistical differences in α power between MPH and PLA (left), ATM and PLA (middle), and CIT and PLA (right). Thet values obtained with pairedt tests for each electrode are shown. Significant clusters of electrodes (pcluster < 0.05) are shown with black dots (cluster-permutation approach; see Materials and Methods). A significant cluster was found only for MPH.
Figure 7.
Figure 7.
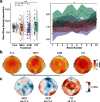
Sleep-like slow waves.a, Slow-wave density (wave/min averaged across all electrodes) per treatment. The raincloud plot for each drug treatment [placebo PLA: gray (N = 32), methylphenidate MPH: orange (N = 32), atomoxetine ATM: purple (N = 31), citalopram CIT: green (N = 31)] is shown in the left panel. Stars denote the significance level (ns: nonsignificant, *p < 0.05, **p < 0.01, ***p < 0.001) of the difference between placebo and the three treatments used in this protocol (MPH vs PLA, ATM vs PLA, CIT vs PLA), as determined by linear mixed-effect models. In the right panel, slow-wave density split by treatment and block (N = 10 blocks) showing the sample average (circle) and SEM (colored areas) across participants is shown. A nonsignificant interaction (ns) between block number and drug treatment was found, as determined by linear mixed-effect models (see Materials and Methods).b, Topographical maps of slow-wave density for each drug treatment.c, Topographical maps of the statistical differences in slow-wave density between MPH and PLA (left), ATM and PLA (middle), and CIT and PLA (right). Thet values obtained with mixed-effect models for each electrode are shown (see Materials and Methods). Significant clusters of electrodes (pcluster < 0.05) are shown with black dots (cluster-permutation approach; see Materials and Methods).
Figure 8.
Figure 8.
Predicting behavioral errors with slow waves and α power. We used slow waves (top row) and α power (bottom row), two complementary markers of physiological arousal, to predict behavioral variables: misses (left), false alarms (middle), and reaction times (right). For each predictor (slow waves or α power) and each behavioral variable (misses, false alarms, and reaction times), we fitted mixed-effect models at the electrode level (see Materials and Methods). Thet values derived from these models and estimating the influence of the predictor on the behavioral variable of interest are shown as topographical maps. Significant clusters of electrodes (pcluster < 0.05) are shown with black dots (cluster-permutation approach; see Materials and Methods). Both α power and slow waves predict behavioral errors, but slow waves do so in a region-specific fashion.
See this image and copyright information in PMC

Similar articles

See all similar articles

Cited by

References

    1. Allen M, Poggiali D, Whitaker K, Marshall TR, van Langen J, Kievit RA (2021) Raincloud plots: a multi-platform tool for robust data visualization. Wellcome Open Res 4:63. 10.12688/wellcomeopenres.15191.2 - DOI - PMC - PubMed
    1. Andrillon T, Windt J, Silk T, Drummond SPA, Bellgrove MA, Tsuchiya N (2019) Does the mind wander when the brain takes a break? Local sleep in wakefulness, attentional lapses and mind-wandering. Front Neurosci 13:949. 10.3389/fnins.2019.00949 - DOI - PMC - PubMed
    1. Andrillon T, Burns A, Mackay T, Windt J, Tsuchiya N (2021) Predicting lapses of attention with sleep-like slow waves. Nat Commun 12:3657. 10.1038/s41467-021-23890-7 - DOI - PMC - PubMed
    1. Arnsten AFT (2000) Through the looking glass: differential noradenergic modulation of prefrontal cortical function. Neural Plast 7:133–146. 10.1155/NP.2000.133 - DOI - PMC - PubMed
    1. Arnsten AF (2010) The use of α-2A adrenergic agonists for the treatment of attention-deficit/hyperactivity disorder. Expert Rev Neurother 10:1595–1605. 10.1586/ern.10.133 - DOI - PMC - PubMed

Publication types

MeSH terms

Substances

Related information

LinkOut - more resources

Full text links
HighWire full text link HighWire Free PMC article
Cite
Send To

NCBI Literature Resources

MeSHPMCBookshelfDisclaimer

The PubMed wordmark and PubMed logo are registered trademarks of the U.S. Department of Health and Human Services (HHS). Unauthorized use of these marks is strictly prohibited.


[8]ページ先頭

©2009-2025 Movatter.jp