Movatterモバイル変換


[0]ホーム

URL:


Skip to main page content
U.S. flag

An official website of the United States government

Dot gov

The .gov means it’s official.
Federal government websites often end in .gov or .mil. Before sharing sensitive information, make sure you’re on a federal government site.

Https

The site is secure.
Thehttps:// ensures that you are connecting to the official website and that any information you provide is encrypted and transmitted securely.

NIH NLM Logo
Log inShow account info
Access keysNCBI HomepageMyNCBI HomepageMain ContentMain Navigation
pubmed logo
Advanced Clipboard
User Guide

Full text links

Nature Publishing Group full text link Nature Publishing Group Free PMC article
Full text links

Actions

Share

.2022 May;605(7910):567-574.
doi: 10.1038/s41586-022-04671-8. Epub 2022 Apr 27.

USP14-regulated allostery of the human proteasome by time-resolved cryo-EM

Affiliations

USP14-regulated allostery of the human proteasome by time-resolved cryo-EM

Shuwen Zhang et al. Nature.2022 May.

Abstract

Proteasomal degradation of ubiquitylated proteins is tightly regulated at multiple levels1-3. A primary regulatory checkpoint is the removal of ubiquitin chains from substrates by the deubiquitylating enzyme ubiquitin-specific protease 14 (USP14), which reversibly binds the proteasome and confers the ability to edit and reject substrates. How USP14 is activated and regulates proteasome function remain unknown4-7. Here we present high-resolution cryo-electron microscopy structures of human USP14 in complex with the 26S proteasome in 13 distinct conformational states captured during degradation of polyubiquitylated proteins. Time-resolved cryo-electron microscopy analysis of the conformational continuum revealed two parallel pathways of proteasome state transitions induced by USP14, and captured transient conversion of substrate-engaged intermediates into substrate-inhibited intermediates. On the substrate-engaged pathway, ubiquitin-dependent activation of USP14 allosterically reprograms the conformational landscape of the AAA-ATPase motor and stimulates opening of the core particle gate8-10, enabling observation of a near-complete cycle of asymmetric ATP hydrolysis around the ATPase ring during processive substrate unfolding. Dynamic USP14-ATPase interactions decouple the ATPase activity from RPN11-catalysed deubiquitylation11-13 and kinetically introduce three regulatory checkpoints on the proteasome, at the steps of ubiquitin recognition, substrate translocation initiation and ubiquitin chain recycling. These findings provide insights into the complete functional cycle of the USP14-regulated proteasome and establish mechanistic foundations for the discovery of USP14-targeted therapies.

© 2022. The Author(s).


Conflict of interest statement

The authors declare no competing interests.

Figures

Fig. 1
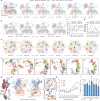
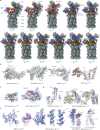
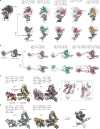
Fig. 1. Time-resolved cryo-EM analysis of the conformational landscape of USP14–proteasome complexes in the act of substrate degradation.
a,b, Cryo-EM density map of the substrate-engaged USP14–proteasome complex in stateED2.1USP14, viewed from the top (a) and side (b).c, Side view of the cryo-EM density map of the substrate-engaged USP14–proteasome complex in stateED4USP14. Compared to the view ofED2.1USP14 inb, USP14 is rotated about 30° to dock onto the AAA domain of RPT1. To visualize the substrate density inside the AAA-ATPase motor, the density of RPT5 is omitted in bothb andc.d, Atomic model of stateED2.1USP14 viewed from the same perspective as ina.e, Kinetic changes of overall particle populations of SD-like and ED-like states versus EA-like states obtained from time-resolved cryo-EM analysis. EA-like states includeEA1UBL,EA2.0UBL andEA2.1UBL. SD-like states includeSBUSP14,SCUSP14SD4USP14 andSD5USP14. ED-like states includeED4USP14,ED5USP14,ED0USP14,ED1USP14,ED2.0USP14 andED2.1USP14. The control consists of previously reported data for substrate-free, USP14-free proteasome.f, Kinetic changes of the particle populations of 13 coexisting conformational states of USP14-bound proteasome from the cryo-EM samples made at different time points after mixing the substrate with the USP14–proteasome complex in the presence of 1 mM ATP at 10 °C. Three substrate-inhibited intermediates (SBUSP14,SCUSP14 andSD4USP14) reach their maximal populations at around 5 min, in contrast to stateSD5USP14 and six substrate-engaged states, which all reach their maximal populations at approximately 1 min. The number of particles used ine andf are provided in Extended Data Fig. 2b, c.
Fig. 2
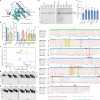
Fig. 2. Structural basis of proteasome-mediated activation of USP14.
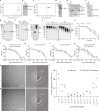
a, Side-chain interactions between the USP14 UBL domain and the RPN1 T2 site in the proteasome stateED2.1USP14.b, Structural comparison of the blocking loops by superimposing the USP14 structure in stateED2.1USP14 with two crystal structures of USP14 in its isolated form (PDB ID: 2AYN) and in complex with ubiquitin aldehyde (UbAl) (PDB ID: 2AYO).c, Magnified view of the ubiquitin–USP–OB sandwich architecture in stateED2.1USP14.d, Local cryo-EM density of the BL1 motif in stateED2.1USP14 in mesh representation superimposed with its atomic model in cartoon representation from two opposite orientations, showing its β-hairpin conformation.eg, Magnified views of the interfaces between the catalytic Cys114 of USP14 and the C-terminal Gly76 of ubiquitin (e), between the USP14 BL1 motif and the RPT1 OB domain (f), and between the USP14 BL3 motif and the RPT2 OB domain (g). Key residues mediating the inter-molecular interactions are shown in stick representation inag.h, In vitro degradation of Ubn–Sic1PY by the human proteasome assembled with USP14 variants at 37 °C, analysed by SDS–PAGE and western blot using anti-T7 antibody to visualize the fusion protein T7–Sic1PY. See Supplementary Fig. 1 for gel source data. These experiments were repeated independently three times with consistent results. The proteasome without USP14 (no USP14; labelled W/O above the leftmost lanes) is used as a negative control. Lanes labelled WT correspond to the proteasome bound to wild-type USP14.i, Ubiquitin–AMC hydrolysis by the USP14 mutants dictates their DUB activity in the proteasome. RFU, relative fluorescence units. RFU values at 60 min are shown. All labelledP values were computed against the wild-type USP14 using a two-tailed unpairedt-test. Data are mean ± s.d. from three independent experiments. Each experiment includes three replicates. The quantification of wild-type USP14 was used as a denominator to normalize all measurements. Source data
Fig. 3
Fig. 3. Structural dynamics and mechanism of allosteric regulation of the AAA-ATPase motor by USP14.
a,b, Side-by-side comparison of the USP14–ATPase subcomplex structures aligned against the CP in six substrate-engaged states (a) and four substrate-inhibited states (b).c,d, Plots of distance from the pore-1 loop of each ATPase to the CP (c) and to the substrate (d) in distinct states.e, The AAA domain structures of the ATPase motor in six substrate-engaged states.f, Varying architecture of the pore-1 loop staircase interacting with the substrate in distinct states. The distances from disengaged pore-1 loops to the substrate are marked. The side chains of the pore-1 loop residues, featuring a consensus sequence of K/M-Y/F-V/L/I, are shown in stick representation, with the aromatic residues highlighted in transparent sphere representation.g, Electrostatic surface representation of the full-length USP14, coloured according to electrostatic potential from red (−5.0 kT e−1, negatively charged) to blue (5.0 kT e−1, positively charged).h, Atomic model of the USP14–RPT1 subcomplex in stateED4USP14 in cartoon representation.i,j, Magnified views of the USP-AAA interface I (i) and II (j) in stateED4USP14, with the interacting pairs of residues in stick representation.k, Changes of the USP-AAA interface in distinct states, characterized by measuring the shortest distance between four USP14 residues (Y285, R371, K375 and N383) and the main chains of RPT1 AAA domain.l, ATPase activity was quantified by measuring the release of phosphate from ATP hydrolysis of the proteasome. All labelledP values were computed by comparison with wild-type USP14 using a two-tailed unpairedt-test. Data are mean ± s.d. from three independent experiments, each with three replicates. The quantification of USP14-free proteasome was used as a denominator to normalize all measurements in each experiment. Source data
Fig. 4
Fig. 4. Proposed model of USP14-mediated regulation of proteasome function.
USP14 binding to the RPN1 and RPT1 subunits of the proteasome primes USP14 activation, whereas ubiquitin–substrate conjugates recruited to the proteasome’s ubiquitin receptors facilitate ubiquitin recognition by USP14. RPN11-catalysed pathway (turquoise solid arrow) is allosterically excluded once USP14 is recruited to the proteasome (dark blue arrows). USP14 binding creates two parallel state-transition pathways of the proteasome. Along the substrate-inhibited pathway (red arrows), which has RPN11 blocking the substrate entrance of the OB ring before any substrate insertion takes place, USP14 trims ubiquitin chains and releases the substrate from the proteasome, thus preventing the substrate degradation (dashed turquoise arrows). Along the substrate-engaged pathway (green arrows), a substrate has already been inserted into the ATPase ring and RPN11 narrows down on the OB ring but does not block substrate translocation through the OB ring (Extended Data Fig. 7f). Although our data do not intuitively explain why USP14 trims ubiquitin until the last one on a substrate remains, the structures provide geometric constraints for polyubiquitin chain binding to both ubiquitin receptors and USP14 and suggest that ubiquitin recognition by USP14 in the proteasome requires at least one additional helper ubiquitin chain that is already anchored on a nearby ubiquitin receptor. This helper ubiquitin chain may not be available for USP14 binding but can be readily trimmed by RPN11.
Extended Data Fig. 1
Extended Data Fig. 1. Protein purification and cryo-EM imaging.
a, The human 26S proteasome was purified through gel-filtration column (Superose 6 10/300 GL).b, Native gel analysis of the human 26S proteasome from (a).c, FPLC purification of human USP14 on Superdex 75 10/300 GL column.d–f, SDS-PAGE and Coomassie blue stain analysis of purified USP14 (d), Sic1PY, UBE1, UBCH5A, WW-HECT, human RPN13 (e), USP14 UBL and USP domains (f).g andh, Western blot was used to evaluate the content of RPN13 (g) and USP14 (h) in the purified human proteasomes. The results indicate the presence of RPN13 and the absence of USP14 in the purified human 26S proteasome.i, Western blot was used to verify polyubiquitylation of Sic1PY (Ubn-Sic1PY) using anti-T7 antibody, indicating that most Sic1PY was ubiquitylated.j,In vitro degradation of Ubn-Sic1PY by the purified 26S proteasome at 10 °C in the absence and presence of USP14. The concentration and ratio of each component was same as cryo-EM sample preparation. The experiments were repeated three times. Samples in (i) and (j) were analyzed by SDS–PAGE/Western blot using anti-T7 antibody. W/O, the proteasome without binding to USP14. WT, the wildtype USP14-bound proteasome.k, Kinetics of Ubn-Sic1PY degradation was plotted by measuring Ubn-Sic1PY density in (j) using ImageJ software. Each point is representative of three independent experiments. Data are presented as mean ± s.d.l–o, MST analysis of USP14 binding to the human proteasome. A dissociation constant of 94.6 ± 27.1 nM (l, full-length USP14 in the absence of Ubn-Sic1PY), 137 ± 33.4 nM (m, USP14 UBL domain only), 135 ± 22.9 nM (n, USP14 USP domain only) and 43.9 ± 24.7 nM (o, full-length USP14 in the presence of Ubn-Sic1PY) were calculated from three independent experiments (shown as mean ± s.d.).p andq, Typical motion-corrected cryo-EM micrographs (left) of the substrate-engaged human USP14–proteasome complex in the presence of 1 mM ATP (p) or after ATP-to-ATPγS exchange (q). Power spectrum evaluation of the corresponding micrographs are shown on the right. The exact numbers of micrographs collected under different experimental conditions are provided in Extended Data Fig. 2a. Each experiment was repeated independently at least five times with similar results.r, Comparison of percent population of each conformational state in the presence of 1 mM ATP or ATP-to-ATPγS exchange in 1 min after mixing the substrate with the USP14-bound proteasome. Our cryo-EM analysis suggests that ATP-to-ATPγS exchange enriches statesEA2.1UBL,SCUSP14,SD5USP14,ED1USP14,ED2.1USP14 andED4USP14, but reduces statesEA1UBL,EA2.0UBL,SBUSP14 andED2.0USP14. The particle numbers used to derive this plot are provided in Extended Data Fig. 2c. For gel source data, see Supplementary Fig. 1 Source data
Extended Data Fig. 2
Extended Data Fig. 2. Cryo-EM data processing workflow and time-resolved analysis.
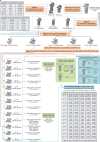
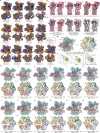
a, The workflow diagram illustrates the major steps of our focused 3D classification strategy for cryo-EM data analysis. Particle numbers after 3D classification and final reconstruction and the resolutions of the complete RP-CP and RP-masked reconstructions of each state are labelled.b, 3D classification of the dataset corresponding to 0 minute before substrate addition as an overall control.c, Time-resolved analysis of all states by restoring the time label (for the buffer condition with 1 mM ATP) or ATPγS label (for the condition with ATP-to-ATPγS exchange). The percentages were computed using the total particle number corresponding to a given time point.
Extended Data Fig. 3
Extended Data Fig. 3. Cryo-EM reconstructions and resolution measurement.
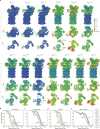
a, Local resolution estimation of the RP reconstructions of thirteen states calculated by ResMap. Each state is shown in two orthogonal orientations, with the second orientation (top view) shown in two different cross-sections at the AAA (middle row) and OB (lower row) domains. All local resolutions are shown with the same color bar in the upper right inset.b andc, Gold-standard Fourier shell correlation (FSC) plots of the complete RP-CP maps of all states calculated without (b) or with (c) masking the separately refined half-maps.d, Gold-standard FSC plots of the RP-masked reconstructions of all states. The RP maps were refined by focusing the mask on the RP subcomplex.e, Model-map FSC plots calculated by Phenix between each RP-CP map (masked) and its corresponding atomic model. For each state, separately refined RP and CP maps (using RP and CP masks, respectively) were merged in Fourier space into a single RP-CP map, which was used for the model-map FSC calculation. The same color code is used in (b–e).
Extended Data Fig. 4
Extended Data Fig. 4. Cryo-EM maps and quality assessment.
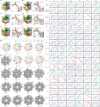
a, Gallery of all refined cryo-EM maps not shown in the main figures.b–f, Typical high-resolution cryo-EM densities (mesh) of secondary structures superimposed with their atomic models. Different subunits of the proteasome are shown in (b), where the substrates shown in the middle panel are modelled using polypeptide chains without assignment of amino acid sequence.c, High-resolution cryo-EM densities of the two domains of USP14 in stateED2.1USP14.d, High-resolution cryo-EM densities of USP14 BL1 and BL2 loops and USP-OB interface in stateED2.1USP14.e, High-resolution cryo-EM densities of the BL3 loop, ubiquitin and representative secondary structure elements in the USP domain of USP14 in stateED4USP14.f, High-resolution cryo-EM densities of USP-AAA interfaces in stateED4USP14.
Extended Data Fig. 5
Extended Data Fig. 5. Structural comparison of the proteasome under distinct conditions.
a, Comparison of cryo-EM reconstructions of the thirteen states of USP14-proteasome complex from the conditions of including 1 mM ATP (ATP-only, no ATPγS in the degradation buffer) (orange) and with ATP-to-ATPγS exchange at 1 min after substrate addition (blue). Particle number and the RP resolution for each class are labelled below each panel of structural comparison. The results show that consistent features of the same states were obtained from the two conditions, although the N-terminal densities of RPN5 are slightly stronger under the condition with ATP-to-ATPγS exchange.b, Comparison of the three major states at 0 min (before substrate addition and after USP14 was bound to the proteasome) with those after the substrate was mixed with the USP14-proteasome complex. For visual clarity, all maps were low-pass filtered to 8 Å.c, Comparison of stateSBUSP14 with the USP14-UbAl-bound proteasome map EMD-9511 (panel1) and of stateED2.1USP14 with the Ubp6-bound proteasome map EMD-3537 (panel2) and Ubp6-UbVS-bound proteasome map EMD-2995 (panel3). Due to the low-resolution nature of the previously published maps, the cryo-EM maps of statesSBUSP14 andED2.1USP14 were low-pass filtered to 8 Å for the visual clarity of comparison.d, Structural comparison of stateED4USP14 with state EB (6MSE) suggests that they have comparable ATPase conformations with defined differences in RPT6 (shown in panele), whereas the lid subcomplexes are in very different conformations with large rotations.e, Structural comparison of RPT6 in statesED4USP14 and EB shows that the RPT6 pore-1 loop, highlighted by transparent sphere representation of Phe223, is moved about 7.2 Å toward the substrate in stateED4USP14 relative to state EB. The right panel show the two RPT6 structures superimposed after aligning the entire ATPase motor subcomplex structures together (as shown in the right of paneld).f, Comparison of the RP and ATPase structures in different states and previously published cryo-EM structures. These structures are aligned together against their CPs. Each pair of compared structures are shown in two orthogonal orientations, with the root-mean-squared-deviation (RMSD) values for the ATPase components shown below each panel of structural comparison. Previous USP14-free structures (PDB ID) used for the comparison include substrate-free states SB (5VFT), SC (5VFU), SD1 (5VFP), SD3 (5VFR) and substrate-bound states EA1 (6MSB), EA2 (6MSD), EB (6MSE), EC1 (6MSG), ED1 (6MSJ), and ED2 (6MSK).
Extended Data Fig. 6
Extended Data Fig. 6. Substrate interactions with the pore loops in the AAA-ATPase motor, the RP-CP interfaces and the nucleotide densities in different USP14-bound states.
af, Cryo-EM densities of the ATPase motor bound to the substrate. Substrate densities are colored in red. Right insets show the zoomed-in side views of the substrate interacting with the pore loops of the ATPases. The substrate in each state is modelled as a polypeptide backbone structure and is represented with red sticks. The ATPases and substrates are rendered as surface (left) and mesh (right) representations.g, Top views of the ATPase motor structures of all states not shown in the main figure are shown in cartoon representations. Nucleotides are shown in sphere representations. The sphere representations of ADP and ATP are in blue and in red, respectively. The structures are aligned together against their CP components. Top right, color codes of subunits used in all panels.h, Comparison of the RP–CP interface and RPT C-terminal tail insertions into the α-pockets of the CP in different states. The cryo-EM densities of the CP subcomplexes are shown as grey surface representations, while the RPT C-tails are colored in teal blue.i, Comparison of the nucleotide densities in the cryo-EM reconstructions of USP14-bound proteasome under two different nucleotide conditions. The side-by-side comparison of the nucleotide densities in two best resolved states show that the ATP-to-ATPγS exchange did not change the observed nucleotide states under our experimental conditions relative to that only used 1 mM ATP in the degradation buffer.j, Comparison of the nucleotide densities in thirteen distinct states of UBP14-bound proteasome. The nucleotide densities fitted with atomic models are shown in blue mesh representation. All close-up views were directly screen-copied from Coot after atomic modelling into the density maps without modification. At the contour level commonly used for atomic modelling, the potential nucleotide densities in the apo-like subunits mostly disappear, although they can occasionally appear as partial nucleotide shapes at a much lower contour level. The states with limited local resolutions are hypothetically assigned for nucleotide types based on the densities, the openness of corresponding nucleotide-binding pockets as well as their homologous structural models of higher resolution from states with similar conformations.
Extended Data Fig. 7
Extended Data Fig. 7. Structural comparison of the USP14-bound proteasome of different states.
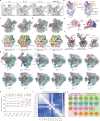
a, Structural comparison of statesEA1UBL,EA2.0UBL andEA2.1UBL shows the ubiquitin transfer from the RPT4-RPT5 coiled-coil (CC) domain to RPN11. The cryo-EM densities rendered as grey mesh representations are low-pass-filtered to 8 Å for visual clarity of comparison.b, Structural comparison of ubiquitin-RPN11-RPT5 interaction in stateEA2.0UBL andEA2.1UBL. Cryo-EM densities rendered transparent surfaces are superimposed with the atomic models. The overall conformation ofEA2.0UBL resides betweenEA1UBL andEA2.1UBL. Both statesEA2.0UBL andEA2.1UBL exhibited RPN11-bound ubiquitin and no substrate densities in the AAA-ATPase motor. A short stretch of ubiquitin-linked substrate density is bound to the cleft between RPN11 and the OB ring inEA2.1UBL but notEA2.0UBL. In both states, the RPT5 N-loop (residues 99-119) pairs with one side of the Insert-1 β-hairpin of RPN11, the other side of which is paired with the C terminus of ubiquitin. They together form a four-stranded β-sheet, a feature that was previously visualized at atomic level only in state EB of the USP14-free proteasome.c, Structural comparison of the RP and ATPase betweenEA2.0UBL andEA2.1UBL and betweenEA2.1UBL and EB (PDB ID 6MSE).d, Structural comparison of the RP and ATPase betweenED4USP14 andSD4USP14 and betweenED5USP14 andSD5USP14. The root-mean-squared-deviation (RMSD) values for the ATPase components are shown below each panel of structural comparison in (c) and (d).e, Binding of UBL of USP14 to the T2 site of RPN1 in stateEA1UBL as compared to the binding of ubiquitin to RPN1 in USP14-free state EA1 from previous studies. Right inset shows the cryo-EM density of UBL-bound RPN1 inEA1UBL.f, Comparison of the RPN11-OB ring interface in different states. Left panel, the interface in the EA-like states shows an open OB ring for substrate entrance. Middle panel, the substrate entrance of the OB ring is blocked by RPN11 in the substrate-inhibited states. Right panel, RPN11 is rotated outward slightly by ~5 Å to make way for substrate translocation through the OB ring in stateED2.1USP14 (grey cartoon) as compared to those in the substrate-inhibited states (colorful cartoon).g, Side-by-side structural comparison of the USP14-bound RP in all states from the top view showing differential rotation of the lid and RPN1.h, Plots of the distance of pore-1 loop to the CP for those states not shown in Fig. 3c. The comparison shows that the pore-loop staircase architecture in stateSBUSP14,SCUSP14 orSD4USP14 is similar to that of EA-like state.i, Root-mean-squared-deviation (RMSD) values of the ATPase structures are mapped between any pairs of the thirteen states.j, An integrated schematic diagram of proteasome state transitions illustrates the full functional cycles of the proteasome in the presence and absence of USP14. The solid circles are the states observed in the current study, whereas the dashed circles are the states observed in previous studies of substrate-free (orange) or substrate-engaged human proteasome (green) in the absence of USP14. Color blue and salmon label the substrate-engaged and substrate-inhibited USP14-proteasome states, respectively. The states with closed and open CP gate are placed in pink and limon backgrounds, respectively. Vertical orange dashed lines link the state pairs with comparable AAA-ATPase structures. Black solid arrows and dashed arrows represent the possible structural transitions connecting the states observed in the current study and pervious USP14-free studies,, respectively Source data
Extended Data Fig. 8
Extended Data Fig. 8. Dynamics of USP14 and key ATPase subunits in the proteasome.
a, Superposition of the USP14-RPT1 subcomplex structures from different states aligned against the RPT1 large AAA subdomain. USP14 rotates together with the RPT1 OB domain and moves up over 37 Å (fromED4USP14 toED0USP14) relative to the RPT1 AAA domain. The angle between the OB domain and the AAA domain is measured and labelled for each state.b, Superposition of the USP14 structures from different states aligned against their USP domain. The UBL domain moves up over 24 Å (fromED4USP14 toED0USP14) relative to the USP domain. The distance between Ser74 and Cys114 is measured and labelled for each state.c, Superposition of the RPT6 AAA domain structures from different states aligned against the large AAA subdomain. Left, comparison of the RPT6 AAA structures in the ATP-bound states. Middle, comparison of statesSD4USP14,ED2.1USP14 andED4USP14, the ADP-bound states and state EB (PDB ID: 6MSE) shows conformational changes of the AAA domain driven by the ATP hydrolysis and nucleotide exchange. Right, the open-gate statesED2.1USP14,ED4USP14, andSD4USP14 show different refolding of both the pore-1 and pore-2 loops.d, Superposition of the RPT1 AAA domain structures from different states aligned against the large AAA subdomain. Left, comparison of the structures in the ATP-bound states. Middle, comparison of the structures in different nucleotide-binding states. Right, the C-terminal tails of RPT6 exhibit three major orientations.
Extended Data Fig. 9
Extended Data Fig. 9. Structure-based site-directed mutagenesis.
a, Mapping of the potential RPT-binding sites and other residues affecting USP14 activation onto the USP14 structure in theED4USP14 model. The UBL domain of USP14 is not shown.b, Purification of USP14 mutants and analyzed by SDS/PAGE and stained with Coomassie blue.c, Peptidase activity assay was used to evaluate the effects of USP14 variants on regulating the CP gate opening.P values were analyzed using a two-tailed unpairedt-test between wild-type USP14-bound and USP14-free proteasomes. The results suggest that the mutants promote the CP gate opening to the same degree as that of wild-type USP14 as compared to that of the USP14-free proteasome.d ande, Ubiquitin-AMC hydrolysis assay to measure the DUB activity of USP14 mutants in the presence (paneld) or absence (panele) of the human proteasome. Data are presented as mean ± s.d. from three independent experiments.P values were analyzed using a two-tailed unpairedt-test between USP14 mutants and wild-type USP14.P value is not labelled for data withP > 0.05, which is not significant. Data inc–e are presented as mean ± s.d. from three independent experiments, each with three replicates. Dots, individual data points.f, The DUB activity of USP14 mutants in the presence or absence of proteasome. Data points are the average of individual data points shown in panels (d) and (e) and Fig. 2i.g andh,In vitro degradation of Ubn-Sic1PY by the 26S proteasome in the presence of USP14 mutants testing the USP-OB interface or linker region (panelg) and affecting the USP-AAA interfaces (panelh) (repeated three times with similar results). Samples were analyzed by SDS–PAGE/Western blot using anti-T7 antibody. TEEQ, insertion of TEEQ after residue 92 in the linker region. Δ93–96, mutant with deletion of residues 93-96 in the linker region. W/O, the proteasome without binding to USP14. WT, the wildtype USP14-bound proteasome.i, Multiple sequence alignment of USP14 from five species was performed by Chimera. Annotation is based on the structural and mutational data from Figs. 2 and 3. The mutations with the strongest phenotypes (marked by red stars) all correspond to the amino acids (highlighted bold) that are fully conserved from yeast to human. Those mutations with moderate phenotypes correspond to the amino acids that are well conserved in mammals but may vary in yeast. For gel source data, see Supplementary Fig. 1 Source data
See this image and copyright information in PMC

Comment in

Similar articles

See all similar articles

Cited by

See all "Cited by" articles

References

    1. Mao, Y. In Macromolecular Protein Complexes III: Structure and Function (eds Harris J. R. & Marles-Wright, J.) Ch. 1 (Springer, 2021).
    1. de Poot SAH, Tian G, Finley D. Meddling with fate: the proteasomal deubiquitinating enzymes. J. Mol. Biol. 2017;429:3525–3545. doi: 10.1016/j.jmb.2017.09.015. - DOI - PMC - PubMed
    1. Leggett DS, et al. Multiple associated proteins regulate proteasome structure and function. Mol. Cell. 2002;10:495–507. doi: 10.1016/S1097-2765(02)00638-X. - DOI - PubMed
    1. Borodovsky A, et al. A novel active site-directed probe specific for deubiquitylating enzymes reveals proteasome association of USP14. EMBO J. 2001;20:5187–5196. doi: 10.1093/emboj/20.18.5187. - DOI - PMC - PubMed
    1. Hu M, et al. Structure and mechanisms of the proteasome-associated deubiquitinating enzyme USP14. EMBO J. 2005;24:3747–3756. doi: 10.1038/sj.emboj.7600832. - DOI - PMC - PubMed

Publication types

MeSH terms

Substances

Related information

Grants and funding

LinkOut - more resources

Full text links
Nature Publishing Group full text link Nature Publishing Group Free PMC article
Cite
Send To

NCBI Literature Resources

MeSHPMCBookshelfDisclaimer

The PubMed wordmark and PubMed logo are registered trademarks of the U.S. Department of Health and Human Services (HHS). Unauthorized use of these marks is strictly prohibited.


[8]ページ先頭

©2009-2025 Movatter.jp