Increasing morphological disparity and decreasing optimality for jaw speed and strength during the radiation of jawed vertebrates
- PMID:35302857
- PMCID: PMC8932669
- DOI: 10.1126/sciadv.abl3644
Increasing morphological disparity and decreasing optimality for jaw speed and strength during the radiation of jawed vertebrates
Abstract
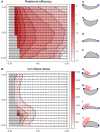
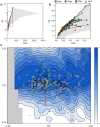
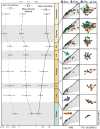
The Siluro-Devonian adaptive radiation of jawed vertebrates, which underpins almost all living vertebrate biodiversity, is characterized by the evolutionary innovation of the lower jaw. Multiple lines of evidence have suggested that the jaw evolved from a rostral gill arch, but when the jaw took on a feeding function remains unclear. We quantified the variety of form in the earliest jaws in the fossil record from which we generated a theoretical morphospace that we then tested for functional optimality. By drawing comparisons with the real jaw data and reconstructed jaw morphologies from phylogenetically inferred ancestors, our results show that the earliest jaw shapes were optimized for fast closure and stress resistance, inferring a predatory feeding function. Jaw shapes became less optimal for these functions during the later radiation of jawed vertebrates. Thus, the evolution of jaw morphology has continually explored previously unoccupied morphospace and accumulated disparity through time, laying the foundation for diverse feeding strategies and the success of jawed vertebrates.
Figures


Similar articles
- Widespread convergence towards functional optimization in the lower jaws of crocodile-line archosaurs.Rawson JRG, Deakin WJ, Stubbs TL, Smith TJ, Rayfield EJ, Donoghue PCJ.Rawson JRG, et al.Proc Biol Sci. 2024 Aug;291(2029):20240720. doi: 10.1098/rspb.2024.0720. Epub 2024 Aug 21.Proc Biol Sci. 2024.PMID:39163982Free PMC article.
- Initial radiation of jaws demonstrated stability despite faunal and environmental change.Anderson PS, Friedman M, Brazeau MD, Rayfield EJ.Anderson PS, et al.Nature. 2011 Jul 6;476(7359):206-9. doi: 10.1038/nature10207.Nature. 2011.PMID:21734660
- Bite marks and predation of fossil jawless fish during the rise of jawed vertebrates.Randle E, Sansom RS.Randle E, et al.Proc Biol Sci. 2019 Dec 18;286(1917):20191596. doi: 10.1098/rspb.2019.1596. Epub 2019 Dec 18.Proc Biol Sci. 2019.PMID:31847724Free PMC article.
- Fishing for jaws in early vertebrate evolution: a new hypothesis of mandibular confinement.Miyashita T.Miyashita T.Biol Rev Camb Philos Soc. 2016 Aug;91(3):611-57. doi: 10.1111/brv.12187. Epub 2015 Apr 21.Biol Rev Camb Philos Soc. 2016.PMID:25899041Review.
- Evolution and development of the fish jaw skeleton.DeLaurier A.DeLaurier A.Wiley Interdiscip Rev Dev Biol. 2019 Mar;8(2):e337. doi: 10.1002/wdev.337. Epub 2018 Oct 31.Wiley Interdiscip Rev Dev Biol. 2019.PMID:30378758Free PMC article.Review.
Cited by
- Optimal Gearing of Musculoskeletal Systems.Polet DT, Labonte D.Polet DT, et al.Integr Comp Biol. 2024 Sep 27;64(3):987-1006. doi: 10.1093/icb/icae072.Integr Comp Biol. 2024.PMID:38901962Free PMC article.
- Generating novel tennis racket shape concepts using a theoretical morphospace.Grant RA, Bonhomme V, Allen T.Grant RA, et al.PLoS One. 2024 Sep 12;19(9):e0310155. doi: 10.1371/journal.pone.0310155. eCollection 2024.PLoS One. 2024.PMID:39264952Free PMC article.
- A new Meckel's cartilage from the Devonian Hangenberg black shale in Morocco and its position in chondrichthyan jaw morphospace.Greif M, Ferrón HG, Klug C.Greif M, et al.PeerJ. 2022 Dec 21;10:e14418. doi: 10.7717/peerj.14418. eCollection 2022.PeerJ. 2022.PMID:36573235Free PMC article.
- Widespread convergence towards functional optimization in the lower jaws of crocodile-line archosaurs.Rawson JRG, Deakin WJ, Stubbs TL, Smith TJ, Rayfield EJ, Donoghue PCJ.Rawson JRG, et al.Proc Biol Sci. 2024 Aug;291(2029):20240720. doi: 10.1098/rspb.2024.0720. Epub 2024 Aug 21.Proc Biol Sci. 2024.PMID:39163982Free PMC article.
- An evolutionary timeline of the oxytocin signaling pathway.Sartorius AM, Rokicki J, Birkeland S, Bettella F, Barth C, de Lange AG, Haram M, Shadrin A, Winterton A, Steen NE, Schwarz E, Stein DJ, Andreassen OA, van der Meer D, Westlye LT, Theofanopoulou C, Quintana DS.Sartorius AM, et al.Commun Biol. 2024 Apr 17;7(1):471. doi: 10.1038/s42003-024-06094-9.Commun Biol. 2024.PMID:38632466Free PMC article.
References
- Donoghue P. C. J., Keating J. N., Early vertebrate evolution. Palaeontology 57, 879–893 (2014).
- Denison R. H., Feeding mechanisms of agnatha and early gnathostomes. Am. Zool. 1, 177–181 (1961).
- Dennis K., Miles R. S., New durophagous arthrodires from Gogo, Western-Australia. Zool. J. Linnean Soc. 69, 43–85 (1980).
- Snively E., Anderson P. S. L., Ryan M. J., Functional and ontogenetic implications of bite stress in arthrodire placoderms. Kirtlandia 57, 53–60 (2009).
Related information
LinkOut - more resources
Full Text Sources
