Movatterモバイル変換


[0]ホーム

URL:


Skip to main page content
U.S. flag

An official website of the United States government

Dot gov

The .gov means it’s official.
Federal government websites often end in .gov or .mil. Before sharing sensitive information, make sure you’re on a federal government site.

Https

The site is secure.
Thehttps:// ensures that you are connecting to the official website and that any information you provide is encrypted and transmitted securely.

NIH NLM Logo
Log inShow account info
Access keysNCBI HomepageMyNCBI HomepageMain ContentMain Navigation
pubmed logo
Advanced Clipboard
User Guide

Full text links

HighWire full text link HighWire Free PMC article
Full text links

Actions

Share

.2021 Dec 30;5(3):e202101191.
doi: 10.26508/lsa.202101191. Print 2022 Mar.

ADAR1 RNA editing regulates endothelial cell functions via the MDA-5 RNA sensing signaling pathway

Affiliations

ADAR1 RNA editing regulates endothelial cell functions via the MDA-5 RNA sensing signaling pathway

Xinfeng Guo et al. Life Sci Alliance..

Abstract

The RNA-sensing signaling pathway has been well studied as an essential antiviral mechanism of innate immunity. However, its role in non-infected cells is yet to be thoroughly characterized. Here, we demonstrated that the RNA sensing signaling pathway also reacts to the endogenous cellular RNAs in endothelial cells (ECs), and this reaction is regulated by the RNA-editing enzyme ADAR1. Cellular RNA sequencing analysis showed that EC RNAs endure extensive RNA editing, especially in the RNA transcripts of short interspersed nuclear elements. The EC-specific deletion of ADAR1 dramatically reduced the editing level on short interspersed nuclear element RNAs, resulting in newborn death in mice with damage evident in multiple organs. Genome-wide gene expression analysis revealed a prominent innate immune activation with a dramatically elevated expression of interferon-stimulated genes. However, blocking the RNA sensing signaling pathway by deletion of the cellular RNA receptor MDA-5 prevented interferon-stimulated gene expression and rescued the newborn mice from death. This evidence demonstrated that the RNA-editing/RNA-sensing signaling pathway dramatically modulates EC function, representing a novel molecular mechanism for the regulation of EC functions.

© 2021 Guo et al.


Conflict of interest statement

The authors declare that they have no conflict of interest.

Figures
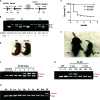
Figure 1.
Figure 1.. Endothelial cell(EC)–specific deletion of ADAR1 causes postnatal death in mice.
(A) EC-specific deletion of theADAR1 gene at exon 12–15 is mediated byCre recombinase, which is driven by cadherin 5 promoter (VE-cadherin). The VEN7 transgenic mouse colony was used in this study. P1, P2, and P3 primers used for genotype analysis are indicated by the arrows. The PCR with mixed primer of these three was used to determine the relative quantity of floxed and deletedADAR1 alleles.(B) Typical genotyping analysis of founder, F1, and F2 progenies is shown in panel (B).(C) Half of theEC-KO pups (ADAR1Lox/Lox; Cdh5-Cre+) died within 1 wk after birth, and about 75% died within 3 wk.(D) Cyanotic signs developed in some of the newborn pups, which became severe before they died. Shown here is an EC-KO pup with itswild type littermate at day 2 after birth.(E) Growth was severely retarded in some of the EC-KO pups, which usually cannot survive.(E) Shown in panel (E) is one EC-KO pup with its littermate at two and half week after birth.(F) PCR analysis ofADAR1 gene deletion in ECs isolated from 1 wk old EC-KO pups shows dramatic variation in different mice.(G) ECs isolated from EC-KO mice that survived to 4 wk of age were analyzed forADAR1 gene deletion by PCR and compared with EC-KO mice at 2 wk of age. No obvious deletion was observed in 4-wk-old mice.(H)ADAR1 gene deletion in brain, heart (H), lung (Lu), liver (Lv), kidney (K), intestine (In), muscle (M), bone marrow (Bm), and lung ECs was analyzed;ADAR1 deletion was shown to only have occurred in ECs.
Figure S1.
Figure S1.. CD31 staining of endothelial cells (ECs) isolated from mouse lungs cultured in vitro.
Primary ECs were isolated from 1- to 2-wk-old mice using CD31 and ICAM-2 double positive magnetic beads selections and cultured in vitro with EC culturing medium. Then the cells were stained with PE-conjugated CD31 antibody to monitor the purity of the isolated ECs. Almost all the cells were stained positively. Hoechst 33342 was used to show the nuclei.(A, B) Panel (A, B) show the cells of the lung tissues before EC isolation. Only a small portion of the cells were stained by CD31.(C, D) Panel (C, D) show the isolated ECs. Almost all the cells were CD31 positive cells.
Figure 2.
Figure 2.. Multiple organ injuries in endothelial cell-KO mice.
(A) Severe atelectasis occurred in all ADAR1EC-KO mice that died within 3 wk of birth. Panel (A) shows the postmortem lungs of an ADAR1EC-KO mouse and a wild-type mouse at two and a half weeks of age. The circles indicate the collapsed areas. The right lung almost completely collapsed. At, atelectasis area.(B) HE-stained lung sections of ADAR1EC-KO mice show many alveoli were collapsed, and total air space was dramatically reduced. “At,” indicate the areas with complete atelectasis.(C) The microscopic analysis found apparent morphologic changes in multiple organs, including the lungs, liver, and intestine. On the liver sections, areas of injured and necrotic hepatocytes were scattered in the relatively normal hepatocyte areas. The injured and necrotic areas were circled and labeled with “Inj.” On the small intestine sections, villi became scarce, and the length of the villi was dramatically decreased with structure interrupted. The scale bar is 100 μm.(D) On the H-E–stained sections of the kidney and liver, the tissue structures were disrupted by the tubule-like empty spaces. CD31 antibody staining showed the tubule spaces were lined by the endothelial cells with CD31 positive staining, confirming they were dilated-blood vessels. “V,” indicates the enlarged vessel structures. Images were taken with 10× and 20× objective magnifications as indicated. Scale bars are 200 and 100 μm, respectively.
Figure S2.
Figure S2.. Gross appearance of the collapsed lungs of ADAR1EC-KO mice.
Severe atelectasis was often observed in perimortem or postmortem analysis of ADAR1EC-KO mice. Either one or both lungs were involved. Here shows the postmortem lungs of the ADAR1EC-KO mice at two and a half weeks of age. The circles indicate the collapsed areas. At, indicated atelectasis areas.
Figure 3.
Figure 3.. Up-regulated interferon-stimulated gene (ISG) expression in ADAR1-deficient endothelial cells (ECs).
(A) ECs isolated from ADAR1EC-KO mice were analyzed for ISG expression levels. Real-time RT-PCR was used to quantify a panel of 23 ISG expression activities. Significantly increased expression was observed in 16 genes in the cells of EC-KO mice compared with the littermate controls.P < 0.05, n = 3 (control) and 4–6 (EC-KO).(B) Expression of seven selected ISGs was also quantified in cultured ECs isolated from inducible ADAR1 KO (i-KO) mice.ADAR1 gene deletion was induced by adding tamoxifen to the culture medium. Non-induced ECs (NT) and ECs isolated fromwild type mice were used as controls. The expression of all these genes was significantly increased in tamoxifen-treated i-KO ECs.P < 0.05, n = 3 (control) and 3–4 (i-KO). RNA expression levels were determined using the ∆∆Ct method with average ofGAPDH andHPRT as endogenous control.
Figure 4.
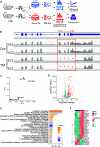
Figure 4.. Genome-wide differential gene expression in control and ADAR1-deficient endothelial cells (ECs) via RNA-seq analysis.
(A) RNA analysis pipeline showing that tamoxifen (TM)-treated and non-treated ECs from two independent ADAR1 i-KO mice were used for analysis.(B) ADAR1 deletion of exon 12–15 in TM-treated ECs was confirmed by RNA read alignment.(C) Principal component analysis shows that cells from two independent mice were grouped by cell treatment. Blue: control samples; red: TM-treated samples.(D) Gene expression analysis illustrated by volcano plot showing the differentially expressed genes. Red: up-regulated genes; green: down-regulated genes.(E) Top significant pathways detected by Ingenuity Pathway Analysis based on the differentially expressed genes. Positive Z-score (orange) indicates activation, and negative score (blue) represents inhibition.(F) Heat map for the differentially expressed genes involved in the interferon signaling pathway.
Figure 5.
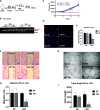
Figure 5.. Endothelial cell (EC) cellular function was impacted by ADAR1 deficiency.
(A) ECs were isolated from the lungs of 1- to 2-wk-old inducible ADAR1 KO (i-KO) mice and cultured in vitro for cellular function assays. Tamoxifen (TM) was added to culture medium for 48 h to induceADAR1 gene deletion before assays were performed, as shown in panel (A).(B)ADAR1 gene deletion in the tested ECs was confirmed by PCR analysis before EC function was assessed. EfficientADAR1 gene deletion in TM-induced i-KO ECs was shown by the ratios of the deleted and floxed gene PCR products.(C) Cell growth rate was monitored by counting the cell numbers at 24-, 48-, and 72-h time points after replating the same number of the TM-treated and non-treated ECs. TM induction dramatically reduced i-KO EC numbers compared with the controls.P < 0.05, n = 9.(D, E) Proliferating ECs were monitored by Ki-67 antibody staining. The number of positively stained TM-treated i-KO cells was significantly reduced compare with the control cells.P < 0.05, n = 9.(F, G) Cell migration rate was assessed by measuring the areas covered by cells that migrated, crossing the edges from both sides (between the lines). The cell migration areas were dramatically smaller in TM-treated i-KO ECs than the controls.P < 0.05, n = 3 (control) and 9 (i-KO).(H, I) Tube formation capacity was tested on Matrigel. Far fewer tube structures developed in TM-treated i-KO ECs, and the total tube length was significantly less than the controls.P < 0.05, n = 3 (control) and 4–6 (i-KO).
Figure 6.
Figure 6.. Distribution of RNA editing sites in endothelial cells (ECs).
Extensive RNA editing was identified in EC RNA transcripts by RNA sequence analysis.(A, B) show that most editing sites fell into gene regions, especially intron and 3′ untranslated regions.(C, D) show that about half of the editing sites were located in repetitive regions, with most of them falling in short interspersed nuclear element, long terminal repeat, and long interspersed nuclear element.(A, B, C, D) are the results of control (CON) ECs of the first mouse.(E) Venn diagram showing overlap between EC1 and EC2 for the CON > TM editing sites.(F) Venn diagram showing the overlap between EC1 and EC2 for the CON < TM editing sites.(G, H) Gene distribution of the common CON > TM editing sites in EC1 and EC2.(I, J) Gene distribution of the common CON < TM editing sites in EC1 and EC2.(K, L) Distribution of the EC1 and EC2 common editing sites with CON > TM and CON < TM, respectively, in repeat and non-repeat gene regions.(M, N) Distribution of the EC1 and EC2 common editing sites with CON > TM and CON < TM, respectively, in subcategories of repetitive regions. Panel (E, G, H, K, M) are the EC1 and EC2 common editing sites with CON > TM editing rate. Panel (F, I, J, L, N) are the EC1 and EC2 common editing sites with CON < TM editing rate.
Figure S3.
Figure S3.. Distribution of RNA editing sites in endothelial cells.
Four independent RNA libraries were used for editing site identification and analysis, which were prepared from endothelial cells of two independent i-KO mice with and without tamoxifen (TM) induction. Results of EC1 control are shown in Fig 6.(A, B, C, D, E, F, G, H, I, J, K, L) Shown here are the results for EC1 treated with TM (EC1 TM, panel A, B, C, D), untreated EC2 (EC2 Con, panel E, F, G, H), and EC2 treated with TM (EC2 TM, panel I, J, K, L). (A, B, E, F, I, J) show that most editing sites fell into gene regions, especially intron and 3′ untranslated regions. (C, D, G, H, K, L) show that about half of the editing sites were in repetitive regions, most of them falling in short interspersed nuclear element, long terminal repeat, and long interspersed nuclear element.
Figure S4.
Figure S4.. High editing site distribution.
(A, B, C, D, E, F) Distribution of EC1 editing sites with higher editing rates in CON samples.(A, B) Distribution of editing rate and editing read for EC1 CON > TM.(C, D) Gene distribution of editing sites for EC1 CON > TM.(E, F) Repetitive region distribution of editing sites for EC1 CON > TM.(G, H, I, J, K, L) Distribution of EC2 editing sites with higher editing rate in CON samples.(G, H) Distribution of editing rate and editing read for EC2 CON > TM.(I, J) Gene distribution of editing sites for EC2 CON > TM.(K, L) Repetitive region distribution of editing sites for EC2 CON > TM.
Figure S5.
Figure S5.. Low editing site distribution.
(A, B, C, D, E, F) Distribution of EC1 editing sites with lower editing rate in control (CON) samples.(A, B) Distribution of editing rate and editing read for EC1 CON < TM.(C, D) Gene distribution of editing sites for EC1 CON < TM.(E, F) Repetitive region distribution of editing sites for EC1 CON < TM.(G, H, I, J, K, L) Distribution of EC2 editing sites with higher editing rate in CON samples.(G, H) Distribution of editing rate and editing read for EC2 CON < TM.(I, J) Gene distribution of editing sites for EC2 CON < TM.(K, L) Repetitive region distribution of editing sites for EC2 CON < TM.
Figure 7.
Figure 7.. Decreased editing in short interspersed nuclear element (SINE) RNA transcripts.
(A) Number of editing sites across SINE, long terminal repeat (LTR), and long interspersed nuclear element (LINE) regions.(B) Number of repetitive regions (RRs) across SINE, LTR, and LINE regions.(C) Average editing rate across SINE, LTR, and LINE regions.(D) Venn diagram showing the overlap between EC1 and EC2 for the CON > TM editing RRs.(E) Number of editing RRs with CON > TM and CON < TM detected in EC1 only, EC2 only, and shared by the two mice.(F) Distribution of common RRs of the two mice across SINE, LTR, and LINE.(G) Distribution of the common RRs of the two mice across subcategories of SINE.
Figure S6.
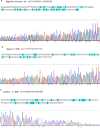
Figure S6.. Multiple editing sites were verified in B1 short interspersed nuclear element (SINE) RNA transcripts.
RNA of wild type endothelial cells was subjected to Sanger sequencing analysis after RT-PCR, which amplifies the selected B1 SINE elements. In the chromatographs of the sequencing, guanosine (G) peaks were seen together with adenosine (A) peaks.(A, B, C) Panel A shows the editing sites in the B1 element in the intron 14 of the Sppl2a gene (chr2: 126892815-126892950), whereas the editing sites in the 3′ UTR of the Nipa1 gene (chr7: 55977578-55977700) and the 3′ UTR of the Slfn5 gene (chr11: 82962556–82962680) are shown in panels (B and C). The sequences of each SINE are shown on the top with the editing sites highlighted. At the bottom are the corresponding sequencing chromatographs; the arrows indicate the editing sites.
Figure 8.
Figure 8..MDA-5 deletion rescues ADAR1EC-KO mice from postnatal death.
(A) ADAR1EC-KO mice were crossed withMDA5−/− mice and in the resulting double knockout (d-KO) mice, bothADAR1 andMDA-5 were deleted in ECs.(B) PCR genotyping was used to monitor the genetic status of floxedADAR1,Cad-5 Cre, andMDA-5 and identify the d-KO mice. Panel (B) shows the typical genotypes of the breeders, progenies of F1 and F2 generations.(C) The postnatal death that occurred to ADAR1EC-KO was not observed in the d-KO mice. The d-KO mice survived to adulthood without noticeable abnormality.(D)ADAR1 gene deletion in the ECs isolated from 6-wk-old d-KO mice was tested using PCR analysis and compared with 2-wk-old ADAR1EC-KO mice. EfficientADAR1 deletion was observed in d-KO mice.
Figure 9.
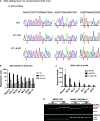
Figure 9.. MDA-5 deletion diminishes interferon-stimulated gene (ISG) expression in endothelial cells (ECs) with reduced short interspersed nuclear element (SINE) RNA editing caused by ADAR1 deficiency.
(A) ECs isolated fromwild type (WT), inducible ADAR1 KO (i-KO), and inducible ADAR1/MDA-5 double knockout (i-d-KO) mice were cultured in vitro with tamoxifen (TM) induction for ADAR1 gene deletion. RNA editing in SINE RNA transcripts was assessed through RT-PCR and Sanger sequencing, and compared between wild-type, i-KO, and i-d-KO ECs. Panel (A) shows the chromatographs of Sanger sequencing result of EC RNAs. The multiple editing sites in the specific B1 SINE element located in the 3′ untranslated region of theSlfn5 gene were indicated by arrows. Obvious editing, as shown by the G peaks (black) together with A peak (green), presents in wild type EC RNAs. The editing levels (G peak areas) in i-d-KO ECs were same as the i-KO ECs, which were dramatically lower than theWT ECs.(B) ECs isolated fromWT, EC-KO, and EC d-KO mice were analyzed for ISG expression. Compared to the EC-KO mice, ISG expression was significantly decreased in d-KO mice as shown by the seven representative ISGs.P < 0.05, n = 3 (WT) and 3–6 (i-KO and d-KO).(C) ISG expression was also tested in i-d-KO ECs after theADAR1 gene was deleted; ISG levels were significantly lower than the controls.P < 0.05, n = 3 (WT) and 3–4 (i-KO and d-KO).(D).ADAR1 andMDA-5 gene deletion was monitored in the tested ECs with TM induction.ADAR1 gene was efficiently deleted in both i-KO and i-d-KO ECs after TM induction, whereas theMDA-5 gene was deleted in i-d-KO ECs with and without TM induction.
Figure S7.
Figure S7.. PCR detection of ADAR1 gene deletion in highly vascularized tissues.
ADAR1 gene deletion in EC-KO mice was monitored by two PCR reactions. The first reaction uses a mix of three primers (P1, P2, and P3, as shown in Fig 1), showing the relative quantity of deleted and floxed ADAR1 alleles. The deleted ADAR1 signal was not seen, indicating that relative to the undeleted ADAR1, the portion of deleted ADAR1 gene is very little. The second reaction uses only primer P1 and P3, which only amplifies the deleted ADAR1 allele. ADAR1 deletion is detected in all tissues tested, with strong signals in the lung (Lu), kidney (K), and heart (H), whereas a minimum signal was seen in the brain (Br) and liver (Lv) tissues.
Figure S8.
Figure S8.. Western analysis of ADAR1 protein expressed in endothelial cells (ECs).
Total protein prepared from cultured ECs that were isolated from wild-type (WT) and inducible ADAR1 KO mice (i-KO) was analyzed by Western blot with the anti-ADAR1 monoclonal antibody, clone 15.8.6 (against the RNA-binding domains). Tamoxifen induction on i-KO ECs almost completely removed ADAR1 protein from the cells. No truncated protein was detected.
Figure S9.
Figure S9.. MDA-5 deletion partially rescues ADAR1-deficient endothelial cell (EC) functions.
The ECs isolated from the wild-type, i-KO, and ADAR1/MDA5 double i-KO (d-i-KO) mice were cultured, induced by tamoxifen, and assessed for their functional differences was as described in Fig 5.(A, B, C) The cell proliferating rate of d-iKO ECs, monitored by Ki-67 antibody staining, n = 9, (panel A), Cell migration, n = 3, (panel B), and the tuber formation, n = 3, (panel C) were compared with the Wt and i-KO ECs. Whereas the d-i-KO ECs show significant difference from the i-KO cells,P < 0.05, in all three assessments, MDA-5 deletion in the d-i-KO cells does not completely restore the EC functions to the Wt EC levels.
See this image and copyright information in PMC

Similar articles

See all similar articles

Cited by

See all "Cited by" articles

References

    1. Jensen S, Thomsen AR (2012) Sensing of RNA viruses: A review of innate immune receptors involved in recognizing RNA virus invasion. J Virol 86: 2900–2910. 10.1128/JVI.05738-11 - DOI - PMC - PubMed
    1. Rehwinkel J, Gack MU (2020) RIG-I-like receptors: Their regulation and roles in RNA sensing. Nat Rev Immunol 20: 537–551. 10.1038/s41577-020-0288-3 - DOI - PMC - PubMed
    1. Uehata T, Takeuchi O (2020) RNA recognition and immunity-innate immune sensing and its posttranscriptional regulation mechanisms. Cells 9: 1701. 10.3390/cells9071701 - DOI - PMC - PubMed
    1. Okude H, Ori D, Kawai T (2020) Signaling through nucleic acid sensors and their roles in inflammatory diseases. Front Immunol 11: 625833. 10.3389/fimmu.2020.625833 - DOI - PMC - PubMed
    1. Liddicoat BJ, Piskol R, Chalk AM, Ramaswami G, Higuchi M, Hartner JC, Li JB, Seeburg PH, Walkley CR (2015) RNA editing by ADAR1 prevents MDA5 sensing of endogenous dsRNA as nonself. Science 349: 1115–1120. 10.1126/science.aac7049 - DOI - PMC - PubMed

Publication types

MeSH terms

Substances

Related information

Grants and funding

LinkOut - more resources

Full text links
HighWire full text link HighWire Free PMC article
Cite
Send To

NCBI Literature Resources

MeSHPMCBookshelfDisclaimer

The PubMed wordmark and PubMed logo are registered trademarks of the U.S. Department of Health and Human Services (HHS). Unauthorized use of these marks is strictly prohibited.


[8]ページ先頭

©2009-2025 Movatter.jp