Deciphering the generating rules and functionalities of complex networks
- PMID:34824290
- PMCID: PMC8616909
- DOI: 10.1038/s41598-021-02203-4
Deciphering the generating rules and functionalities of complex networks
Abstract
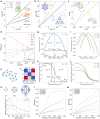
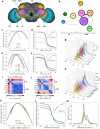
Network theory helps us understand, analyze, model, and design various complex systems. Complex networks encode the complex topology and structural interactions of various systems in nature. To mine the multiscale coupling, heterogeneity, and complexity of natural and technological systems, we need expressive and rigorous mathematical tools that can help us understand the growth, topology, dynamics, multiscale structures, and functionalities of complex networks and their interrelationships. Towards this end, we construct the node-based fractal dimension (NFD) and the node-based multifractal analysis (NMFA) framework to reveal the generating rules and quantify the scale-dependent topology and multifractal features of a dynamic complex network. We propose novel indicators for measuring the degree of complexity, heterogeneity, and asymmetry of network structures, as well as the structure distance between networks. This formalism provides new insights on learning the energy and phase transitions in the networked systems and can help us understand the multiple generating mechanisms governing the network evolution.
© 2021. The Author(s).
Conflict of interest statement
The authors declare no competing interests.
Figures


Similar articles
- Controlling the Multifractal Generating Measures of Complex Networks.Yang R, Bogdan P.Yang R, et al.Sci Rep. 2020 Mar 26;10(1):5541. doi: 10.1038/s41598-020-62380-6.Sci Rep. 2020.PMID:32218468Free PMC article.
- Macromolecular crowding: chemistry and physics meet biology (Ascona, Switzerland, 10-14 June 2012).Foffi G, Pastore A, Piazza F, Temussi PA.Foffi G, et al.Phys Biol. 2013 Aug;10(4):040301. doi: 10.1088/1478-3975/10/4/040301. Epub 2013 Aug 2.Phys Biol. 2013.PMID:23912807
- Reliability-based topology design for large-scale networks.Bai YN, Huang N, Sun L, Wang L.Bai YN, et al.ISA Trans. 2019 Nov;94:144-150. doi: 10.1016/j.isatra.2019.04.004. Epub 2019 May 14.ISA Trans. 2019.PMID:31109724
- Topological portraits of multiscale coordination dynamics.Zhang M, Kalies WD, Kelso JAS, Tognoli E.Zhang M, et al.J Neurosci Methods. 2020 Jun 1;339:108672. doi: 10.1016/j.jneumeth.2020.108672. Epub 2020 Mar 6.J Neurosci Methods. 2020.PMID:32151601Free PMC article.Review.
- Network morphospace.Avena-Koenigsberger A, Goñi J, Solé R, Sporns O.Avena-Koenigsberger A, et al.J R Soc Interface. 2015 Feb 6;12(103):20140881. doi: 10.1098/rsif.2014.0881.J R Soc Interface. 2015.PMID:25540237Free PMC article.Review.
Cited by
- Community detection in networks by dynamical optimal transport formulation.Leite D, Baptista D, Ibrahim AA, Facca E, De Bacco C.Leite D, et al.Sci Rep. 2022 Oct 7;12(1):16811. doi: 10.1038/s41598-022-20986-y.Sci Rep. 2022.PMID:36207412Free PMC article.
- Hierarchical growth in neural networks structure: Organizing inputs by Order of Hierarchical Complexity.Leite S, Mota B, Silva AR, Commons ML, Miller PM, Rodrigues PP.Leite S, et al.PLoS One. 2023 Aug 31;18(8):e0290743. doi: 10.1371/journal.pone.0290743. eCollection 2023.PLoS One. 2023.PMID:37651418Free PMC article.
- Adding links on minimum degree and longest distance strategies for improving network robustness and efficiency.Chujyo M, Hayashi Y.Chujyo M, et al.PLoS One. 2022 Oct 26;17(10):e0276733. doi: 10.1371/journal.pone.0276733. eCollection 2022.PLoS One. 2022.PMID:36288333Free PMC article.
- From pixels to connections: exploring in vitro neuron reconstruction software for network graph generation.Hoffmann C, Cho E, Zalesky A, Di Biase MA.Hoffmann C, et al.Commun Biol. 2024 May 15;7(1):571. doi: 10.1038/s42003-024-06264-9.Commun Biol. 2024.PMID:38750282Free PMC article.Review.
- Energy Transport alongα-Helix Protein Chains: External Drives and Multifractal Analysis.Sefidkar N, Fathizadeh S, Nemati F, Simserides C.Sefidkar N, et al.Materials (Basel). 2022 Apr 10;15(8):2779. doi: 10.3390/ma15082779.Materials (Basel). 2022.PMID:35454472Free PMC article.
References
- Wang J, Rao S, Chu J, et al. A protein interaction network for pluripotency of embryonic stem cells. Nature. 2006;444(7117):364–368. - PubMed
- Jeong H, Mason SP, Barabási A-L, Oltvai ZN. Lethality and centrality in protein networks. Nature. 2001;411(6833):41–42. - PubMed
- Ideker T, Thorsson V, Ranish JA, et al. Integrated genomic and proteomic analyses of a systematically perturbed metabolic network. Science. 2001;292(5518):929–934. - PubMed
Publication types
Grants and funding
LinkOut - more resources
Full Text Sources
