Movatterモバイル変換


[0]ホーム

URL:


Skip to main page content
U.S. flag

An official website of the United States government

Dot gov

The .gov means it’s official.
Federal government websites often end in .gov or .mil. Before sharing sensitive information, make sure you’re on a federal government site.

Https

The site is secure.
Thehttps:// ensures that you are connecting to the official website and that any information you provide is encrypted and transmitted securely.

NIH NLM Logo
Log inShow account info
Access keysNCBI HomepageMyNCBI HomepageMain ContentMain Navigation
pubmed logo
Advanced Clipboard
User Guide

Full text links

Silverchair Information Systems full text link Silverchair Information Systems Free PMC article
Full text links

Actions

Comparative Study
.2021 Jul 29;38(8):3459-3477.
doi: 10.1093/molbev/msab124.

Reconstructing the Human Genetic History of Mainland Southeast Asia: Insights from Genome-Wide Data from Thailand and Laos

Affiliations
Comparative Study

Reconstructing the Human Genetic History of Mainland Southeast Asia: Insights from Genome-Wide Data from Thailand and Laos

Wibhu Kutanan et al. Mol Biol Evol..

Abstract

Thailand and Laos, located in the center of Mainland Southeast Asia (MSEA), harbor diverse ethnolinguistic groups encompassing all five language families of MSEA: Tai-Kadai (TK), Austroasiatic (AA), Sino-Tibetan (ST), Hmong-Mien (HM), and Austronesian (AN). Previous genetic studies of Thai/Lao populations have focused almost exclusively on uniparental markers and there is a paucity of genome-wide studies. We therefore generated genome-wide SNP data for 33 ethnolinguistic groups, belonging to the five MSEA language families from Thailand and Laos, and analyzed these together with data from modern Asian populations and SEA ancient samples. Overall, we find genetic structure according to language family, albeit with heterogeneity in the AA-, HM-, and ST-speaking groups, and in the hill tribes, that reflects both population interactions and genetic drift. For the TK speaking groups, we find localized genetic structure that is driven by different levels of interaction with other groups in the same geographic region. Several Thai groups exhibit admixture from South Asia, which we date to ∼600-1000 years ago, corresponding to a time of intensive international trade networks that had a major cultural impact on Thailand. An AN group from Southern Thailand shows both South Asian admixture as well as overall affinities with AA-speaking groups in the region, suggesting an impact of cultural diffusion. Overall, we provide the first detailed insights into the genetic profiles of Thai/Lao ethnolinguistic groups, which should be helpful for reconstructing human genetic history in MSEA and selecting populations for participation in ongoing whole genome sequence and biomedical studies.

Keywords: Mainland Southeast Asia; South Asian admixture; cultural diffusion; genome-wide; population interaction.

© The Author(s) 2021. Published by Oxford University Press on behalf of the Society for Molecular Biology and Evolution.


Figures
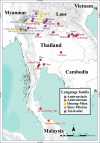
Fig. 1.
Fig. 1.
Map showing the location of the 36 Thai/Lao ethnolinguistic groups analyzed in this study, color-coded according to language family.
Fig. 2.
Fig. 2.
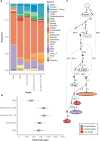
Population structure analyses. (A) Plot of PC1 versus PC2 for the SNP data for individuals from South Asia, Northeast Asia, and Southeast Asia. Individuals are numbered according to population, as indicated in supplementary table 1, Supplementary Material online and in the population labels in panel (C). Thai/Lao groups are colored by language family according to the key at the bottom of panel (C) while other groups are in gray (see supplementary fig. 3, Supplementary Material online for the same PC plot with all samples colored by country and by language family). The eigenvalues from PC1 to PC10 are shown on the bottom left side. (B) Plot focusing on Southeast Asian and Chinese populations speaking AA, AN, HM, ST, and TK languages, zoomed-in from (A). Thai/Lao groups are colored according to subgroup while other groups are in grey. (C) ADMIXTURE results forK =5 andK =6. Each individual is represented by a bar, which is partitioned intoK colored segments that represent the individual’s estimated membership fractions in each of theK ancestry components. Populations are separated by black lines for modern populations and excavation sites and time periods are separated by black lines for ancient samples. The three colored bars at the top of the plot indicate the country (top), language family (middle), and subgroup (bottom) for each sample, according to the key at the bottom. The PCA analysis was performed on the pruned data set of 842 individuals and 153,191 SNPs, while the ADMIXTURE analysis was performed on the pruned data set of 895 individuals (including 10 Mbuti, 10 French, and 33 ancient individuals) and 158,772 SNPs; the highly drifted modern populations (Onge, Mlabri, and Mamanwa) and ancient samples were projected in ADMIXTURE analyses (see PCA with ancient samples projected in supplementary fig. 3, Supplementary Material online).
Fig. 3.
Fig. 3.
Population allele sharing profiles based onf3 statistics. Heatmap of outgroupf3 statistics (Thai/Lao groups, X; Mbuti) among Thai/Lao groups (upper) panel, and between Thai/Lao and other comparative modern Asian populations and ancient samples (lower). Black blocks denote missing values. The two colored bars at the top of the plot indicate the country (top) and language family (bottom) for each comparative population; and those on the side indicate language family (left) and subgroup (right) for each Thai/Lao group, according to the key at the right.
Fig. 4.
Fig. 4.
Haplotype sharing profiles as inferred by the ChromoPainter and IBD analyses. The color bars at the top denote the countries and language families while the color bars at the left denote countries and subgroups, according to the keys. (A) Heatmap of ChromoPainter results in which the recipient Y (Thai/Lao groups) is painted by donor X (Thai/Lao and other modern Asian populations), with Y denoted by each row and X denoted by each column. The heatmap is scaled by the average length in centimorgans of the summed painted chromosomal chunks of the recipient individuals from the donor individuals. (B) Heatmap of IBD sharing among Thai/Lao comparisons and between Thai/Lao and other modern Asian populations. The heatmap is scaled by the average length in centimorgans of summed IBD blocks shared between individuals from the two groups. Black blocks denote missing values.
Fig. 5.
Fig. 5.
Admixture graphs for the Thai/Lao groups, for each language family. The node r denotes the root. White nodes denote backbone populations. Backbone population labels and Thai/Lao nodes are colored according to language family. Dashed arrows represent admixture edges, while solid arrows are drift edges reported in units of FST × 1,000. (A) backbone populations (worst-fitting Z = 0.861). (B) AA groups (worst-fitting Z = 2.101). (C) HM groups (worst-fitting Z = −2.028). (D) ST groups (worst-fitting Z = −2.873). (E) TK groups (worst-fitting Z = −2.270). (F) AN group (worst-fitting Z = −1.713).
Fig. 6.
Fig. 6.
Investigation of putative SA-related admixture. (A) GLOBETROTTER estimation of admixture sources for four Thai groups (Mon, Central Thai, SouthernThai_TK, and SouthernThai_AN) with putative SA-related ancestry, and for the Yuan group as a control without putative SA-related ancestry. Different sources are denoted by different colors. (B) GLOBETROTTER estimates of the admixture date in the SA-influenced Thai groups. Results are based on 100 bootstraps. (C) Admixture graph for the Thai groups with SA-related admixture (worst-fitting Z = −1.646). The node r denotes the root. White nodes denote backbone populations. The star-shaped node denotes the N_Indian-related source contributing to all of the SA-related Thai groups. Backbone population labels and Thai nodes are colored according to language family. Dashed arrows represent admixture edges, while solid arrows are drift edges reported in units of FST × 1,000.
See this image and copyright information in PMC

References

    1. Al-Asadi H, Petkova D, Stephens M, Novembre J.. 2019. Estimating recent migration and population-size surfaces. PLoS Genet. 15(1):e1007908. - PMC - PubMed
    1. Alexander DH, Novembre J, Lange K.. 2009. Fast model-based estimation of ancestry in unrelated individuals. Genome Res. 19(9):1655–1664. - PMC - PubMed
    1. Anderson D. 1990. Lang Rong Rien rockshelter: a Pleistocene-early Holocene archaeological site from Krabi, Southwestern Thailand. Philadelphia: University of Pennsylvania Press.
    1. Baker C, Phongpaichit P.. 2017. A history of Ayutthaya. Cambridge: Cambridge University Press.
    1. Behr AA, Liu KZ, Liu-Fang G, Nakka P, Ramachandran S.. 2016. Pong: fast analysis and visualization of latent clusters in population genetic data. Bioinformatics 32(18):2817–2823. - PMC - PubMed

Publication types

MeSH terms

LinkOut - more resources

Full text links
Silverchair Information Systems full text link Silverchair Information Systems Free PMC article
Cite
Send To

NCBI Literature Resources

MeSHPMCBookshelfDisclaimer

The PubMed wordmark and PubMed logo are registered trademarks of the U.S. Department of Health and Human Services (HHS). Unauthorized use of these marks is strictly prohibited.


[8]ページ先頭

©2009-2025 Movatter.jp