Movatterモバイル変換


[0]ホーム

URL:


Skip to main page content
U.S. flag

An official website of the United States government

Dot gov

The .gov means it’s official.
Federal government websites often end in .gov or .mil. Before sharing sensitive information, make sure you’re on a federal government site.

Https

The site is secure.
Thehttps:// ensures that you are connecting to the official website and that any information you provide is encrypted and transmitted securely.

NIH NLM Logo
Log inShow account info
Access keysNCBI HomepageMyNCBI HomepageMain ContentMain Navigation
pubmed logo
Advanced Clipboard
User Guide

Full text links

Frontiers Media SA full text link Frontiers Media SA Free PMC article
Full text links

Actions

Share

Review
.2021 Jan 18:8:598487.
doi: 10.3389/fchem.2020.598487. eCollection 2020.

Challenges and Strategies of Chemical Analysis of Drugs of Abuse and Explosives by Mass Spectrometry

Affiliations
Review

Challenges and Strategies of Chemical Analysis of Drugs of Abuse and Explosives by Mass Spectrometry

Ahsan Habib et al. Front Chem..

Abstract

In analytical science, mass spectrometry (MS) is known as a "gold analytical tool" because of its unique character of providing the direct molecular structural information of the relevant analyte molecules. Therefore, MS technique has widely been used in all branches of chemistry along with in proteomics, metabolomics, genomics, lipidomics, environmental monitoring etc. Mass spectrometry-based methods are very much needed for fast and reliable detection and quantification of drugs of abuse and explosives in order to provide fingerprint information for criminal investigation as well as for public security and safety at public places, respectively. Most of the compounds exist as their neutral form in nature except proteins, peptides, nucleic acids that are in ionic forms intrinsically. In MS, ion source is the heart of the MS that is used for ionizing the electrically neutral molecules. Performance of MS in terms of sensitivity and selectivity depends mainly on the efficiency of the ionization source. Accordingly, much attention has been paid to develop efficient ion sources for a wide range of compounds. Unfortunately, none of the commercial ion sources can be used for ionization of different types of compounds. Moreover, in MS, analyte molecules must be released into the gaseous phase and then ionize by using a suitable ion source for detection/quantification. Under these circumstances, fabrication of new ambient ion source and ultrasonic cutter blade-based non-thermal and thermal desorption methods have been taken into account. In this paper, challenges and strategies of mass spectrometry analysis of the drugs of abuse and explosives through fabrication of ambient ionization sources and new desorption methods for non-volatile compounds have been described. We will focus the literature progress mostly in the last decade and present our views for the future study.

Keywords: ambient ionization source; drugs of abuse; explosives; headspace method; hollow cathode discharge ionization; mechanism of ionization and desorption; non-thermal desorption; tribological effect.

Copyright © 2021 Habib, Bi, Hong and Wen.


Conflict of interest statement

HH was employed by company China Innovation Instrument Co., Ltd, Ningbo 315000, Zhejiang, China. The remaining authors declare that the research was conducted in the absence of any commercial or financial relationships that could be construed as a potential conflict of interest.

Figures

Scheme 1
Scheme 1
Molecular structures of the illicit drug compounds.
Scheme 2
Scheme 2
Molecular structures of the explosive compounds.
Figure 1
Figure 1
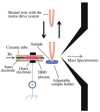
A diagram of homemade He-DBD ion source coupled with MS(A), mass spectrum of morphine in positive ion mode(B) and mass spectrum of RDX in negative ion mode(C). An ultrasonic cutter-assisted desorption method was used for desorption of the non-volatile illicit drugs and explosives. The inset is the photograph of ultrasonic cutter-PFA solid/solid experimental system. Reproduced under permission from ACS (Habib et al., 2014).
Figure 2
Figure 2
A schematic of experimental set-up for tribodesorption-dielectric barrier discharge ionization-mass spectrometry (TB-DBDI-MS) system. The sample deposited on the ultrasonic blade and gently touches on PFA substrate's surface by hand holding (frequency: 40 kHz, oscillating amplitude: 15 μm) for desorption. A homemade He-DBD ion source was used to ionize the analyte molecules and then characterized by using an ion trap mass spectrometer.
Figure 3
Figure 3
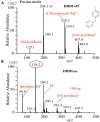
Mass spectra for p-chloro-benzyl pyridinium chloride with DBD turned(A) off and(B) on. Reproduced under permission from ACS (Habib et al., 2014).
Figure 4
Figure 4
Mass spectra for(A) 2 ng morphine,(A1) 2 ng morphine in urine,(B) 2 ng cocaine,(B1) 2 ng cocaine in urine,(C) 2 ng codeine and(D) morphine in urine. Each of the illicit drugs was deposited on a perfluoroalkoxy (PFA) substrate and then rubbed by an ultrasonic cutter blade for desorption. The gaseous molecules were then ionized using a homemade helium DBDI source and detected by MS. Reproduced under permission from ACS (Habib et al., 2014) and EJMS (Usmanov et al., 2020).
Figure 5
Figure 5
Schematic of the experimental setup for the heated filament-based desorption-DBDI-MS system.
Figure 6
Figure 6
Mass spectra for the drugs of abuse(A) morphine,(B) codeine, and(C) cocaine. The ions atm/z 158, 195, and 279 in(B) are from background. Reproduced under permission from ACS (Usmanov et al., 2013).
Figure 7
Figure 7
Mass spectra for(A) HMTD (2 ng),(B) AN (10 ng),(C) RDX (2 ng), and(D) HMX (2 ng). Each of the explosives was deposited on a perfluoroalkoxy (PFA) substrate and then rubbed by an ultrasonic cutter blade for desorption. The gaseous molecules were then ionized using a homemade helium DBDI ion source and detected by an iron trap MS. Reproduced under permission from ACS (Habib et al., 2014).
Figure 8
Figure 8
A schematic of headspace-He-DBDI coupled with MS(A), headspace method(B) and mass spectrum of four amphetaminic drug compounds in positive ion mode(C). In headspace method, the drugs of abuse of interest were treated with alkali solution for gasification. Reproduced under permission from Elsevier (Habib et al., 2020).
Figure 9
Figure 9
Mass spectra for(A) amphetamine (AM),(A1) amphetamine in urine,(B) methamphetamine (MA),(B1) methamphetamine (MA) in urine,(C) 3,4-methylenedioxyamphetamine (MDA),(C1) 3,4-methylenedioxyamphetamine (MDA),(D) 3,4-methylenedioxymethamphetamine (MDMA) and(D1) (D) 3,4-methylenedioxymethamphetamine (MDMA) measured by headspace-DBDI-MS system. Amount of each amphetamine compound was 1 ng/mL in water as standard and spiked in raw urine and then treated by equal volume of ammoniated K2CO3 solution [85% K2CO3 (4 M) + 15% NH3 (28%)]. Reproduced under permission from Elsevier (Habib et al., 2014).
Figure 10
Figure 10
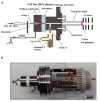
A schematic of the fabricated hollow cathode discharge (HCD) ion source(A). The length of cathode electrode is 5 mm and its inner diameter is 2 mm. An insulator made of aluminum oxide (5 mm thick) is for separation of the cathode and anode. An aperture with 1 mm diameter is for getting ions into the 1 Torr vacuum stage is 1 mm. A stainless steel capillary (ion transfer tube) with an i.d. of 4 mm is used to transfer ions from the ion source to the S-lens. The difference between the aperture and the exit of the transfer tube is 24 mm. There is a ~3 mm gap between the edge of the transfer tube and the first electrode of the S-lens. A photograph for the HCD ion source(B). The dotted-line box around the portion of the photograph shows part(A). Reproduced under permission from Wiley (Habib et al., 2015).
Figure 11
Figure 11
Background mass spectra for hollow cathode discharge (HCD) ion source measured at 5 Torr:(A) positive ion mode and(B) negative ion mode. Reproduced under permission from Wiley (Habib et al., 2015).
Figure 12
Figure 12
Positive ion mode hollow cathode discharge (HCD) mass spectra for(A) TATP (headspace) measured at 5 Torr,(A1) TATP (headspace) measured at 28 Torr,(B) HMTD (200 pg) measured at 5 Torr, and(B1) HMTD (200 pg) measured at 28 Torr. Reproduced under permission from Wiley (Habib et al., 2015).
Figure 13
Figure 13
Mass spectra for(A) RDX (5 Torr),(A1) RDX (28 Torr),(B) PETN (5 Torr),(B1) PETN (28 Torr),(C) TNT (5 Torr), and(C1) TNT (28 Torr) measured by the HCD ion source in the negative ion mode. The MS/MS spectrum of [TNT-H+O] (m/z 242) is shown in the inset (CID: 25%). Reproduced under permission from Wiley (Habib et al., 2015).
Figure 14
Figure 14
Mass spectra for(A) RDX (1 ng),(B) PETN (10 ng), and TNT (2 ng) at 1 Torr using the HCD ion source in the negative ion mode. Reproduced under permission from Wiley (Habib et al., 2015).
Figure 15
Figure 15
A diagram of the HCD ion source(A) (details are shown in Figure 10). Mass spectra of TNT using air(B) and N2(C) as carrier gas in the negative ion mode under ion source pressure 5 Torr. The inset depicts the MS/MS mass spectrum for the TNT molecular ion, [TNT] (m/z 227), with 25% of CID. Reproduced under permission from Wiley (Habib et al., 2015).
Figure 16
Figure 16
Experimental set ups for ac- and dc corona-based APCI. A stainless steel made acupuncture needle, having 0.12 mm of o.d. and 700 nm of tip diameter, was used as an electrode. The needle was positioned at 3 mm far from the inlet of the mass spectrometer.(A) for open space system and(B) for plastic (PFA) tube with 8 mm long and its i.d.: 2 mm and o.d.: 4 mm. Reproduced under permission from Wiley (Habib et al., 2013).
Figure 17
Figure 17
Mass spectra of TATP (head-space gas) in the positive ion mode(A) dc-APCI without plastic tube (applied voltage: +2.5 kV dc),(B) ac-APCI without plastic tube (applied voltage: 2.6 kVptp ac),(C) dc-APCI with plastic tube (applied voltage: +3.4 kV dc), and(D) ac-APCI with plastic tube (applied voltage: 2.7 kVptp ac). Reproduced under permission from Wiley (Habib et al., 2013).
Figure 18
Figure 18
Mass spectra of TNT in the negative ion mode(A) dc-APCI without plastic tube (dc applied voltage: −1.5 kV),(B) ac-APCI without plastic tube (ac applied voltage: 2.6 kVptp),(C) dc-APCI with plastic tube (applied voltage: −2.3 kV dc),(D) ac-APCI with plastic tube (applied voltage: 2.7 kVptp ac),(E) TNB, dc-APCI with plastic tube (applied voltage: −2.3 kV dc), and(F) TNB, ac-APCI with plastic tube (applied voltage: 2.7 kVptp ac). Reproduced under permission from Wiley (Habib et al., 2013).
Figure 19
Figure 19
Scanning electron microscope (SEM) images of acupuncture needles made of stainless steel:(A) before use,(B) ac corona discharge in open space for 20 h (applied voltage: 2.6 kVptp ac),(C) –dc corona discharge in open space for 20 h (applied voltage: 1.5 kV dc), and(D) +dc corona discharge in open space for 20 h (applied voltage: +2.5 kV dc at the start and +2.8 kV dc after 20 h). Reproduced under permission from Wiley (Habib et al., 2013).
Figure 20
Figure 20
Energy dispersive X-ray spectroscopy (EDX) spectra for the stainless steel acupuncture needle:(A) needle body and(B) eroded part. Reproduced under permission from Wiley (Habib et al., 2013).
See this image and copyright information in PMC

Similar articles

See all similar articles

Cited by

References

    1. Abdelhamid H. N. (2018). Nanoparticle assisted laser desorption/ionization mass spectrometry for small molecule analytes. Microchim. Acta 185:200. 10.1007/s00604-018-2687-8 - DOI - PubMed
    1. Abdelhamid H. N. (2019a). Nanoparticle-based surface assisted laser desorption ionization mass spectrometry: a review. Microchim. Acta 186:682. 10.1007/s00604-019-3770-5 - DOI - PubMed
    1. Abdelhamid H. N. (2019b). Nanoparticles assisted laser desorption/ionization mass spectrometry, in Chapter 23: Handbook of Smart Materials in Analytical Chemistry (Chichester: John Wiley & Sons, Ltd; ), 729–755.
    1. Abdelhamid H. N., Chen Z. Y., Wu H. F. (2017). Surface tuning laser desorption/ionization mass spectrometry (STLDI-MS) for the analysis of small molecules using quantum dots. Anal. Bioanal. Chem. 409, 4943–4950. 10.1007/s00216-017-0433-4 - DOI - PubMed
    1. Abdelhamid H. N., Wu H.-F. (2019a). Graphene and its derivatives as platforms for MALDI-MS, in Handbook of Graphene 2, Vol 2: Physics, Chemistry and Biology, eds Tobias S. (Beverly, MA: Scrivener Publishing; ).

Publication types

LinkOut - more resources

Full text links
Frontiers Media SA full text link Frontiers Media SA Free PMC article
Cite
Send To

NCBI Literature Resources

MeSHPMCBookshelfDisclaimer

The PubMed wordmark and PubMed logo are registered trademarks of the U.S. Department of Health and Human Services (HHS). Unauthorized use of these marks is strictly prohibited.


[8]ページ先頭

©2009-2025 Movatter.jp