Movatterモバイル変換


[0]ホーム

URL:


Skip to main page content
U.S. flag

An official website of the United States government

Dot gov

The .gov means it’s official.
Federal government websites often end in .gov or .mil. Before sharing sensitive information, make sure you’re on a federal government site.

Https

The site is secure.
Thehttps:// ensures that you are connecting to the official website and that any information you provide is encrypted and transmitted securely.

NIH NLM Logo
Log inShow account info
Access keysNCBI HomepageMyNCBI HomepageMain ContentMain Navigation
pubmed logo
Advanced Clipboard
User Guide

Full text links

MDPI full text link MDPI Free PMC article
Full text links

Actions

Share

Review
.2020 Dec 25;13(1):16.
doi: 10.3390/toxins13010016.

Development of Anti-Virulence Therapeutics against Mono-ADP-Ribosyltransferase Toxins

Affiliations
Review

Development of Anti-Virulence Therapeutics against Mono-ADP-Ribosyltransferase Toxins

Miguel R Lugo et al. Toxins (Basel)..

Abstract

Mono-ADP-ribosyltransferase toxins are often key virulence factors produced by pathogenic bacteria as tools to compromise the target host cell. These toxins are enzymes that use host cellular NAD+ as the substrate to modify a critical macromolecule target in the host cell machinery. This post-translational modification of the target macromolecule (usually protein or DNA) acts like a switch to turn the target activity on or off resulting in impairment of a critical process or pathway in the host. One approach to stymie bacterial pathogens is to curtail the toxic action of these factors by designing small molecules that bind tightly to the enzyme active site and prevent catalytic function. The inactivation of these toxins/enzymes is targeted for the site of action within the host cell and small molecule therapeutics can function as anti-virulence agents by disarming the pathogen. This represents an alternative strategy to antibiotic therapy with the potential as a paradigm shift that may circumvent multi-drug resistance in the offending microbe. In this review, work that has been accomplished during the past two decades on this approach to develop anti-virulence compounds against mono-ADP-ribosyltransferase toxins will be discussed.

Keywords: anti-virulence agents; bacterial toxins; drug discovery; mono-ADP-ribosyltransferase toxins; protein crystallography; virtual screening.


Conflict of interest statement

The authors declare no conflict of interest.

Figures

Figure 1
Figure 1
Summary of the yeast synthetic-lethal phenotypic screening assay to characterize and identify new bacterial virulence factors and small-molecule inhibitors against mono-ADP-ribosyltransferase (mART) toxins. (1)S. cerevisiae is grown to log phase and transformed with linear CUPI plasmid and toxin gene insert flanked by 20 base pairs homologous to the plasmid. (2) Successful transformants are grown in selective media where yeast culture is supplemented with Cu2+ to induce a growth-defect phenotype. (3) Alternatively, small-molecule compounds are added to the culture medium upon induction of the toxin gene to reverse the phenotype. (4) Inhibitors shown to reverse the growth-defect phenotype in yeast are later characterized in target host cell lines to define their therapeutic potential.
Figure 2
Figure 2
mART toxin anti-virulence development. mART inhibitors are gleaned from virtual screening by targeting high-resolution structure of a toxin-inhibitor complex and directed libraries, followed by in vitro testing against mART targets. Promising compounds are tested for protection of the target host cells from mART cytotoxicity and for chemical toxicity. Leads are co-crystallized with their cognate toxin followed by lead optimization through combinatorial chemistry and retesting. Periodically, the best leads are also tested for efficacy and toxicity in animal infection models and are then made available for pharmaceutical partners. QSARs/SARs refers to Quantitative Structure-Activity Relationships/Structure-Activity Relationships.
Figure 3
Figure 3
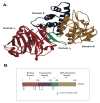
X-ray and domain structure ofP. aeruginosa exotoxin A (ExoA). (A) X-ray structure of full-length, mature ExoA at 1.6 Å (PDB:1IKQ) showing the four domains. (B) Primary structure cartoon showing the relationship between structural and functional domains of ExoA.
Figure 4
Figure 4
Cytotoxic pathways ofPseudomonas exotoxin A (ExoA). After cleavage of the C-terminal lysine (K) by plasma carboxypeptidases (PCPs), ExoA binds to the CD91 receptor on the cell membrane (CM) and can then exploit different pathways to reach the endoplasmic reticulum (ER). On the one side, ExoA is internalized via clathrin-coated pits (CCPs) into the cell. This is followed by furin cleavage in the early endosomes (EEs) in cooperation with protein disulfide isomerase (PDI) and chaperones (Chaps). Then, the enzymatic active ExoA fragment travels via late endosomes (LEs) in a Rab9-dependent manner to the trans-Golgi network (TGN). After binding to the KDEL receptor (KDEL-R), ExoA is transported to the ER under control of the tyrosine kinase Src. On the other side, CD91-bound ExoA can associate with detergent-resistant microdomains (DRMs) and is transported via caveosomes (CSs) to the EE in a Rab5-dependent manner. After cleavage in the EE, the toxic ExoA fragment directly travels to the ER via a lipid-dependent sorting pathway under the control of Rab6. ExoA fragments in the ER are secreted via the translocon Sec61p into the cytosol, where they inhibit the protein synthesis by ADP-ribosylating the eukaryotic elongation factor 2 (eEF2) at the ribosomes (Rs). This finally leads to apoptosis of the host cell. Figure was taken from reference [60].
Figure 5
Figure 5
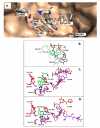
ExoA with PJ34 inhibitor. (A) PJ34 inhibitor binds into the nicotinamide pocket and is held in place through hydrophobic contacts and H-bonds including two notable H-bonds with Gly441 (main chain) and Gln485 (side-chain oxygen) (PDB:1XK9). The Tyr481 phenyl side-chain shows van der Waals interactions with PJ34 (4 Å away) and the two aromatic rings exhibit π–π associations. Tyr470 is more distant from PJ34 at a 40° angle and does not provide much stability to the bound inhibitor. (B) Superposed structure of PE24H-PJ34 (shown in lime green) on the ExoA Domain III in complex with β-TAD, an NAD+-analogue (shown in black, PDB entry 1AER (8)). β-TAD mimics nicotinamide of NAD+ with its thiazole substituent. (C,D) Superposed structure of PJ34-PE24H (shown in orange) with (C) DT (shown in pink, PDB entry 1TOX (13)) or (D) PARP-NU1025 (shown in pink, PDB entry 4PAX). A catalytic loop of ExoA (termed LOOP) is shown and includes residues 482 to 487, 66 to 71 in DT or 908 to 913 in PARP. In the DT comparison (C), the PJ34 inhibitor (green) is shown; for PARP, (D) the inhibitor NU1025, 8-hydroxy-2-methyl-3-hydro-quinazolin-4-one (green), is shown and the PJ34 ligand was omitted to demonstrate the similar orientation of a PARP inhibitor within the toxin active site as PJ34.
Figure 6
Figure 6
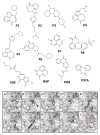
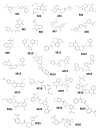
Chemical and X-ray structures of ExoA and cholix inhibitors.Top panel: The P-series (P1-P8) compounds are shown along with V30, the most active V-series compounds. Additionally, shown are two previously characterized ExoA inhibitors, 1,8-naphthalimide (NAP) and N-(6-oxo-5,6-dihydrophenanthridin-2-yl)-(N,N-dimethylamino) acetamide hydrochloride (PJ34). The chemical structures of a NAP derivative, 4-amino-NAP, and the parent compound for PJ34 (PJ97A) are also shown.Bottom panel: X-ray crystal structures of the catalytic fragment of cholix bound to inhibitor compounds. (A) cholix-P1, (B) cholix-P2,(C) cholix-P3, (D) cholix-P4, (E) cholix-P5, (F) cholix-P6, (G) cholix-P7, (H) cholix-P8, (I) cholix-V30, and (J) model of cholix-NAD+ complex. The inhibitors and the NAD+ substrate are shown with standard atom colors and nearby residues are shown as black sticks. Hydrogen bonds are shown in orange dashed lines. The model of the cholix-NAD+ complex is based upon the ExoA-NAD+ complex (PDB:3B78).
Figure 7
Figure 7
Two-dimensional chemical drawings of catalytic fragments of cholix-inhibitor complexes based on the corresponding crystal structures. (A) cholix-P1, (B) cholix-P2, (C) cholix-P3, (D) cholix-P4, (E) cholix-P5, (F) cholix-P6, (G) cholix-P7, (H) cholix-P8, (I) cholix-V30, and (J) cholix-NAP. Two-dimensional cholix-inhibitor visualization was achieved from the respective PDB files, using Open Babel (http://openbabel.sourceforge.net/) to convert these coordinates to structure data format and then drawing the complex using PoseView (http://poseview.zbh.uni-hamburg.de/).
Figure 8
Figure 8
Cholix toxin active-site loops. Cholix-NAD+ complex ribbon revealing loops within the active-site (green). The L1–L4 loops (substrate binding) and the L4–L5 loops (target recognition) are also shown. The loop nomenclature is taken from the ExoA loop definition; for cholix toxin, the active-site loops include L1: Arg471-Thr483; L2: Thr544- Pro547; L3: Glu574-Glu579; L4: Gly503-Gly512; and L5: Gly601-Asp610. Arg479 and Lys508 C-atoms are shown in black and L1 and L4 loops are designated as R- and K-loops, respectively in cholix. The bound NAD+ substrate is depicted in grey C-atoms.
Figure 9
Figure 9
The topology drawings of V30, PJ34, and P-series inhibitors bound within the cholix active site. The pocket residues interacting with the inhibitors are shown as colors and their identities are indicated in the legend. The two red circles show the common interaction with active-site side chains.
Figure 10
Figure 10
Vis interactions with NAD+ substrate and M6 inhibitor. H-bonds and interacting surfaces between pocket Vis residues and M6 are shown (in cyan C-atoms, panels A–G) and NAD+ (panel H). (A) Pocket residues are shown that define the van der Waals surface around M6. (B) Slice of the surface in (A), showing the N-subpocket with the M6 ring-system; the acetate carboxylate protrudes from the pocket. An empty sub-cavity is observed near Tyr172. (C) Superposition of three main pharmacophoric properties of the Vis receptor. NAD+ active pose (C-atoms in orange) is shown within the Vis-NAD+ complex, superposed onto the Vis-M6 pocket. There is a clear match between the amide group of NADs+ and the carbonyl and secondary amine of M6, with co-localization of the M6 benzene ring with the pyridinium ring of NAD+. The location of the NAD+ N-ribose occupies the void volume described in (B) by interacting with catalytic residues at the E-X-E motif (Glu189 and Glu191). (D) H-bond network between M6 and Arg117 and Gly118 of Vis. Arg117 is an H-donor by three different H-bond types (including an H-Pi type, red dashed line), binding the ligand at three points. In contrast, Gly118 participates in two conserved reciprocal H-bonds with the functional group at the core of M6. The numbers shown are the strength of the H-bond interaction in kcal/mol. (E) Anchoring of the M6 tail via H-bonds with Arg177 and two water-mediated bridges with Gly118 (left) and Tyr72 (right). (F) Lateral view of Phe153 and M6 with their molecular surfaces colored by electrostatic potential (blue positive, red negative). This slice shows that the planar moieties make favorable van der Waals interactions through contact with both surfaces. (G) Upper view of Phe153 and M6 by 90° rotation of the perspective in panel (F). Thus, dihydropyridazine ring of M6 is mainly responsible for the stacking interactions with Phe153. (H) Phe153 and NAD+ are shown in the Vis-NAD+ complex. The substrate and side-chain moieties make weak van der Waals contacts because their molecular surfaces either clash (red oval) or are not in contact (blue ovals). The figure was taken from reference [32].
Figure 11
Figure 11
M-series inhibitors tested against Vis ADP-ribosyltransferase activity. The highest-scoring compounds from a virtual screen against iota toxin in complex with NADH (PDB code: 1GIQ) (designated the M-series) were chosen for testing as inhibitors against Vis ADP-ribosyltransferase enzyme activity.M1: 1-[2-[4-amino-6-(dimethylamino)-1,3,5-triazin-2-.yl]ethyl}-3-[(1S)-2,3-dihydro-1H-inden-1-yl]urea);M2: 2-[(3-methyl-2,6-dioxo-7-propyl-2,3,6,7-tetrahydro-1H-purin-8-yl)sulfanyl]acetamide;M3: N-[[(3R)-1-{1H-pyrazolo[3,4-d]pyrimidin-4-yl]piperidin-3-yl]methyl]methanesulfonamide;M4: 6-[(1S)-1-[(6-ethoxy-1H-1,3-benzodiazol-2-yl)sulfanyl]ethyl]-N2,N2-dimethyl-1,3,5-triazine-2,4-diamine;M5: N-[2-(4-fluorophenyl)ethyl]-1,4-dioxo-1,2,3,4-tetrahydrophthalazine-6-carboxamide;M6: 2-(4-oxo-3,4-dihydrophthalazin-1-yl)acetate;M7: 3-([[(S)-cyclopropyl(4-methylphenyl)methyl]carbamoyl]methoxy)benzamide;M8: N-(3-acetylphenyl)-5-(3-methyl-1H-pyrazol-5-yl)thiophene-2-sulfonamide;M9: (2S)-2-(4-oxo-3,4-dihydrophthalazin-1-yl)propanoate;M10: (2S)-N-[(3-chlorophenyl)methyl]-2-(7H-purin-6-ylsulfanyl)propanamide;M11: (1S)-2-[[3-(methylsulfanyl)-1H-pyrazolo[3,4-d]pyrimidin-4-yl]amino]-1-phenylethan-1-ol;M12: N-[(2R)-2-hydroxy-2-phenylethyl]-2-([6-oxo-6H,7H,8H,9H,10H-cyclohexa[c]chromen-3-yl]oxy)acetamide;M13: N-[(2R)-2-hydroxy-2-phenylethyl]-2-([6-oxo-6H-benzo[c]chromen-3-yl]oxy)acetamide;M14: N-[(1R)-1-(5-chloro-1-benzofuran-2-yl)ethyl]-2-(3-methyl-2,6-dioxo-2,3,6,7-tetrahydro-1H-purin-7-yl)acetamide;M15: (2S)-3-(4-hydroxyphenyl)-2-[2-(4-oxo-3,4-dihydrophthalazin-1-yl)acetamido]propanoate;M16: [(2-[[(1S)-1-phenylethyl]carbamoyl]phenyl)carbamoyl]methyl 2-(4-oxo-3,4-dihydrophthalazin-1-yl)acetate;M17: 3-[(4-cyanophenyl) carbamoyl]-5-(hydroxymethyl)-8-methyl-2H-pyrano [2,3-c]pyridin-2-iminium;M18: 2-fluoro-5-[[(1H-pyrazol-3-ylmethyl)carbamoyl]amino]benzamide;M19: methyl (2S)-2-[2-(2,4-dioxo-1,2,3,4-tetrahydroquinazolin-1-yl)acetamido]-3-(1H-indol-3-yl)propanoate;M20: N-[(1R)-1-[2-[(dimethylcarbamoyl)methoxy]phenyl]propyl]-3-(4-oxo-3,4-dihydroquinazolin-2-yl)propanamide;M21: 3-[(2,4-dimethoxyphenyl)carbamoyl]-5-(hydroxymethyl)-8-methyl-2H-pyrano[2,3-c]pyridin-2-iminium;M22: [4-amino-6-[(2-methylphenyl) amino]-1,3,5-triazin-2-yl]methyl 4-oxo-3,4-dihydrophthalazine-1-carboxylate;M23: 5-([[(1S)-1-(2H-1,3-benzodioxol-5-yl)ethyl]carbamoyl]amino)-2-fluorobenzamide;M24: 3-[([[(1R)-1-phenylethyl] carbamoyl]methyl) amino]benzamide;M25: (3S)-N-(3-carbamoyl-4-fluorophenyl)-3-(3-methyl-1,2,4-oxadiazol-5-yl)piperidine-1-carboxam;M26: 5-([[(1R,2S)-2-tert-butyl cyclohexyl] carbamoyl]amino) -2-fluorobenzamide. Figure was taken from reference [32].
Figure 12
Figure 12
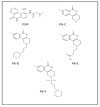
P-series inhibitors effective against Scabin GH activity. The chemical structures of the following Scabin inhibitors are shown: PJ34, 2-[[3-(dimethylamino)-2-oxopropyl]amino]-5,6-dihydrophenanthridin-6-one; P6-C, 8-fluoro-1H,2H,3H,4H,5H,6H-benzo[c]1,6-naphthyridin-6-one; P6-D, 8-fluoro-2-[3-(piperidin-1-yl)propyl]-1H,2H,3H,4H,5H,6H-benzo[c]1,6-naphthyridin-6-one; P6-E, 4-[8-fluoro-6-oxo-1H,2H,3H,4H,5H,6H-benzo[c]1,6-naphthyridin-2-yl]butanoic acid; P6-F, 8-fluoro-2-[3-(piperidin-1-yl)propanesulfonyl]-1H,2H,3H,4H,5H,6H-benzo[c]1,6-naphthyridin-6-one. Figure was taken from reference [24].
Figure 13
Figure 13
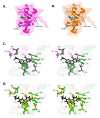
Scabin inhibitor co-crystal structures (A) The structure of the Scabin-PJ34 complex is shown as a ribbon diagram. PJ34 is shown in stick format (colored black). (B) The Scabin-P6-E complex is shown in ribbon format. P6-E is represented in stick format (black). (C) A stereo view of the Scabin-PJ34 active-site (magenta) and Scabin-apo structure (green). PJ34 is shown in stick format (colored black). The differences in structure among important catalytic residues (Arg77 Ser78, Lys94, Asn110, Ser117, Thr119, Leu124, Try128, Gln158, Glu160) are highlighted. (D) Stereo view of the Scabin-P6-E complex structure (magenta) and Scabin-apo structure (green). P6-E is represented in stick format (black). Structural differences are highlighted among important catalytic residues (Arg77 Ser78, Lys94, Asn110, Ser117, Thr119, Leu124, Try128, Gln158, Glu160). Figure was taken from reference [24].
Figure 14
Figure 14
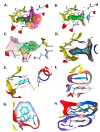
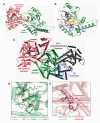
Certhrax structure. (A) Certhrax crystal structure with no bound ligand bound. The protective antigen (PA)-binding domain is shown in pink; the mART domain is illustrated in green. (B) Certhrax catalytic domain. Important catalytic residues are shown in orange stick representation (R341), magenta (Q429, E431), and yellow (STS motif 387–389). The PN loop is shown in purple, and the ARTT loop is highlighted in blue. (C) Superposition of Certhrax (pale colors) with anthrax LF (bold colors) and they are aligned with respect to the mART domains. The domains colored as in Figure 1B with the additional anthrax LF insertion domain and zinc metalloprotease domain in blue and grey, respectively. (D) Important Certhrax active site residues are shown in light green and anthrax LF aligned residues are depicted in dark green. Residues not shown in the amino acid sequence are indicated as numbers in parentheses. (E) Residues important for PA binding are structurally aligned in Certhrax (pink) and anthrax LF (red). Residues shown in stick representation are highlighted and are shown as text sequence beneath. Figure was taken from reference [31].
Figure 15
Figure 15
Certhrax structure with bound inhibitors. (A) Certhrax (PA-binding domain, pink; mART domain, yellow) in complex with P6 inhibitor (black). (B) P6 interactions with Certhrax active-site residues. Active-site residues are shown in stick representation, and P6 is shown in ball-and-stick (black). Arg342 (orange) and Tyr284 (blue) form H-bonds with the inhibitor (dashed lines), while Tyr398 (cyan) has aromatic interactions. Additional active site residues are depicted in pink (Q-x-E motif) and green (STS motif). (C) P6 electron density is shown when bound to Certhrax. Simulated annealing omit map around the inhibitor is shown in blue (contoured at 1σ). Figure was taken from reference [31].
Figure 16
Figure 16
C3larvin GH activity inhibited by M3. (A) C3larvin dose–response with M3 inhibitor. M3 inhibitor caused the loss of GH activity as described under Experimental Procedures and the IC50 value was calculated from the data. Error bars, S.D. from at least three experiments. Inset to (A): Structure of the M3 inhibitor, N-[(1-[1H-pyrazolo[3,4-d]pyrimidin-4-yl]piperidin-3-yl)methyl]methanesulfonamide. (B) C3larvin pocket definition (gray surface) based on the NAD+ active conformation (green C-atoms). (C) C3larvin pharmacophore model. C3larvin with modeled NAD+ and with M3 (cyan C-atoms) superposed (manually) to the adenine ring-system, to depict the common features. The pharmacophore definition based on the NAD+ adenine moiety is shown as orange spheres/mesh and the anion-center feature is depicted as a large yellow sphere. (D) Docked poses of M3 (cyan C-atoms), with only the features at the adenine moiety and an induced fit (flexible) receptor. The M3 ring-system is rotated relative to the previous slide. Figure was taken from reference [33].
See this image and copyright information in PMC

Similar articles

See all similar articles

Cited by

References

    1. Zucca M., Scutera S., Savoia D. New antimicrobial frontiers. Mini. Rev. Med. Chem. 2011;11:888–900. doi: 10.2174/138955711796575498. - DOI - PubMed
    1. Lakemeyer M., Zhao W., Mandl F.A., Hammann P., Sieber S.A. Thinking outside the box—Novel antibacterials to tackle the resistance crisis. Angew. Chem. Int. Ed. Engl. 2018;57:14440–14475. doi: 10.1002/anie.201804971. - DOI - PubMed
    1. Habboush Y., Guzman N. Antibiotic Resistance. StatPearls; Treasure Island, FL, USA: 2020.
    1. Talbot G.H., Bradley J., Edwards J.E., Jr., Gilbert D., Scheld M., Bartlett J.G. Bad bugs need drugs: An update on the development pipeline from the Antimicrobial Availability Task Force of the Infectious Diseases Society of America. Clin. Infect. Dis. 2006;42:657–668. doi: 10.1086/499819. - DOI - PubMed
    1. Payne D.J. Microbiology. Desperately seeking new antibiotics. Science. 2008;321:1644–1645. doi: 10.1126/science.1164586. - DOI - PubMed

Publication types

MeSH terms

Substances

Related information

Grants and funding

LinkOut - more resources

Full text links
MDPI full text link MDPI Free PMC article
Cite
Send To

NCBI Literature Resources

MeSHPMCBookshelfDisclaimer

The PubMed wordmark and PubMed logo are registered trademarks of the U.S. Department of Health and Human Services (HHS). Unauthorized use of these marks is strictly prohibited.


[8]ページ先頭

©2009-2025 Movatter.jp