Asphalt-related emissions are a major missing nontraditional source of secondary organic aerosol precursors
- PMID:32917599
- PMCID: PMC7467703
- DOI: 10.1126/sciadv.abb9785
Asphalt-related emissions are a major missing nontraditional source of secondary organic aerosol precursors
Abstract
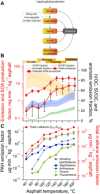
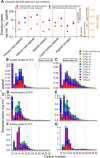
Asphalt-based materials are abundant and a major nontraditional source of reactive organic compounds in urban areas, but their emissions are essentially absent from inventories. At typical temperature and solar conditions simulating different life cycle stages (i.e., storage, paving, and use), common road and roofing asphalts produced complex mixtures of organic compounds, including hazardous pollutants. Chemically speciated emission factors using high-resolution mass spectrometry reveal considerable oxygen and reduced sulfur content and the predominance of aromatic (~30%) and intermediate/semivolatile organic compounds (~85%), which together produce high overall secondary organic aerosol (SOA) yields. Emissions rose markedly with moderate solar exposure (e.g., 300% for road asphalt) with greater SOA yields and sustained SOA production. On urban scales, annual estimates of asphalt-related SOA precursor emissions exceed those from motor vehicles and substantially increase existing estimates from noncombustion sources. Yet, their emissions and impacts will be concentrated during the hottest, sunniest periods with greater photochemical activity and SOA production.
Copyright © 2020 The Authors, some rights reserved; exclusive licensee American Association for the Advancement of Science. No claim to original U.S. Government Works. Distributed under a Creative Commons Attribution NonCommercial License 4.0 (CC BY-NC).
Figures


Similar articles
- Anthropogenic Secondary Organic Aerosol and Ozone Production from Asphalt-Related Emissions.Seltzer KM, Rao V, Pye HOT, Murphy BN, Place BK, Khare P, Gentner DR, Allen C, Cooley D, Mason R, Houyoux M.Seltzer KM, et al.Environ Sci Atmos. 2023 Jul 9;3:1221-1230. doi: 10.1039/d3ea00066d.Environ Sci Atmos. 2023.PMID:39206140Free PMC article.
- Primary and Secondary Organic Aerosol Formation from Asphalt Pavements.Humes MB, Machesky JE, Kim S, Oladeji OJ, Gentner DR, Donahue NM, Presto AA.Humes MB, et al.Environ Sci Technol. 2023 Dec 5;57(48):20034-20042. doi: 10.1021/acs.est.3c06037. Epub 2023 Nov 6.Environ Sci Technol. 2023.PMID:37931038Free PMC article.
- Primary gas- and particle-phase emissions and secondary organic aerosol production from gasoline and diesel off-road engines.Gordon TD, Tkacik DS, Presto AA, Zhang M, Jathar SH, Nguyen NT, Massetti J, Truong T, Cicero-Fernandez P, Maddox C, Rieger P, Chattopadhyay S, Maldonado H, Maricq MM, Robinson AL.Gordon TD, et al.Environ Sci Technol. 2013 Dec 17;47(24):14137-46. doi: 10.1021/es403556e. Epub 2013 Nov 27.Environ Sci Technol. 2013.PMID:24261886
- Review of Urban Secondary Organic Aerosol Formation from Gasoline and Diesel Motor Vehicle Emissions.Gentner DR, Jathar SH, Gordon TD, Bahreini R, Day DA, El Haddad I, Hayes PL, Pieber SM, Platt SM, de Gouw J, Goldstein AH, Harley RA, Jimenez JL, Prévôt AS, Robinson AL.Gentner DR, et al.Environ Sci Technol. 2017 Feb 7;51(3):1074-1093. doi: 10.1021/acs.est.6b04509. Epub 2017 Jan 18.Environ Sci Technol. 2017.PMID:28000440Review.
- Quantitative cancer risk assessment for occupational exposures to asphalt fumes during built-up roofing asphalt (BURA) operations.Rhomberg LR, Mayfield DB, Goodman JE, Butler EL, Nascarella MA, Williams DR.Rhomberg LR, et al.Crit Rev Toxicol. 2015;45(10):873-918. doi: 10.3109/10408444.2015.1094450. Epub 2015 Oct 29.Crit Rev Toxicol. 2015.PMID:26515283Review.
Cited by
- Emissions of Carbonaceous Particulate Matter and Ultrafine Particles from Vehicles-A Scientific Review in a Cross-Cutting Context of Air Pollution and Climate Change.Bessagnet B, Allemand N, Putaud JP, Couvidat F, André JM, Simpson D, Pisoni E, Murphy BN, Thunis P.Bessagnet B, et al.Appl Sci (Basel). 2022 Apr 2;12(7):1-52. doi: 10.3390/app12073623.Appl Sci (Basel). 2022.PMID:35529678Free PMC article.
- Roadside habitat: Boon or bane for pollinating insects?Meinzen TC, Burkle LA, Debinski DM.Meinzen TC, et al.Bioscience. 2024 Jan 13;74(1):54-64. doi: 10.1093/biosci/biad111. eCollection 2024 Jan.Bioscience. 2024.PMID:38313561Free PMC article.
- Effect of blending of medium-temperature phase change material on the bitumen storage heat.Najemi L, Belyamani I, Bouya M.Najemi L, et al.Heliyon. 2023 Nov 4;9(11):e22040. doi: 10.1016/j.heliyon.2023.e22040. eCollection 2023 Nov.Heliyon. 2023.PMID:38027641Free PMC article.
- Comparison between Spatially Resolved Airborne Flux Measurements and Emission Inventories of Volatile Organic Compounds in Los Angeles.Pfannerstill EY, Arata C, Zhu Q, Schulze BC, Woods R, Harkins C, Schwantes RH, McDonald BC, Seinfeld JH, Bucholtz A, Cohen RC, Goldstein AH.Pfannerstill EY, et al.Environ Sci Technol. 2023 Oct 17;57(41):15533-15545. doi: 10.1021/acs.est.3c03162. Epub 2023 Oct 4.Environ Sci Technol. 2023.PMID:37791848Free PMC article.
- An updated modeling framework to simulate Los Angeles air quality - Part 1: Model development, evaluation, and source apportionment.Pennington EA, Wang Y, Schulze BC, Seltzer KM, Yang J, Zhao B, Jiang Z, Shi H, Venecek M, Chau D, Murphy BN, Kenseth CM, Ward RX, Pye HOT, Seinfeld JH.Pennington EA, et al.Atmos Chem Phys. 2024 Feb 23;24(4):2345-2363. doi: 10.5194/acp-24-2345-2024.Atmos Chem Phys. 2024.PMID:39440024Free PMC article.
References
- Khare P., Gentner D. R., Considering the future of anthropogenic gas-phase organic compound emissions and the increasing influence of non-combustion sources on urban air quality. Atmos. Chem. Phys. 18, 5391–5413 (2018).
- Mcdonald B. C., de Gouw J. A., Gilman J. B., Jathar S. H., Akherati A., Cappa C. D., Jimenez J. L., Lee-Taylor J., Hayes P. L., McKeen S. A., Cui Y. Y., Kim S.-W., Gentner D. R., Isaacman-VanWertz G., Goldstein A. H., Harley R. A., Frost G. J., Roberts J. M., Ryerson T. B., Trainer M., Volatile chemical products emerging as largest petrochemical source of urban organic emissions. Science 359, 760–764 (2018). - PubMed
- Jimenez J. L., Canagaratna M. R., Donahue N. M., Prevot A. S. H., Zhang Q., Kroll J. H., De Carlo P. F., Allan J. D., Coe H., Ng N. L., Aiken A. C., Docherty K. S., Ulbrich I. M., Grieshop A. P., Robinson A. L., Duplissy J., Smith J. D., Wilson K. R., Lanz V. A., Hueglin C., Sun Y. L., Tian J., Laaksonen A., Raatikainen T., Rautiainen J., Vaattovaara P., Ehn M., Kulmala M., Tomlinson J. M., Collins D. R., Cubison M. J., Dunlea E. J., Huffman J. A., Onasch T. B., Alfarra M. R., Williams P. I., Bower K., Kondo Y., Schneider J., Drewnick F., Borrmann S., Weimer S., Demerjian K., Salcedo D., Cottrell L., Griffin R., Takami A., Miyoshi T., Hatakeyama S., Shimono A., Sun J. Y., Zhang Y. M., Dzepina K., Kimmel J. R., Sueper D., Jayne J. T., Herndon S. C., Trimborn A. M., Williams L. R., Wood E. C., Middlebrook A. M., Kolb C. E., Baltensperger U., Worsnop D. R., Evolution of organic aerosols in the atmosphere. Science 326, 1525–1529 (2009). - PubMed
- Ma P. K., Zhao Y., Robinson A. L., Worton D. R., Goldstein A. H., Ortega A. M., Jimenez J. L., Zotter P., Prévôt A. S. H., Szidat S., Hayes P. L., Evaluating the impact of new observational constraints on P-S/IVOC emissions, multi-generation oxidation, and chamber wall losses on SOA modeling for Los Angeles, CA. Atmos. Chem. Phys. 17, 9237–9259 (2017).
- Zhao Y., Hennigan C. J., May A. A., Tkacik D. S., de Gouw J. A., Gilman J. B., Kuster W. C., Borbon A., Robinson A. L., Intermediate-volatility organic compounds: A large source of secondary organic aerosol. Environ. Sci. Technol. 48, 13743–13750 (2014). - PubMed
LinkOut - more resources
Full Text Sources
