Cones Support Alignment to an Inconsistent World by Suppressing Mouse Circadian Responses to the Blue Colors Associated with Twilight
- PMID:31846668
- PMCID: PMC6926481
- DOI: 10.1016/j.cub.2019.10.028
Cones Support Alignment to an Inconsistent World by Suppressing Mouse Circadian Responses to the Blue Colors Associated with Twilight
Abstract
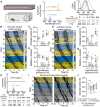
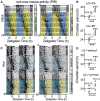
In humans, short-wavelength light evokes larger circadian responses than longer wavelengths [1-3]. This reflects the fact that melanopsin, a key contributor to circadian assessments of light intensity, most efficiently captures photons around 480 nm [4-8] and gives rise to the popular view that "blue" light exerts the strongest effects on the clock. However, in the natural world, there is often no direct correlation between perceived color (as reported by the cone-based visual system) and melanopsin excitation. Accordingly, although the mammalian clock does receive cone-based chromatic signals [9], the influence of color on circadian responses to light remains unclear. Here, we define the nature and functional significance of chromatic influences on the mouse circadian system. Using polychromatic lighting and mice with altered cone spectral sensitivity (Opn1mwR), we generate conditions that differ in color (i.e., ratio of L- to S-cone opsin activation) while providing identical melanopsin and rod activation. When biased toward S-opsin activation (appearing "blue"), these stimuli reliably produce weaker circadian behavioral responses than those favoring L-opsin ("yellow"). This influence of color (which is absent in animals lacking cone phototransduction; Cnga3-/-) aligns with natural changes in spectral composition over twilight, where decreasing solar angle is accompanied by a strong blue shift [9-11]. Accordingly, we find that naturalistic color changes support circadian alignment when environmental conditions render diurnal variations in light intensity weak/ambiguous sources of timing information. Our data thus establish how color contributes to circadian entrainment in mammals and provide important new insight to inform the design of lighting environments that benefit health.
Keywords: color opponency; daylight; metamer; non-image-forming; photoentrainment; photoreceptor; suprachiasmatic.
Copyright © 2019 The Author(s). Published by Elsevier Ltd.. All rights reserved.
Conflict of interest statement
The authors declare no competing interests.
Figures


Comment in
- No evidence for an S cone contribution to acute neuroendocrine and alerting responses to light.Spitschan M, Lazar R, Yetik E, Cajochen C.Spitschan M, et al.Curr Biol. 2019 Dec 16;29(24):R1297-R1298. doi: 10.1016/j.cub.2019.11.031.Curr Biol. 2019.PMID:31846672Free PMC article.
Similar articles
- Additive contributions of melanopsin and both cone types provide broadband sensitivity to mouse pupil control.Hayter EA, Brown TM.Hayter EA, et al.BMC Biol. 2018 Jul 31;16(1):83. doi: 10.1186/s12915-018-0552-1.BMC Biol. 2018.PMID:30064443Free PMC article.
- Residual photosensitivity in mice lacking both rod opsin and cone photoreceptor cyclic nucleotide gated channel 3 alpha subunit.Barnard AR, Appleford JM, Sekaran S, Chinthapalli K, Jenkins A, Seeliger M, Biel M, Humphries P, Douglas RH, Wenzel A, Foster RG, Hankins MW, Lucas RJ.Barnard AR, et al.Vis Neurosci. 2004 Sep-Oct;21(5):675-83. doi: 10.1017/S0952523804215024.Vis Neurosci. 2004.PMID:15683556
- A distinct contribution of short-wavelength-sensitive cones to light-evoked activity in the mouse pretectal olivary nucleus.Allen AE, Brown TM, Lucas RJ.Allen AE, et al.J Neurosci. 2011 Nov 16;31(46):16833-43. doi: 10.1523/JNEUROSCI.2505-11.2011.J Neurosci. 2011.PMID:22090509Free PMC article.
- Melanopsin--shedding light on the elusive circadian photopigment.Brown RL, Robinson PR.Brown RL, et al.Chronobiol Int. 2004 Mar;21(2):189-204. doi: 10.1081/cbi-120037816.Chronobiol Int. 2004.PMID:15332341Free PMC article.Review.
- Beyond irradiance: Visual signals influencing mammalian circadian function.Mouland JW, Brown TM.Mouland JW, et al.Prog Brain Res. 2022;273(1):145-169. doi: 10.1016/bs.pbr.2022.04.010. Epub 2022 May 31.Prog Brain Res. 2022.PMID:35940714Review.
Cited by
- PySilSub: An open-source Python toolbox for implementing the method of silent substitution in vision and nonvisual photoreception research.Martin JT, Boynton GM, Baker DH, Wade AR, Spitschan M.Martin JT, et al.J Vis. 2023 Jul 3;23(7):10. doi: 10.1167/jov.23.7.10.J Vis. 2023.PMID:37450287Free PMC article.
- Does a Red House Affect Rhythms in Mice with a Corrupted Circadian System?Öztürk M, Ingenwerth M, Sager M, von Gall C, Ali AAH.Öztürk M, et al.Int J Mol Sci. 2021 Feb 25;22(5):2288. doi: 10.3390/ijms22052288.Int J Mol Sci. 2021.PMID:33669004Free PMC article.
- Light sampling behaviour regulates circadian entrainment in mice.Steel LCE, Tam SKE, Brown LA, Foster RG, Peirson SN.Steel LCE, et al.BMC Biol. 2024 Sep 16;22(1):208. doi: 10.1186/s12915-024-01995-x.BMC Biol. 2024.PMID:39278902Free PMC article.
- Light as a Modulator of Non-Image-Forming Brain Functions-Positive and Negative Impacts of Increasing Light Availability.Campbell I, Sharifpour R, Vandewalle G.Campbell I, et al.Clocks Sleep. 2023 Mar 17;5(1):116-140. doi: 10.3390/clockssleep5010012.Clocks Sleep. 2023.PMID:36975552Free PMC article.Review.
- Bright daytime light enhances circadian amplitude in a diurnal mammal.Bano-Otalora B, Martial F, Harding C, Bechtold DA, Allen AE, Brown TM, Belle MDC, Lucas RJ.Bano-Otalora B, et al.Proc Natl Acad Sci U S A. 2021 Jun 1;118(22):e2100094118. doi: 10.1073/pnas.2100094118.Proc Natl Acad Sci U S A. 2021.PMID:34031246Free PMC article.
References
- Wright H.R., Lack L.C. Effect of light wavelength on suppression and phase delay of the melatonin rhythm. Chronobiol. Int. 2001;18:801–808. - PubMed
- Wright H.R., Lack L.C., Kennaway D.J. Differential effects of light wavelength in phase advancing the melatonin rhythm. J. Pineal Res. 2004;36:140–144. - PubMed
- Provencio I., Foster R.G. Circadian rhythms in mice can be regulated by photoreceptors with cone-like characteristics. Brain Res. 1995;694:183–190. - PubMed
Publication types
MeSH terms
Substances
Related information
Grants and funding
LinkOut - more resources
Full Text Sources
Molecular Biology Databases
