Movatterモバイル変換


[0]ホーム

URL:


Skip to main page content
U.S. flag

An official website of the United States government

Dot gov

The .gov means it’s official.
Federal government websites often end in .gov or .mil. Before sharing sensitive information, make sure you’re on a federal government site.

Https

The site is secure.
Thehttps:// ensures that you are connecting to the official website and that any information you provide is encrypted and transmitted securely.

NIH NLM Logo
Log inShow account info
Access keysNCBI HomepageMyNCBI HomepageMain ContentMain Navigation
pubmed logo
Advanced Clipboard
User Guide

Full text links

Nature Publishing Group full text link Nature Publishing Group Free PMC article
Full text links

Actions

Share

.2019 Jul 29;9(1):10919.
doi: 10.1038/s41598-019-47227-z.

Alpha-synuclein is a DNA binding protein that modulates DNA repair with implications for Lewy body disorders

Affiliations

Alpha-synuclein is a DNA binding protein that modulates DNA repair with implications for Lewy body disorders

Allison J Schaser et al. Sci Rep..

Abstract

Alpha-synuclein is a presynaptic protein that forms abnormal cytoplasmic aggregates in Lewy body disorders. Although nuclear alpha-synuclein localization has been described, its function in the nucleus is not well understood. We demonstrate that alpha-synuclein modulates DNA repair. First, alpha-synuclein colocalizes with DNA damage response components within discrete foci in human cells and mouse brain. Removal of alpha-synuclein in human cells leads to increased DNA double-strand break (DSB) levels after bleomycin treatment and a reduced ability to repair these DSBs. Similarly, alpha-synuclein knock-out mice show increased neuronal DSBs that can be rescued by transgenic reintroduction of human alpha-synuclein. Alpha-synuclein binds double-stranded DNA and helps to facilitate the non-homologous end-joining reaction. Using a new, in vivo imaging approach that we developed, we find that serine-129-phosphorylated alpha-synuclein is rapidly recruited to DNA damage sites in living mouse cortex. We find that Lewy inclusion-containing neurons in both mouse model and human-derived patient tissue demonstrate increased DSB levels. Based on these data, we propose a model whereby cytoplasmic aggregation of alpha-synuclein reduces its nuclear levels, increases DSBs, and may contribute to programmed cell death via nuclear loss-of-function. This model could inform development of new treatments for Lewy body disorders by targeting alpha-synuclein-mediated DNA repair mechanisms.


Conflict of interest statement

The authors declare no competing interests.

Figures

Figure 1
Figure 1
Alpha-synuclein forms discrete nuclear foci that colocalize with known DDR components. (A) Top: A representative image shows that endogenous alpha-synuclein (αSyn) forms discrete foci in HAP1 cell nuclei that are localized within the nucleus. Scale bar 20 μm, inset 10 μm. Middle & Bottom: No such similar staining is seen with a secondary antibody-only control or in SNCA knock-out (αSyn KO) cells. (B) Top: A representative image shows that intranuclear αSyn foci colocalize with DDR components, including the DNA repair factors γH2AX and PAR. Inset shows region shown at higher magnification below. Scale bar 5 μm. Bottom: Quantification of colocalization between αSyn, γH2AX and PAR compared to what would be expected with the same foci density at random (αSyn-γH2AX = 0.136 ± 0.005, random translation = 0.023 ± 0.002, N = 322 nuclei, paired t-test p < 0.0001; αSyn-PAR = 0.165 ± 0.008, random translation = 0.022 ± 0.001, N = 325 nuclei, paired t-test p < 0.0001; γH2AX-PAR = 0.141 ± 0.006, random translation = 0.024 ± 0.001, N = 325 nuclei, paired t-test p < 0.0001). (C) Endogenous mouse αSyn staining in WT animals is specific and can be found as discrete foci within the nucleus of cortical neurons. Top: Images demonstrate a single plane from a three dimensional z-stack showing αSyn foci. Middle: Projection of three dimensional z-stack in 3 different planes shows that αSyn foci are within the nucleus. Bottom: αSyn staining is absent in SNCA KO mouse tissue, since it is completely abolished in all (>200) αSyn KO mouse cortical neurons analyzed, as shown in this representative image. Scale bar 4 μm. (D) Top: A representative image shows that endogenous mouse αSyn forms discrete intranuclear foci in mouse cortical neurons that colocalize with DDR components, including the DNA repair factors γH2AX and PAR. Inset shows region shown at higher magnification below. Scale bar 5 μm. Bottom: Quantification of colocalization between αSyn, γH2AX and PAR compared to what would be expected with the same foci density at random (αSyn-γH2AX = 0.121 ± 014, random translation = 0.011 ± 0.002, paired t-test p < 0.0001; αSyn-PAR = 0.076 ± 0.002, random translation = 0.019 ×  ± 0.002, paired t-test p < 0.0001; γH2AX-PAR = 0.121 ± 0.014, random translation = 0.011 ± 0.002, paired t-test p < 0.0001; N = 79 nuclei, 4 animals).
Figure 2
Figure 2
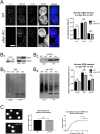
Alpha-synuclein knock-out does not alter DSB levels at baseline in HAP1 cells. (A) SNCA knock-out (αSyn KO) does not alter baseline levels of nuclear γH2AX or PAR foci (foci density per 100 μm2): WT αSyn = 1.23 ± 0.10, αSyn KO αSyn = 0.06 ± 0.02, unpaired t-test p < 0.0001; WT γH2AX = 1.96 ± 0.14, αSyn KO αSyn = 2.03 ± 0.15, unpaired t-test p = 0.7422; WT PAR = 0.67 ± 0.07, αSyn KO PAR = 0.60 ± 0.09, unpaired t-test p = 0.5452; WT N = 326 nuclei, αSyn KO N = 252 nuclei). Scale bar 5 μm. (B) Left: (B1) Western blotting shows expected absence of αSyn protein in αSyn KO cells. Subcellular fractionation was used to purify nuclear and cytoplasmic proteins, as demonstrated by relative enrichment of the nuclear protein PARP1 in the nuclear fraction and the cytosolic protein HSP90 in the cytoplasmic fraction. Using this approach, blotting for nuclear γH2AX (B2), PAR (B3) and pan-(mono- & poly-) ADP-ribose (B4) showed no significant difference between WT and αSyn KO cells at baseline, when normalized to total protein levels (using REVERT stain, not shown). Right: Group data: WT γH2AX = 0.25 ± 0.01, αSyn KO γH2AX = 0.26 ± 0.02, unpaired t-test p = 0.9682; WT PAR = 0.52 ± 0.05, αSyn KO PAR = 0.45 ± 0.08, unpaired t-test p = 0.4883; WT pan-AR = 0.29 ± 0.04, αSyn KO pan-AR = 0.34 ± 0.07, unpaired t-test p = 0.6365; WT N = 3, αSyn KO N = 3 biological replicates). (C) Neutral comet assay shows no difference in levels of DSBs between WT and αSyn KO cells at baseline. Left: Comet images, middle: group data (normalized % DNA in tail: WT = 1.00 ± 0.01, αSyn KO = 1.00 ± 0.01, unpaired t-test p = 0.8860; WT N = 3016, αSyn KO N = 4171), right: cumulative probability histogram showing superimposable distributions.
Figure 3
Figure 3
Alpha-synuclein knock-out in HAP1 cells compromises DSB repair after bleomycin treatment. (A) Neutral comet assay after treatment with bleomycin (10μg/mL for 60 min) shows greater levels of DSBs in SNCA KO (αSyn KO) cells compared to WT. Left: Comet images, middle: group data (normalized % DNA in tail: WT vehicle = 1.00 ± 0.01 N = 4561 nuclei, WT bleo = 1.15 ± 0.01 N = 2269 nuclei, αSyn KO vehicle = 0.98 ± 0.01 N = 5182 nuclei, αSyn KO bleo = 1.41 ± 0.01 N = 2734 nuclei; F(3, 14742) = 394.83, p < 0.0001, ANOVA, post-hoc Tukey test: WT vehicle vs. WT bleo p < 0.0001, WT vehicle vs. αSyn KO vehicle p = 0.3487, WT vehicle vs. αSyn KO bleo p < 0.0001, WT bleo vs. αSyn KO vehicle p < 0.0001, WT bleo vs. αSyn KO bleo p < 0.0001, αSyn KO vehicle vs. αSyn KO bleo p < 0.0001, several significance lines have been left off the figure to improve clarity). Red outline on bars represents bleomycin treated conditions. Right: cumulative probability histogram showing differences in the distributions. (B) Bleomycin treatment (10μg/mL for 60 min) induces greater DSB levels in αSyn KO cells compared to WT, as measured by normalized nuclear γH2AX levels (normalized foci density): WT vehicle = 1.00 ± 0.08 N = 215 nuclei, WT bleo = 1.83 ± 0.25 N = 117 nuclei, αSyn KO vehicle = 1.51 ± 0.16 N = 159 nuclei, αSyn KO bleo = 2.73 ± 0.32 N = 117 nuclei; F(3, 604) = 14.564, p < 0.0001, ANOVA, post-hoc Tukey test: WT vehicle vs. WT bleo p = 0.0103, WT vehicle vs. αSyn KO vehicle p = 0.1570, WT vehicle vs. αSyn KO bleo p < 0.0001, WT bleo vs. αSyn KO vehicle p = 0.6621, WT bleo vs. αSyn KO bleo p = 0.0159, αSyn KO vehicle vs. αSyn KO bleo p < 0.0001. Several significance lines have been left off the figure to improve clarity. Scale bar 5 μm. Red outline on bars represents bleomycin treated conditions. (C) Nuclear fractionation and western blotting after treatment with bleomycin demonstrates greater nuclear γH2AX levels in αSyn KO cells compared to WT (γH2AX levels normalized to total protein levels using REVERT stain, not shown, A.U.): WT vehicle γH2AX = 0.0074 ± 0.014, WT bleo = 0.0274 ± 0.024, αSyn KO vehicle = 0.0168 ± 0.101, αSyn KO bleo = 0.0737 ± 0.036; N = 3 biological replicates, F(3, 20) = 125.52, p < 0.0001, ANOVA, post-hoc Tukey test: WT vehicle vs. WT bleo p = 0.0002, WT vehicle vs. αSyn KO vehicle p = 0.0867, WT vehicle vs. αSyn KO bleo p < 0.0001, WT bleo vs. αSyn KO vehicle p = 0.0447, WT bleo vs. αSyn KO bleo p < 0.0001, αSyn KO vehicle vs. αSyn KO bleo p < 0.0001. Several significance lines have been left off the figure to improve clarity. Red outline on bars represents bleomycin treated conditions. (D) Neutral comet assay analysis of recovery after removal of bleomycin shows delayed DSB repair in αSyn KO cells compared to WT (mean % DNA in tail 15 min after bleo removal: WT = 1.079 ± 0.026 N = 3 biological replicates, αSyn KO = 1.285 ± 0.027 N = 3 biological replicates; unpaired t-test p = 0.0052).
Figure 4
Figure 4
Alpha-synuclein knock-out in mice increases cortical neuron DSBs, which can be rescued by transgenic expression of human alpha-synuclein. (A) Neutral comet assay shows increased levels of DSBs in SNCA KO (αSyn KO) mice compared to WT control mice, at 1, 3 and 6–9 months of age (normalized % DNA in tail 1 month-old: αSyn KO = 1.09 ± 0.014, WT = 1.00 ± 0.011, 3 month-old: αSyn KO = 1.15 ± 0.011, WT = 1.00 ± 0.020; 6–9 month-old αSyn KO = 1.36 ± 0.02, WT = 1.00 ± 0.019; tail moment 1 month-old: αSyn KO = 1.40 ± 0.059, WT = 1.00 ± 0.034, 3 month-old: αSyn KO = 1.15 ± 0.022, WT = 1.00 ± 0.035; 6–9 month-old αSyn KO = 1.97 ± 0.048, WT = 1.00 ± 0.038; olive moment 1 month-old: αSyn KO = 1.28 ± 0.041, WT = 1.00 ± 0.024, 3 month-old: αSyn KO = 1.09 ± 0.014, WT = 1.00 ± 0.026; 6–9 month-old αSyn KO = 1.57 ± 0.028, WT = 1.00 ± 0.024; unpaired t-tests for all comparisons p < 0.0001 except for olive moment 3 month p = 0.0012; 1 month-old: WT N = 601 comets/3 animals, αSyn KO = 354 comets/3 animals; 3 month-old: WT N = 183 comets/3 animals, αSyn KO = 291 comets/3 animals; 6–9 month-old: WT N = 683 comets/3 animals, αSyn KO = 822 comets/3 animals). (B) IHC for γH2AX (top) and PAR (middle) shows decreased levels of these DDR markers in cells expressing 142E Syn-GFP transgene (yellow arrowhead) on mouse alpha-synuclein (mSyn) KO background compared to cells not expressing 142E Syn-GFP (white arrowhead). Scale bar 2.5 μm. Bottom: Group data (γH2AX foci density mSyn KO = 0.0581 ± 0.0049 AU, N = 16 cells/4 animals; 142E Syn-GFP/mSyn KO = 0.0322 ± 0.0040 AU, N = 77 cells/4 animals, unpaired t-test p = 0.0052; PAR foci density mSyn KO = 0.0622 ± 0.0073 AU, N = 98 cells/4 animals; 142E Syn-GFP/mSyn KO = 0.0288 ± 0.0070 AU, N = 65 cells/4 animals, unpaired t-test p = 0.0021).
Figure 5
Figure 5
Alpha-synuclein binds double-stranded DNA and facilitates the DNA non-homologous end-joining reaction. (A) Left: EMSA of shifted 300 bp dsDNA run on a 6% polyacrylamide gel with increasing alpha-synuclein (αSyn) shows at least 6 different bound states (white arrowheads). Right: Integrated density of each band plotted versus distance on the gel shows progressive reduction of the unshifted peak (black arrowhead) and simultaneous increase in the multiple shifted peaks (white arrowheads) with increasing αSyn concentration. (B) Left: Similar EMSA with S129-phospho-synuclein (pSyn) shows only 2 different bound states (white arrowheads). Right: Integrated density of each band plotted versus gel distance shows similar, but fewer, shifted peaks (white arrowheads) with increasing pSyn concentration, also associated with a reduction of the unshifted peak (black arrowhead). (C) Left: DNA T4 ligase-mediated non-homologous end-joining assay shows formation of ligation products, including dimer band (red arrowhead) and circularized monomer (white arrowhead), with two concentrations of pSyn compared to GFP (negative control) and histone H1 (positive control). Right: Group data shows a significant difference between control and pSyn and αSyn for both the dimerization and circularized monomer products (dimerization ratio versus T4 ligase-only condition: 0.7 μm protein GFP = 0.76 ± 0.11, N = 6; pSyn = 2.33 ± 0.23, N = 10, αSyn = 3.04 ± 0.37, N = 6, F(2, 19) = 16.77, p < 0.0001, ANOVA, post-hoc Tukey test: GFP vs. pSyn p = 0.0011, GFP vs. αSyn p < 0.0001, pSyn vs. αSyn p = 0.1450; 3.6 μm protein GFP = 1.21 ± 0.19, N = 4; pSyn = 3.40 ± 0.53, N = 7, t-test p = 0.0154; circularization ratio versus T4 ligase-only condition: 0.7 μm protein GFP = 1.23 ± 0.20, N = 6; pSyn = 2.91 ± 0.30, N = 10, αSyn = 3.05 ± 0.28, N = 6, F(2, 19) = 10.77, p = 0.0007, ANOVA, post-hoc Tukey test: GFP vs. pSyn p = 0.0015, GFP vs. αSyn p = 0020, pSyn vs. αSyn p = 0.9349; 3.6 μm protein GFP = 1.21 ± 0.19, N = 4; pSyn = 3.40 ± 0.53, N = 7, t-test p = 0.0007).
Figure 6
Figure 6
Nuclear alpha-synuclein is rapidly recruited to sites of laser-induced DNA damagein vivo. (A) Cortical neuron cell body imagedin vivo in a mouse expressing 142E Syn-GFP (heterozygous) and nuclear localized TdTomato-NLS (heterozygous). White circle in merge image shows targeting of laser-induced damage (LID) pulse and white square is the control region. Dotted line represents the outline of the nucleus. Scale bar 5 μm. (B) Baseline (t = −1min) and after LID (t = 1 min) images show accumulation of Syn-GFP at DNA damage site (white arrow). (C) Data from B) shows increased (at LID site) and decreased (at adjacent site, square in A) Syn-GFP level, calculated enrichment ratio at LID site, and group data from different transgenic (142E Syn-GFP & A53T Syn-GFP) and AAV8-mediated expression (A53T/S129D Syn-GFP & A53T/S129A Syn-GFP) animals (142E Syn-GFP Enrichment Ratio = 1.26 ± 0.03, N = 34 cells/6 animals, A53T Syn-GFP Enrichment Ratio = 0.95 ± 0.02, N = 19 cells/3 animals, A53T/S129D Syn-GFP Enrichment Ratio = 1.37 ± 0.13, N = 17 cells/5 animals, A53T/S129A Syn-GFP Enrichment Ratio = 1.00 ± 0.04, N = 13 cells/4 animals; F(3, 78) = 9.086, p = 0.0001, ANOVA, post-hoc Tukey tests: A53T/S129D vs. A53T p = 0.0002, A53T/S129D vs. A53T/S129A p = 0.0051, 142E vs. A53T p = 0.0016, 142E vs. A53T/S129A p = 0.0343, A53T/S129D vs. 142E p = 0.6078, A53T vs. A53T/S129A p = 0.9726). (D) White square shows area magnified to the right. FRAP shows rapid mobility of Syn-GFP within LID site (white arrow, τrecovery = 33.1 ms, 95% CI = 23.8–54.4 ms, N = 12 cells/3 animals). Red arrowheads in all sections show time of LID or FRAP laser pulse.
Figure 7
Figure 7
Lewy pathology is associated with increased DSBs in mouse & human cortex. (A) Formation of PFF-seeded 142E Syn-GFP-positive or untagged endogenous mouse synuclein (mSyn) Lewy inclusion-bearing neuron in cortical fixed tissue is associated with increased DSB levels compared to adjacent cells with no inclusion. Scale bar 10 µm. (B) Group data showing combined (142E Syn-GFP and mouse-only) Lewy pathology-associated DSB levels compared to adjacent cells without Lewy pathology (nuclear γH2AX levels: Lewy inclusion-containing cells = 16.0 ± 4.2 foci/nucleus, N = 23 nuclei/4 animals, cells without pathology = 5.9 ± 0.8 foci/nucleus, N = 23 nuclei/4 animals, unpaired t-test p = 0.0235). (C) Human DLB amygdala staining for regions with high (top) and low (bottom) levels of Lewy pathology burden show increased nuclear γH2AX staining in regions with high burden. Scale bar 10 μm. (D) Group data showing positive correlation between Lewy pathology burden and DSB levels as measured by nuclear γH2AX staining (normalized to DAPI volume, R2 = 0.40, p = 0.0001, N = 40 regions/6 cases).
See this image and copyright information in PMC

Similar articles

See all similar articles

Cited by

See all "Cited by" articles

References

    1. Sudhof T. C., Rizo J. Synaptic Vesicle Exocytosis. Cold Spring Harbor Perspectives in Biology. 2011;3(12):a005637–a005637. doi: 10.1101/cshperspect.a005637. - DOI - PMC - PubMed
    1. Bendor JT, Logan TP, Edwards RH. The function of alpha-synuclein. Neuron. 2013;79:1044–1066. doi: 10.1016/j.neuron.2013.09.004. - DOI - PMC - PubMed
    1. Maroteaux L, Campanelli JT, Scheller RH. Synuclein: a neuron-specific protein localized to the nucleus and presynaptic nerve terminal. J Neurosci. 1988;8:2804–2815. doi: 10.1523/JNEUROSCI.08-08-02804.1988. - DOI - PMC - PubMed
    1. Surguchov A. Intracellular Dynamics of Synucleins: “Here, There and Everywhere”. Int Rev Cell Mol Biol. 2015;320:103–169. doi: 10.1016/bs.ircmb.2015.07.007. - DOI - PubMed
    1. Goers J, et al. Nuclear localization of alpha-synuclein and its interaction with histones. Biochemistry. 2003;42:8465–8471. doi: 10.1021/bi0341152. - DOI - PubMed

Publication types

MeSH terms

Substances

Related information

Grants and funding

LinkOut - more resources

Full text links
Nature Publishing Group full text link Nature Publishing Group Free PMC article
Cite
Send To

NCBI Literature Resources

MeSHPMCBookshelfDisclaimer

The PubMed wordmark and PubMed logo are registered trademarks of the U.S. Department of Health and Human Services (HHS). Unauthorized use of these marks is strictly prohibited.


[8]ページ先頭

©2009-2025 Movatter.jp