Characteristic disruptions of an excitable carbon cycle
- PMID:31285325
- PMCID: PMC6660735
- DOI: 10.1073/pnas.1905164116
Characteristic disruptions of an excitable carbon cycle
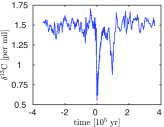
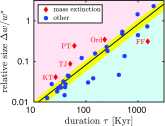
Abstract
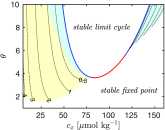
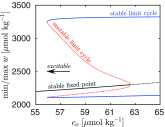
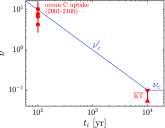
The history of the carbon cycle is punctuated by enigmatic transient changes in the ocean's store of carbon. Mass extinction is always accompanied by such a disruption, but most disruptions are relatively benign. The less calamitous group exhibits a characteristic rate of change whereas greater surges accompany mass extinctions. To better understand these observations, I formulate and analyze a mathematical model that suggests that disruptions are initiated by perturbation of a permanently stable steady state beyond a threshold. The ensuing excitation exhibits the characteristic surge of real disruptions. In this view, the magnitude and timescale of the disruption are properties of the carbon cycle itself rather than its perturbation. Surges associated with mass extinction, however, require additional inputs from external sources such as massive volcanism. Surges are excited when [Formula: see text] enters the oceans at a flux that exceeds a threshold. The threshold depends on the duration of the injection. For injections lasting a time [Formula: see text] y in the modern carbon cycle, the threshold flux is constant; for smaller [Formula: see text], the threshold scales like [Formula: see text] Consequently the unusually strong but geologically brief duration of modern anthropogenic oceanic [Formula: see text] uptake is roughly equivalent, in terms of its potential to excite a major disruption, to relatively weak but longer-lived perturbations associated with massive volcanism in the geologic past.
Keywords: carbon cycle; carbon isotopic events; dynamical systems; excitable systems; mass extinctions.
Conflict of interest statement
The author declares no conflict of interest.
Figures



Similar articles
- The Balance of Nature: A Global Marine Perspective.Arnscheidt CW, Rothman DH.Arnscheidt CW, et al.Ann Rev Mar Sci. 2022 Jan 3;14:49-73. doi: 10.1146/annurev-marine-010318-095212. Epub 2021 Jun 11.Ann Rev Mar Sci. 2022.PMID:34115541Review.
- Tipping points induced by parameter drift in an excitable ocean model.Pierini S, Ghil M.Pierini S, et al.Sci Rep. 2021 May 27;11(1):11126. doi: 10.1038/s41598-021-90138-1.Sci Rep. 2021.PMID:34045519Free PMC article.
- Decadal trends in the ocean carbon sink.DeVries T, Le Quéré C, Andrews O, Berthet S, Hauck J, Ilyina T, Landschützer P, Lenton A, Lima ID, Nowicki M, Schwinger J, Séférian R.DeVries T, et al.Proc Natl Acad Sci U S A. 2019 Jun 11;116(24):11646-11651. doi: 10.1073/pnas.1900371116. Epub 2019 May 28.Proc Natl Acad Sci U S A. 2019.PMID:31138699Free PMC article.
- Blood lactate accumulation decreases during the slow component of oxygen uptake without a decrease in muscular efficiency.O'Connell JM, Weir JM, MacIntosh BR.O'Connell JM, et al.Pflugers Arch. 2017 Oct;469(10):1257-1265. doi: 10.1007/s00424-017-1986-y. Epub 2017 May 26.Pflugers Arch. 2017.PMID:28550471
- The gut epithelium from feeding to fasting in the predatory soil mite Pergamasus longicornis (Mesostigmata: Parasitidae): one tissue, two roles.Bowman CE.Bowman CE.Exp Appl Acarol. 2019 Mar;77(3):253-357. doi: 10.1007/s10493-019-00356-6. Epub 2019 Mar 20.Exp Appl Acarol. 2019.PMID:30895556Review.
Cited by
- Volcanic CO2 degassing postdates thermogenic carbon emission during the end-Permian mass extinction.Wu Y, Cui Y, Chu D, Song H, Tong J, Dal Corso J, Ridgwell A.Wu Y, et al.Sci Adv. 2023 Feb 15;9(7):eabq4082. doi: 10.1126/sciadv.abq4082. Epub 2023 Feb 15.Sci Adv. 2023.PMID:36791190Free PMC article.
- Climate Endgame: Exploring catastrophic climate change scenarios.Kemp L, Xu C, Depledge J, Ebi KL, Gibbins G, Kohler TA, Rockström J, Scheffer M, Schellnhuber HJ, Steffen W, Lenton TM.Kemp L, et al.Proc Natl Acad Sci U S A. 2022 Aug 23;119(34):e2108146119. doi: 10.1073/pnas.2108146119. Epub 2022 Aug 1.Proc Natl Acad Sci U S A. 2022.PMID:35914185Free PMC article.
- Routes to global glaciation.Arnscheidt CW, Rothman DH.Arnscheidt CW, et al.Proc Math Phys Eng Sci. 2020 Jul;476(2239):20200303. doi: 10.1098/rspa.2020.0303. Epub 2020 Jul 29.Proc Math Phys Eng Sci. 2020.PMID:32831615Free PMC article.
- Rate-induced collapse in evolutionary systems.Arnscheidt CW, Rothman DH.Arnscheidt CW, et al.J R Soc Interface. 2022 Jun;19(191):20220182. doi: 10.1098/rsif.2022.0182. Epub 2022 Jun 1.J R Soc Interface. 2022.PMID:35642430Free PMC article.
- Massive and rapid predominantly volcanic CO2 emission during the end-Permian mass extinction.Cui Y, Li M, van Soelen EE, Peterse F, Kürschner WM.Cui Y, et al.Proc Natl Acad Sci U S A. 2021 Sep 14;118(37):e2014701118. doi: 10.1073/pnas.2014701118.Proc Natl Acad Sci U S A. 2021.PMID:34493684Free PMC article.
References
- Berner R. A., The Phanerozoic Carbon Cycle: CO2 and O2. (Oxford University Press, New York, 2004).
- Sarmiento J. L., Gruber N., Ocean Biogeochemical Dynamics (Princeton University Press, Princeton, NJ, 2006).
- Emerson S. R., Hedges J. I., Chemical Oceanography and the Marine Carbon Cycle (Cambridge University Press, New York, NY, 2008).
- Rothman D. H., Earth’s carbon cycle: A mathematical perspective. Bull. Am. Math. Soc. 52, 47–64 (2015).
- Walliser O. H., Ed., Global Events and Event Stratigraphy in the Phanerozoic (Springer, Berlin, Germany, 1996).
Publication types
LinkOut - more resources
Full Text Sources
Miscellaneous
