Movatterモバイル変換


[0]ホーム

URL:


Skip to main page content
U.S. flag

An official website of the United States government

Dot gov

The .gov means it’s official.
Federal government websites often end in .gov or .mil. Before sharing sensitive information, make sure you’re on a federal government site.

Https

The site is secure.
Thehttps:// ensures that you are connecting to the official website and that any information you provide is encrypted and transmitted securely.

NIH NLM Logo
Log inShow account info
Access keysNCBI HomepageMyNCBI HomepageMain ContentMain Navigation
pubmed logo
Advanced Clipboard
User Guide

Full text links

Public Library of Science full text link Public Library of Science Free PMC article
Full text links

Actions

Share

.2019 Jan 31;17(1):e2006994.
doi: 10.1371/journal.pbio.2006994. eCollection 2019 Jan.

Coordinated electrical activity in the olfactory bulb gates the oscillatory entrainment of entorhinal networks in neonatal mice

Affiliations

Coordinated electrical activity in the olfactory bulb gates the oscillatory entrainment of entorhinal networks in neonatal mice

Sabine Gretenkord et al. PLoS Biol..

Abstract

Although the developmental principles of sensory and cognitive processing have been extensively investigated, their synergy has been largely neglected. During early life, most sensory systems are still largely immature. As a notable exception, the olfactory system is functional at birth, controlling mother-offspring interactions and neonatal survival. Here, we elucidate the structural and functional principles underlying the communication between olfactory bulb (OB) and lateral entorhinal cortex (LEC)-the gatekeeper of limbic circuitry-during neonatal development. Combining optogenetics, pharmacology, and electrophysiology in vivo with axonal tracing, we show that mitral cell-dependent discontinuous theta bursts in OB drive network oscillations and time the firing in LEC of anesthetized mice via axonal projections confined to upper cortical layers. Acute pharmacological silencing of OB activity diminishes entorhinal oscillations, whereas odor exposure boosts OB-entorhinal coupling at fast frequencies. Chronic impairment of olfactory sensory neurons disrupts OB-entorhinal activity. Thus, OB activity shapes the maturation of entorhinal circuits.


Conflict of interest statement

The authors have declared that no competing interests exist.

Figures
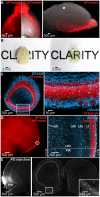
Fig 1
Fig 1. Bottom-up connectivity between OB and LEC in neonatal mice.
(A) Long-range projections of tdTomato fluorescently labeled OB MTCs (left) when superimposed on a bright-field image showing the ventral (middle) and lateral (right) view of the whole brain of a P10 Tbet-cre;tdTomato mouse. (B) Unprocessed (left) and cleared (right) brain of a P10 mouse. (C) Cleared 500 μm–thick coronal section containing the OB of a Tbet-cre;tdTomato mouse showing MTCs (red) when counterstained with the nuclear marker DRAQ5 (blue). Inset, tdTomato-stained MTCs displayed at larger magnification. (D) MTC axons targeting LEC in a cleared 1 mm–thick coronal brain slice. Inset, axons of tdTomato-expressing MTCs when counterstained with DRAQ5 (blue) and displayed at larger magnification. (E) Photographs of a 100 μm–thick coronal section from a P8 mouse depicting retrogradely labeled neurons in the OB (right) after injection of FG into the LEC (left) at P3. Inset, FG-labeled MTCs displayed at larger magnification. FG, Fluorogold; LEC, lateral entorhinal cortex; MTC, mitral and tufted cell; OB, olfactory bulb; P, postnatal day; PIR, piriform cortex.
Fig 2
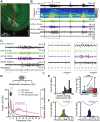
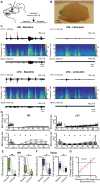
Fig 2. Continuous and discontinuous patterns of oscillatory activity in the neonatal OB.
(A) Digital photomontage reconstructing the track of the DiI-labeled multisite recording electrode (red) in a Nissl-stained (green) 100 μm–thick coronal section including the OB from a P9 mouse. The dots (gray) show the position of the 16 recording sites of the silicon probe and the recording channels (white) in the MCL and EPL that were used for spike and LFP analysis, respectively. (B) LFP recording of the oscillatory activity in the OB of a P10 mouse displayed band-pass filtered in different frequency bands and accompanied by the wavelet spectrogram (white line represents time-averaged power of the trace; white arrows point toward peak frequency values) as well as simultaneously recorded MUA (high-pass filter >400 Hz) and respiration. (C) Characteristic slow continuous oscillatory activity and theta bursts from the trace shown in B when displayed at higher magnification. Insets, continuous oscillatory activity in relationship with respiration (left, blue) and a discontinuous theta burst (right, red). (D) Power spectra (mean ± SEM) of LFP in OB during nonburst activity (blue) and discontinuous bursts (red) as well as of theta bursts normalized to nonbursting activity (purple). The respiration frequency was depicted as a horizontal bar and expanded at larger scale (top). (E) Temporal relationship between neuronal firing and network oscillations in OB. Left, histogram showing the percentage of spikes occurring during theta burst for all clustered units. Right, box plot depicting the firing rates of OB units during nonburst periods and theta burst periods. Gray dots and lines correspond to individual cells (Wilcoxon signed-rank test, ***p < 0.001). (F) Histograms depicting the phase locking of OB cells to RR (left) and theta activity (right). Only significantly locked cells were used for analysis. Data are available in S1 Data. EPL, external plexiform layer; LFP, local field potential; MCL, mitral cell layer; MTC, mitral and tufted cell; MUA, multiunit activity; OB, olfactory bulb; P, postnatal day; RR, respiration-related rhythm.
Fig 3
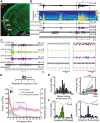
Fig 3. Effects of optogenetic silencing of MTCs on the patterns of oscillatory activity in the neonatal OB.
(A) Photograph of the brain of a P8 cre+ Tbet-cre;ArchT-EGFP mouse (left) showing EGFP-fluorescent MTCs cell bodies and their projections. (B) Left, photograph of a 100 μm–thick coronal section including the OB from a P8 cre+ Tbet-cre;ArchT-EGFP mouse. The position of recording sites in MCL and EPL layers is marked by white squares. The light guide ending just above the recording sites is shown in gray. The iso-contour lines of light spreading calculated using Monte Carlo simulation are shown in yellow. Right, propagation of light intensity in the brain as predicted by Monte Carlo simulation. Yellow lines correspond to the iso-contour lines for light power of 1 and 10 mW/mm2, respectively. (C) Neuronal firing (SUA) and LFP band-pass filtered for different frequency bands (broad 1–100 Hz, RR 2–4 Hz, theta 4–12 Hz) in response to light (yellow, 594 nm) stimulation of MTCs in a P8 cre+ Tbet-cre;ArchT-EGFP mouse. Traces are accompanied by the color-coded wavelet spectrogram of LFP shown at an identical timescale. (D) Raster plots and peristimulus time histograms displaying the firing of MTCs in response to light stimulation. The color-coded bar (bottom) displays the fraction of cells that responded with a firing decrease during stimulus (red), constant firing during stimulus but a firing increase post stimulus (blue), and unchanged firing rate (white). (E) Box plots displaying the absolute power before and during light stimulation in cre+ pups (left) and the relative change of RR activity in neonatal OB of cre+ and cre mice (right). Gray dots and lines correspond to individual animals. (F) Same as E for discontinuous theta bursts (**p < 0.01, left: signed-rank test, right: rank-sum test). Data are available in S1 Data. EGFP, enhanced green fluorescent protein; EPL, external plexiform layer; LFP, local field potential; MCL, mitral cell layer; MTC, mitral and tufted cell; OB, olfactory bulb; P, postnatal day; RR, respiration-related rhythm; SUA, single-unit activity.
Fig 4
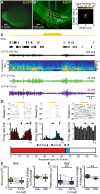
Fig 4. Continuous and discontinuous patterns of oscillatory activity in the neonatal LEC.
(A) Digital photomontage reconstructing the track of the DiI-labeled multisite recording electrode (red) in a Nissl-stained (green) 100 μm–thick coronal section including LEC from a P9 mouse. The gray dots show the position of the 16 recording sites. (B) LFP recording of the oscillatory activity in LEC of a P10 mouse displayed band-pass filtered in different frequency bands and accompanied by the wavelet spectrogram (white line represents time-averaged power of the trace) as well as simultaneously recorded MUA (high-pass filter > 400 Hz) and respiration. (C) Characteristic slow continuous oscillatory activity and theta bursts from the trace shown in B when displayed at higher magnification. (D) Power spectra (mean ± SEM) of LFP in LEC during nonburst activity (blue) and discontinuous bursts (red) as well as of theta bursts normalized to nonbursting activity (purple). The respiration frequency was depicted as a horizontal bar and expanded at a larger scale (top). (E) Temporal relationship between neuronal firing and network oscillations in LEC. Left, histogram showing the percentage of spikes occurring during theta burst for all clustered units. Right, box plot depicting the firing rates of LEC units during nonburst periods and theta burst periods. Gray dots and lines correspond to individual cells (Wilcoxon signed-rank test, ***p < 0.001). (F) Histograms depicting the phase locking of LEC neurons to RR (left) and theta activity (right). Only significantly locked cells were used for analysis. Data are available in S1 Data. af, amygdaloid fissure; LEC, lateral entorhinal cortex; LFP, local field potential; MUA, multiunit activity; P, postnatal day; PIR, piriform cortex; PRh, perirhinal cortex; rf, rhinal fissure; RR, respiration-related rhythm.
Fig 5
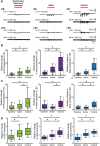
Fig 5. Frequency-dependent functional coupling between neonatal OB and LEC.
(A) Characteristic traces of band-pass-filtered LFP recorded simultaneously in OB (top) and LEC (bottom) of a P9 mouse, displayed together with wavelet spectrograms showing the frequency (“Freq.”) content. Note the temporal correlation between discontinuous theta bursts in both areas. (B) Box plots displaying RR power (top, green) and theta burst power (bottom, purple) in OB and LEC. Gray lines and dots correspond to individual pups. (*p < 0.05, Wilcoxon signed-rank test). (C) Plot of imaginary part of coherence between OB and LEC showing prominent peaks in RR and theta band. The gray line corresponds to the significance threshold as assessed by Monte Carlo simulation. (D) Histograms of phase differences between RR (left, green) and theta (right, purple) activity recorded simultaneously in OB and LEC. (E) Left, bar diagram displaying the percentage of OB units coupled to the RR (green) and theta bursts (purple) in LEC and the percentage of LEC units coupled to the RR (green) and theta bursts (purple) in OB. Right, box plot showing the coupling strength of OB cells significantly locked to LEC oscillations (green: RR, purple: theta bursts) and of LEC cells significantly locked to OB oscillations (green: RR, purple: theta bursts). Gray dots correspond to individual cells (χ2 test of proportions, ***p < 0.001). (F) Histograms showing the distribution of preferred phases of LEC cells significantly locked to RR (left) and OB theta bursts (right) in neonatal OB. For comparison, histograms of OB cells locked to the respective OB rhythm are plotted as white bars. (G) Histograms showing the distribution of preferred phases of OB cells significantly locked to RR (left) and theta bursts (right) in neonatal LEC. For comparison, histograms of LEC cells locked to the respective LEC rhythm are plotted as white bars. Data are available in S1 Data. LEC, lateral entorhinal cortex; LFP, local field potential; MC, mitral cell; OB, olfactory bulb; P, postnatal day; RR, respiration-related rhythm.
Fig 6
Fig 6. Effects of pharmacological blockade of neuronal firing in OB on patterns of oscillatory activity in OB–LEC circuits.
(A) Schematic drawing of experimental protocol. (B) Photograph of the brain of a P10 mouse showing the confinement of injections to one hemisphere of the OB. For visualization, the same volume of methylene blue was used. (C) Characteristic LFP traces (black, filtered 1–100 Hz) recorded in OB (top) and LEC (bottom) of a P9 mouse before (left) and after (right) lidocaine infusion, displayed together with the wavelet spectrograms of the LFP and simultaneously recorded MUA. (D) Top, mean MUA firing rate in OB (left) and LEC (right) before and after lidocaine infusion. The time of infusion is considered 0. Bottom, box plots displaying the mean MUA in OB (left) and LEC (right) before and after lidocaine infusion (Friedmann test, Wilxocon signed-rank test with Bonferroni correction for post hoc comparison, *p < 0.0071). (E) Box plots displaying the power of RR activity in OB and LEC in the RR band before and after lidocaine infusion. Gray dots and lines correspond to individual animals (Wilcoxon signed-rank test, *p < 0.05; **p < 0.01). (F) Same as E for the theta burst activity in neonatal OB and LEC. (G) Scatterplot displaying the relationship between the occurrence changes (percent of baseline) of OB and LEC theta bursts (r = 0.008,p = 0.0039, Pearson correlation). Data are available in S1 Data. LEC, lateral entorhinal cortex; LFP, local field potential; MUA, multiunit activity; OB, olfactory bulb; P, postnatal day; RR, respiration-related rhythm.
Fig 7
Fig 7. Effects of rhythmic optogenetic MTC activation on LEC oscillatory activity and single-unit entrainment.
(A) Left, photograph of the ventral side of a brain from a P8 Cre+ Tbet-cre mouse showing EYFP-fluorescent MTC bodies in OB and their projections reaching PIR and LEC. Middle, photograph of the DiI-labeled optrode track into a 100 μm–thick coronal section of the OB from a P8 Cre+ Tbet-cre mouse. Right, photograph of the DiI-labeled electrode track into a 100 μm–thick coronal section of the LEC from a P8 Cre+ Tbet-cre mouse. (B) Spike trains from clustered units recorded simultaneously with the band-pass filtered (1–100 Hz, RR 2–4 Hz, theta 4–12 Hz) LFP in response to pulsed light (blue, 473 nm) stimulation of MTCs in OB (top) and LEC (bottom) of a P8 Cre+ Tbet-cre mouse. Traces are accompanied by the color-coded wavelet spectrograms of LFP shown at identical timescale. (C) Left, power spectra showing the relative LFP power change in OB (top) and LEC (bottom) after pulsed (8 Hz) light stimulation of MTCs in Cre and Cre+ mice. Inset, power spectra shown at higher magnification. Right, box plot showing OMI of theta power in OB (top) and LEC (bottom) of Cre and Cre+ mice (OB:p = 0.0002, LEC:p = 0.0004, Wilcoxon rank-sum test). For all plots, the red dotted line corresponds to unchanged power. (D) Left, plots of imaginary coherence between OB and LEC during pulsed (8 Hz) light stimulation of MTCs in Cre and Cre+ mice. Right, box plot displaying mean theta coherence during light stimulation of MTCs (p = 0.021, Wilcoxon rank-sum test). (E) Left, plots of cross-correlation between OB and LEC during light stimulation of MTCs in Cre and Cre+ mice. Right, box plot showing maximal cross-correlation during light stimulation of MTCs (p = 0.0002, Wilcoxon rank-sum test). (F) Left, coupling strength calculated as mean resultant vector length for LEC units to the OB theta rhythm during light stimulation of MTCs in Cre and Cre+ mice (p = 0.0055, Wilcoxon rank-sum test). Right, histograms showing the phase preference of LEC units (p = 0.01, Kuiper two-sample test). (G) Same as (F) for LEC units to LEC theta phase. (H) Spike trains in relationship to LFP in OB and LEC. Note the presence of both short and long delays between spikes from the two areas. (I) Mean standardized spike–spike cross-covariance of significant OB–LEC unit pairs from Cre+ mice (n = 27 pairs) and Cre mice (n = 61 pairs). Black dashed lines indicate the significance threshold. A negative time lag corresponds to OB → LEC. Data are available in S1 Data. EPL, external plexiform layer; EYFP, enhanced yellow fluorescent protein; LEC, lateral entorhinal cortex; LFP, local field potential; MC, mitral cell; MTC, mitral and tufted cell; OB, olfactory bulb; OMI, optogenetic modulation index; P, postnatal day; PIR, piriform cortex; RR, respiration-related rhythm; SUA, single-unit activity.
Fig 8
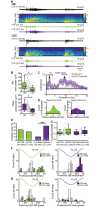
Fig 8. Odor-triggered activity patterns in OB and LEC of neonatal mouse.
(A) Characteristic LFP traces (band-pass filtered 1–100 Hz) recorded in OB (top) and LEC (bottom) of a P9 mouse before (baseline, left) and after application of odors (saline, middle; octanal, right) displayed together with simultaneously recorded MUA. (B) Box plots showing odor-evoked changes in the amplitude of RR (left), theta (middle), and beta (right) activity in OB when normalized to baseline. (C) Same as B for LEC. (D) Box plots showing odor-evoked relative changes in OB–LEC coherence in RR (left), theta (middle), and beta (right) band when normalized to baseline. Gray dots correspond to individual trials (Kruskal-Wallis test, Wilcoxon rank-sum test with Bonferroni correction as post hoc test, *p < 0.0167). Data are available in S1 Data. LEC, lateral entorhinal cortex; MUA, multiunit activity; OB, olfactory bulb; P, postnatal day; RR, respiration-related rhythm.
Fig 9
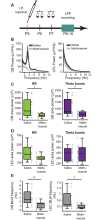
Fig 9. Effects of pharmacological lesioning of the nasal epithelium on the development of OB–LEC activity.
(A) Schematic drawing of experimental protocol. (B) Power spectra (mean ± SEM) of LFP recorded in OB (left) and LEC (right) of methimazole- (gray) and saline-treated (black) mice. (C) Box plots displaying power of RR (green) and theta bursts (purple) recorded in OB of methimazole- (gray) and saline-treated (black) mice. (D) Same for RR and theta bursts recorded in LEC. (E) Box plots displaying MUA frequency in OB and LEC of methimazole- (gray) and saline-treated (black) animals. (Wilcoxon rank-sum test, *p < 0.05; **p < 0.01). Data are available in S1 Data. I.P., intraperitoneal; LEC, lateral entorhinal cortex; LFP, local field potential; MUA, multiunit activity; OB, olfactory bulb; RR, respiration-related rhythm.
Fig 10
Fig 10. Schematic diagram of structural and functional coupling within OB–LEC networks of neonatal mice.
Mutual axonal projections (red) connect neonatal OB and LEC. Dotted line corresponds to weak anatomical connectivity. In OB of neonatal mice, continuous air flow–dependent RR and discontinuous MTC-driven theta bursts represent the two major patterns of oscillatory activity. They are augmented by olfactory stimuli (blue) that additionally evoke beta oscillations. OB activity boosts the oscillatory entrainment of neonatal LEC that, in turn, might drive the limbic circuits during development. HP, hippocampus; LEC, lateral entorhinal cortex; MTC, mitral and tufted cell; OB, olfactory bulb; PFC, prefrontal cortex; RR, respiration-related rhythm.
See this image and copyright information in PMC

Similar articles

See all similar articles

Cited by

See all "Cited by" articles

References

    1. Hanganu-Opatz IL. Between molecules and experience: role of early patterns of coordinated activity for the development of cortical maps and sensory abilities. Brain research reviews. 2010;64(1):160–76. 10.1016/j.brainresrev.2010.03.005 - DOI - PubMed
    1. Blankenship AG, Feller MB. Mechanisms underlying spontaneous patterned activity in developing neural circuits. Nat Rev Neurosci. 2010;11(1):18–29. 10.1038/nrn2759 - DOI - PMC - PubMed
    1. Luhmann HJ, Khazipov R. Neuronal activity patterns in the developing barrel cortex. Neuroscience. 2018;368:256–67. 10.1016/j.neuroscience.2017.05.025 - DOI - PubMed
    1. Colonnese MT, Kaminska A, Minlebaev M, Milh M, Bloem B, Lescure S, et al. A conserved switch in sensory processing prepares developing neocortex for vision. Neuron. 2010;67(3):480–98. 10.1016/j.neuron.2010.07.015 - DOI - PMC - PubMed
    1. Wang HC, Bergles DE. Spontaneous activity in the developing auditory system. Cell and tissue research. 2015;361(1):65–75. 10.1007/s00441-014-2007-5 - DOI - PMC - PubMed

Publication types

MeSH terms

Related information

LinkOut - more resources

Full text links
Public Library of Science full text link Public Library of Science Free PMC article
Cite
Send To

NCBI Literature Resources

MeSHPMCBookshelfDisclaimer

The PubMed wordmark and PubMed logo are registered trademarks of the U.S. Department of Health and Human Services (HHS). Unauthorized use of these marks is strictly prohibited.


[8]ページ先頭

©2009-2025 Movatter.jp