Movatterモバイル変換


[0]ホーム

URL:


Skip to main page content
U.S. flag

An official website of the United States government

Dot gov

The .gov means it’s official.
Federal government websites often end in .gov or .mil. Before sharing sensitive information, make sure you’re on a federal government site.

Https

The site is secure.
Thehttps:// ensures that you are connecting to the official website and that any information you provide is encrypted and transmitted securely.

NIH NLM Logo
Log inShow account info
Access keysNCBI HomepageMyNCBI HomepageMain ContentMain Navigation
pubmed logo
Advanced Clipboard
User Guide

Full text links

Elsevier Science full text link Elsevier Science Free PMC article
Full text links

Actions

Share

.2019 Mar:196:31-45.
doi: 10.1016/j.biomaterials.2018.02.009. Epub 2018 Feb 5.

Pluripotent stem cells as a source of osteoblasts for bone tissue regeneration

Affiliations

Pluripotent stem cells as a source of osteoblasts for bone tissue regeneration

Hui Zhu et al. Biomaterials.2019 Mar.

Abstract

Appropriate and abundant sources of bone-forming osteoblasts are essential for bone tissue engineering. Pluripotent stem cells can self-renew and thereby offer a potentially unlimited supply of osteoblasts, a significant advantage over other cell sources. We generated mouse embryonic stem cells (ESCs) and induced pluripotent stem cells (iPSCs) from transgenic mice expressing rat 2.3 kb type I collagen promoter-driven green fluorescent protein (Col2.3GFP), a reporter of the osteoblast lineage. We demonstrated that Col2.3GFP ESCs and iPSCs can be successfully differentiated to osteoblast lineage cells that express Col2.3GFP in vitro. We harvested GFP+ osteoblasts differentiated from ESCs. Genome wide gene expression profiles validated that ESC- and iPSC-derived osteoblasts resemble calvarial osteoblasts, and that Col2.3GFP expression serves as a marker for mature osteoblasts. Our results confirm the cell identity of ESC- and iPSC-derived osteoblasts and highlight the potential of pluripotent stem cells as a source of osteoblasts for regenerative medicine.

Keywords: Differentiation; Embryonic stem cells; Induced pluripotent stem cells; Osteoblasts; Tissue engineering.

Copyright © 2018 Elsevier Ltd. All rights reserved.


Figures
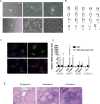
Fig. 1
Fig. 1. Generation of mouse Col2.3GFP ESC line
(A) Derivation of mouse Col2.3GFP ESC line. (a) The isolated blastocyst on feeder cells. (b) Day 2 at passage 0 with blastocyst outgrowths. (c) Day 5 at passage 0, with formation of a stem cell cluster ready for passage. (d) Day 2 at passage 1. (e) Representative image of mouse Col2.3GFP ESC line maintained on feeder cells. (f) Representative image of mouse Col2.3GFP ESC line maintained in feeder-free and serum-free conditions. Scale bar: 200 µm. (B) A representative chromosome spread of mouse Col2.3GFP ESC line (karyotype 40, XX). (C) Immunofluorescence staining for pluripotency markers Oct4 and SSEA1. Nuclei were stained with DAPI. Scale bars: 400 µm. (D) Mouse Col2.3GFP ESCs differentiated into three germ layers cellsin vitro. qRT-PCR analysis with lineage specific markers in undifferentiated mouse Col2.3GFP ESCs and differentiated Col2.3GFP ESC embryonic bodies. *,p<.05; **,p<.005 (relative to ESC). (E) Hematoxylin-eosin stained sections of teratoma formation with endoderm (respiratory), mesoderm (cartilage) and ectoderm (neural rosettes) tissues. Scale bar: 200 µm.
Fig. 2
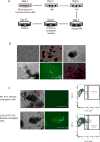
Fig. 2. Differentiation of mouse Col2.3GFP ESCs toward osteoblasts
(A) Schematic diagram of osteogenic differentiation of ESCs. (B) Representative images of differentiation. (a) Day 0 when differentiation of mouse Col2.3GFP ESCs is initiated. (b) Day 5 with formation of embryonic bodies. (c) Day 11 of differentiation. (d) Day 34 of differentiation (brightfield). (e) Day 34 of differentiation (live cell GFP image). (f) Day 34 of differentiation (Alizarin Red S staining). Scale bars: 200 µm (a,b,f), 1 mm (c-e). (C) Sorting of GFP+ cells at day 35. Cells differentiated from wide type (WT) ESCs were used as a sorting gate negative control for GFP expression. Scale bars: 1 mm.
Fig. 3
Fig. 3. Significantly upregulated genes from mouse Col2.3GFP ESC-OB are enriched in osteoblast differentiation and bone mineralization-related categories
(A) Gene expression changes in mouse ESC-OB versus ESC. The log2-fold change for gene expression level is plotted on the y-axis and the average of the counts normalized by size factor is shown on the x-axis. Each gene is represented with a dot. Differentially expressed genes with an adjustedp (FDR) value below 0.05 are shown in red. Compared to ESC population, 7022 genes were significantly upregulated and 5651 genes were downregulated in the ESC-OB population. (B) Osteoblast and bone related gene expression levels. Log2-fold change of expression level and −log10 (P value) in mouse ESC-OB versus ESC are shown on the X axis. (C) Gene Ontology Analysis of biological process for significantly upregulated genes in mouse ESC-OB versus ESC population. Gene fold enrichment and −log10 (P value) of top 20 annotation terms were shown.
Fig. 4
Fig. 4. Generation of mouse Col2.3GFP iPSC line
(A) Generation of mouse Col2.3GFP iPSC line. (a) Fibroblasts derived from Col2.3GFP mice (day 0). (b) Day 5 after transduction of lentivirus containing four pluripotency factors Oct4, Klf4, Sox2, and c-Myc. (c) Day 7 after transduction with formation of stem cell-like clones ready for passage. (d) Day 2 at passage 1. (e) Representative image of mouse Col2.3GFP iPSC line maintained on feeder cells. (f) Representative image of mouse Col2.3GFP iPSC line maintained in feeder-free and serum-free conditions. Scale bar: 200 µm. (B) A representative chromosome spread of mouse Col2.3GFP iPSC line (karyotype 40, XY). (C) Immunofluorescence staining for pluripotency markers Oct4 and SSEA1. Nuclei were stained with DAPI. Scale bars: 400 µm. (D) Mouse Col2.3GFP iPSCs differentiated into three germ layers cellsin vitro. qRT-PCR analysis with lineage specific markers in undifferentiated mouse Col2.3GFP iPSCs and differentiated Col2.3GFP iPSCs embryonic bodies. *,p<.05; **,p<.005; +,p<5×10⁻⁵ (relative to iPSC). (E) Hematoxylin-eosin stained sections of the teratoma formation with endoderm (respiratory), mesoderm (cartilage) and ectoderm (neural rosettes) tissues. Scale bar: 200 µm.
Fig. 5
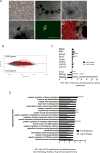
Fig. 5. Differentiation of mouse Col2.3GFP iPSCs toward osteoblasts
(A) Representative images of differentiation. (a) Day 0 when differentiation of mouse Col2.3GFP iPSCs is initiated. (b) Day 5 with formation of embryoid bodies. (c) Day 10 of differentiation. (d) Day 35 of differentiation (brightfield). (e) Day 35 of differentiation (live cell GFP image). (f) Day 35 of differentiation (Alizarin Red S staining). Scale bars: 200 µm (a, f), 1 mm (b–e). (B) A plot of gene expression changes in mouse iPSC-OB versus iPSC. The log2-fold change for gene expression level is plotted on the y-axis and the average of the counts normalized by size factor is shown on the x-axis. Each gene is represented with a dot. Differentially expressed genes with an adjustedp (FDR) value below 0.05 are shown in red. Compared to iPSC population, 4596 genes were significantly upregulated and 3332 genes were downregulated in the iPSC-OB population. (C) Osteoblast and bone related gene expression levels. Log2-fold change of expression level and −log10 (P value) in mouse iPSC-OB versus iPSC are shown on the X axis. (D) Gene Ontology Analysis of biological process for significantly upregulated genes in mouse iPSC-OB versus iPSC population. Gene fold enrichment and −log10 (P value) of top 20 annotation terms were shown.
Fig. 6
Fig. 6. ESC-OB and iPSC-OB resemble calvarial-OB
(A) Heatmap of sample-to-sample distances using rlog-transformed values of RNA-seq data. For each sample, the distance calculation is based on the contribution of rlog from all the genes. (B) PCA plot using the rlog-transformed values of RNA-seq data. Each color represents a sample type. Each sample has three or two replicates. (C) Heatmap of relative rlog-transformed values of total genes across samples. Each row represents a gene. Each column represents a cell type. (D) Heatmap of relative rlog-transformed values of differentially expressed genes in ESC-OB versus ESC across samples. Each row represents a gene. Each column represents a cell type.
Fig. 7
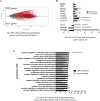
Fig. 7. Genes from ESC-OB GFP+ cells are enriched in osteoblast differentiation and bone mineralization related categories
(A) A plot of gene expression changes in mouse ESC-OB GFP+ versus ESC. The log2-fold change for gene expression level is plotted on the y-axis and the average of the counts normalized by size factor is shown on the x-axis. Each gene is represented with a dot. Differentially expressed genes with an adjustedp (FDR) value below 0.05 are shown in red. Compared to the ESC population, 7273 genes were significantly upregulated and 6018 genes were downregulated in the ESC-OB GFP+ population. (B) Osteoblast and bone related gene expression levels. Log2-fold change of expression level and −log10 (P value) in mouse ESC-OB GFP+ versus ESC are shown on the X axis. (C) Gene Ontology Analysis of biological process for significantly upregulated genes in mouse ESC-OB GFP+ versus ESC population. Gene fold enrichment and −log10 (P value) of top 22 annotation terms are shown.
Fig. 8
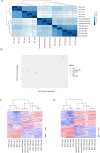
Fig. 8. ESC-OB GFP+ population resembles mouse bone GFP+ population
(A) FACS sorting of CD45/Ter119/CD31/GFP+(lo), CD45/Ter119/CD31/GFP+(hi), and CD45/Ter119/CD31/GFP cells from mouse long bone. Three biological replicates were processed. Long bone cells from WT mice were used as sorting gate negative control. (B) Heatmap of sample-to-sample distances using rlog-transformed values of RNA-seq data. (C) The sample distance between ESC, ESC-OB, ESC-OB GFP+ with mouse bone GFP+(lo) and GFP+(hi) populations. *,p<.05 (relative to ESC-OB). (D) Heatmap of relative rlog-transformed values of total genes across samples. Each row represents a gene. Each column represents a cell type. (E) Heatmap of relative rlog-transformed values of differentially expressed genes in ESC-OB GFP+ versus ESC across samples. Each row represents a gene. Each column represents a cell type.
See this image and copyright information in PMC

Similar articles

See all similar articles

Cited by

See all "Cited by" articles

References

    1. Panaroni C, Tzeng YS, Saeed H, Wu JY. Mesenchymal progenitors and the osteoblast lineage in bone marrow hematopoietic niches. Curr Osteoporos Rep. 2014;12(1):22–32. - PMC - PubMed
    1. Pittenger MF, Mackay AM, Beck SC, Jaiswal RK, Douglas R, Mosca JD, Moorman MA, Simonetti DW, Craig S, Marshak DR. Multilineage potential of adult human mesenchymal stem cells. Science. 1999;284(5411):143–7. - PubMed
    1. Dimitriou R, Jones E, McGonagle D, Giannoudis PV. Bone regeneration: current concepts and future directions. BMC Med. 2011;9:66. - PMC - PubMed
    1. Siddappa R, Licht R, van Blitterswijk C, de Boer J. Donor variation and loss of multipotency during in vitro expansion of human mesenchymal stem cells for bone tissue engineering. J Orthop Res. 2007;25(8):1029–41. - PubMed
    1. Meijer GJ, de Bruijn JD, Koole R, van Blitterswijk CA. Cell-based bone tissue engineering. PLoS Med. 2007;4(2):e9. - PMC - PubMed

Publication types

MeSH terms

Substances

Related information

Grants and funding

LinkOut - more resources

Full text links
Elsevier Science full text link Elsevier Science Free PMC article
Cite
Send To

NCBI Literature Resources

MeSHPMCBookshelfDisclaimer

The PubMed wordmark and PubMed logo are registered trademarks of the U.S. Department of Health and Human Services (HHS). Unauthorized use of these marks is strictly prohibited.


[8]ページ先頭

©2009-2025 Movatter.jp