Bacilli glutamate dehydrogenases diverged via coevolution of transcription and enzyme regulation
- PMID:28468957
- PMCID: PMC5494520
- DOI: 10.15252/embr.201743990
Bacilli glutamate dehydrogenases diverged via coevolution of transcription and enzyme regulation
Abstract
The linkage between regulatory elements of transcription, such as promoters, and their protein products is central to gene function. Promoter-protein coevolution is therefore expected, but rarely observed, and the manner by which these two regulatory levels are linked remains largely unknown. We study glutamate dehydrogenase-a hub of carbon and nitrogen metabolism. InBacillus subtilis, two paralogues exist: GudB is constitutively transcribed whereas RocG is tightly regulated. In their active, oligomeric states, both enzymes show similar enzymatic rates. However, swaps of enzymes and promoters cause severe fitness losses, thus indicating promoter-enzyme coevolution. Characterization of the proteins shows that, compared to RocG, GudB's enzymatic activity is highly dependent on glutamate and pH Promoter-enzyme swaps therefore result in excessive glutamate degradation when expressing a constitutive enzyme under a constitutive promoter, or insufficient activity when both the enzyme and its promoter are tightly regulated. Coevolution of transcriptional and enzymatic regulation therefore underlies paralogue-specific spatio-temporal control, especially under diverse growth conditions.
Keywords: Bacillus subtilis; enzyme evolution; glutamate dehydrogenases; paralogue specialization.
© 2017 The Authors.
Figures
- A
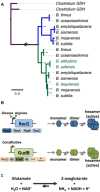
A representative tree showing the RocG and GudB genes along theBacillus genus (the NAD+‐specific GDH ofClostridia was used as out‐group 51; for a comprehensive analysis see Appendix Table S1). The scale bar shows amino acid substitutions per site. The blue branches correspond to RocG, and the green ones to GudB; this colour scheme is used throughout this paper. Species denoted in green lost the RocG paralogue. This study focussed on RocG and GudB fromBacillus subtilis NCIB 3610.
- B, C
A schematic representation of (B) the genomic context, transcriptional regulation, oligomeric structure and (C) enzymatic activity of RocG and GudB.
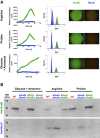
GudB (in green) and RocG (blue) transcription levels were determined by replacing the enzymes' ORFs with a GFP reporter. Left: Growth in liquid MS media with different nitrogen–carbon sources. The growth rates of all strains were identical (Appendix Fig S8), and thus, transcription levels are presented as the ratio of GFP florescence (OD535 nm) to cell density (OD600 nm). Each point is the result of two biological replicates and ≥ 16 technical replicates; SD values are shown in Appendix Fig S8. Centre: GFP fluorescence levels in cells grown on solid media containing different nitrogen–carbon sources. Cell derived from the agar colonies shown on the right was suspended in buffer and analysed by flow cytometry (the wild‐type strain is shown in grey). Shown are histograms for gated events (high fluorescence events; non‐gated histograms are available in Appendix Fig S2).
Western blot analysis of GudB and RocG levels in the different strains and under different growth conditions. Cells were harvested at the end of the logarithmic phase (OD600 ˜ 0.8). Twenty micrograms of total soluble cell protein was applied per lane. GudB and RocG were detected with the corresponding polyclonal antibodies (anti‐RocG 25 and anti‐GudB (kindly provided by Dr. Ulf Gerth)).
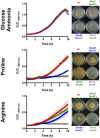

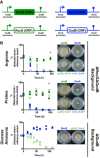
Schematic representation of the constructed swapped genes. Strains are marked by the standard colour code depending on their regulatory region (GudB in green, RocG in blue). Full green and blue boxes correspond to wild‐type genes with the cognate promoters and ORFs (shown in B as full circles (growth curves) or ordinary font (agar plates)). The open green box represents RocG ORF under GudB promoter/terminator, and the open blue box represents GudB ORF under RocG promoter/terminator (shown in B as open circles and hollow fonts). The gene constructs shown were inserted at a neutral landing site, in a strain having none of the wild‐type genes (ΔrocG_ΔgudB) or wild‐type RocG (ΔgudB).
Strains carrying the original genes and swapped constructs were individually competed against a wild‐type‐like reference strain. Shown is the % of the competing strain (streptomycin resistance) for each passage along the 5‐day experiments. The asterisk (*) denotes the frequencies observed in a calibrating experiment, namely, competing the wild‐type strain that was applied as the reference in the competitions against an identical strain carrying a streptomycin resistance marker. The results of two independent biological replicates were plotted. Circle colours as in (A). Photographs of the colonies on solid agar were taken as specified in Materials and Methods.
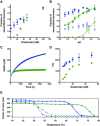
Hexameric assembly is glutamate dependent. Initial rates were measured from enzyme stocks incubated at the optimal pH (7.9) and varying concentrations of glutamate (0–200 mM). Enzymatic reactions were initiated by directly diluting to 0.05 μM final enzyme concentration in a reaction mixture containing 4 mM NAD+ and 10 mM glutamate. The reactions' initial velocities were normalized to the maximal initial velocity (fully assembled enzyme, pre‐incubated with 200 mM glutamate) and shown is the fraction of assembled hexamers versus glutamate concentration. Error bars represent the SD values from six experiments.
GudB enzyme activity is pH dependent. Initial rates were measured from enzyme stocks incubated at two glutamate concentrations, 50 mM (open circles) and 200 mM (full circles) and varying pH (6.3–8.2). Enzymatic reactions and calculations were as described above (A). Error bars represent the SD values from three independent runs.
Dissociation of hexamers in the course of the enzymatic reaction. Shown are enzymatic reactions initiated with pre‐assembled enzymes (optimal pH and glutamate concentration), directly diluted to 0.05 μM final enzyme concentration in reaction mixes containing 4 mM NAD+ and 5 mM glutamate. The line represents a fit to a single exponential decay (Vt = (Vt = 0 + Vt = ∞) × exp(−kt) + Vt = ∞). The derived decay time constants (τ = 1/k) are 290 ± 25 s for GudB and 1,490 ± 30 s for RocG. Error bars represent the SD values from four independent runs.
The dissociation decay time constants (τ) as a function of glutamate. The experiment as in panel (C) was repeated with varying concentrations of glutamate (5–50 mM). Presented is the time constant (τ = 1/k) in relation to glutamate concentration in the reaction mixture. Error bars represent the SD values from four independent runs.
Thermal unfolding curves, monitored by fluorescence, at 16 μM enzyme concentration in the absence (open circles and dotted lines) and presence of 250 mM glutamate (full circles and continues lines). As throughout the text, green and blue correspond to GudB and RocG, respectively. Lines show the fit of the data to the first equation in the section “Thermal denaturation assays” in Materials and Methods (see Materials and Methods from which the cooperativity constant (m) and apparentT0.5 was calculated; full data set with varying enzyme concentrations and calculated m‐values is shown in Appendix Fig S6B).
Comment in
- Enzyme sub-functionalization driven by regulation.van Loo B, Bornberg-Bauer E.van Loo B, et al.EMBO Rep. 2017 Jul;18(7):1043-1045. doi: 10.15252/embr.201744383. Epub 2017 Jun 14.EMBO Rep. 2017.PMID:28615289Free PMC article.
Similar articles
- Functional dissection of a trigger enzyme: mutations of the bacillus subtilis glutamate dehydrogenase RocG that affect differentially its catalytic activity and regulatory properties.Gunka K, Newman JA, Commichau FM, Herzberg C, Rodrigues C, Hewitt L, Lewis RJ, Stülke J.Gunka K, et al.J Mol Biol. 2010 Jul 23;400(4):815-27. doi: 10.1016/j.jmb.2010.05.055. Epub 2010 May 31.J Mol Biol. 2010.PMID:20630473
- CcpA-dependent regulation of Bacillus subtilis glutamate dehydrogenase gene expression.Belitsky BR, Kim HJ, Sonenshein AL.Belitsky BR, et al.J Bacteriol. 2004 Jun;186(11):3392-8. doi: 10.1128/JB.186.11.3392-3398.2004.J Bacteriol. 2004.PMID:15150224Free PMC article.
- A regulatory protein-protein interaction governs glutamate biosynthesis in Bacillus subtilis: the glutamate dehydrogenase RocG moonlights in controlling the transcription factor GltC.Commichau FM, Herzberg C, Tripal P, Valerius O, Stülke J.Commichau FM, et al.Mol Microbiol. 2007 Aug;65(3):642-54. doi: 10.1111/j.1365-2958.2007.05816.x. Epub 2007 Jul 3.Mol Microbiol. 2007.PMID:17608797
- Control of glutamate homeostasis in Bacillus subtilis: a complex interplay between ammonium assimilation, glutamate biosynthesis and degradation.Gunka K, Commichau FM.Gunka K, et al.Mol Microbiol. 2012 Jul;85(2):213-24. doi: 10.1111/j.1365-2958.2012.08105.x. Epub 2012 Jun 5.Mol Microbiol. 2012.PMID:22625175Review.
- Exploitation of Bacillus subtilis as a robust workhorse for production of heterologous proteins and beyond.Cui W, Han L, Suo F, Liu Z, Zhou L, Zhou Z.Cui W, et al.World J Microbiol Biotechnol. 2018 Sep 10;34(10):145. doi: 10.1007/s11274-018-2531-7.World J Microbiol Biotechnol. 2018.PMID:30203131Review.
Cited by
- The DEAD-Box RNA Helicases ofBacillus subtilis as a Model to Evaluate Genetic Compensation Among Duplicate Genes.González-Gutiérrez JA, Díaz-Jiménez DF, Vargas-Pérez I, Guillén-Solís G, Stülke J, Olmedo-Álvarez G.González-Gutiérrez JA, et al.Front Microbiol. 2018 Sep 25;9:2261. doi: 10.3389/fmicb.2018.02261. eCollection 2018.Front Microbiol. 2018.PMID:30337909Free PMC article.
- The Mycobacterium abscessusmbtE Analog MAB_2122 Is, in Contrast to thembtE Analog MAB_2248c, Dispensable for Normal Growth in Low-Iron Conditions.Foreman M, Barkan D.Foreman M, et al.Microbiol Spectr. 2023 Feb 14;11(1):e0516022. doi: 10.1128/spectrum.05160-22. Epub 2023 Jan 25.Microbiol Spectr. 2023.PMID:36695600Free PMC article.No abstract available.
- Novel antibiofilm chemotherapies target nitrogen from glutamate and glutamine.Hassanov T, Karunker I, Steinberg N, Erez A, Kolodkin-Gal I.Hassanov T, et al.Sci Rep. 2018 May 8;8(1):7097. doi: 10.1038/s41598-018-25401-z.Sci Rep. 2018.PMID:29740028Free PMC article.
- A pair of isoleucyl-tRNA synthetases in Bacilli fulfills complementary roles to keep fast translation and provide antibiotic resistance.Zanki V, Bozic B, Mocibob M, Ban N, Gruic-Sovulj I.Zanki V, et al.Protein Sci. 2022 Sep;31(9):e4418. doi: 10.1002/pro.4418.Protein Sci. 2022.PMID:36757682Free PMC article.
- A counter-enzyme complex regulates glutamate metabolism in Bacillus subtilis.Jayaraman V, Lee DJ, Elad N, Vimer S, Sharon M, Fraser JS, Tawfik DS.Jayaraman V, et al.Nat Chem Biol. 2022 Feb;18(2):161-170. doi: 10.1038/s41589-021-00919-y. Epub 2021 Dec 20.Nat Chem Biol. 2022.PMID:34931064Free PMC article.
References
- Jacob F, Monod J (1961) Genetic regulatory mechanisms in the synthesis of proteins. J Mol Biol 3: 318–356 - PubMed
- Hittinger CT, Carroll SB (2007) Gene duplication and the adaptive evolution of a classic genetic switch. Nature 449: 677–681 - PubMed
- Gu ZL, Nicolae D, Lu HHS, Li WH (2002) Rapid divergence in expression between duplicate genes inferred from microarray data. Trends Genet 18: 609–613 - PubMed
Publication types
MeSH terms
Substances
Related information
LinkOut - more resources
Full Text Sources
Other Literature Sources
Molecular Biology Databases
