Movatterモバイル変換


[0]ホーム

URL:


Skip to main page content
U.S. flag

An official website of the United States government

Dot gov

The .gov means it’s official.
Federal government websites often end in .gov or .mil. Before sharing sensitive information, make sure you’re on a federal government site.

Https

The site is secure.
Thehttps:// ensures that you are connecting to the official website and that any information you provide is encrypted and transmitted securely.

NIH NLM Logo
Log inShow account info
Access keysNCBI HomepageMyNCBI HomepageMain ContentMain Navigation
pubmed logo
Advanced Clipboard
User Guide

Full text links

Elsevier Science full text link Elsevier Science Free PMC article
Full text links

Actions

Share

.2016 Apr 27;2(4):260-71.
doi: 10.1016/j.cels.2016.04.003. Epub 2016 Apr 27.

Global Rebalancing of Cellular Resources by Pleiotropic Point Mutations Illustrates a Multi-scale Mechanism of Adaptive Evolution

Affiliations

Global Rebalancing of Cellular Resources by Pleiotropic Point Mutations Illustrates a Multi-scale Mechanism of Adaptive Evolution

Jose Utrilla et al. Cell Syst..

Abstract

Pleiotropic regulatory mutations affect diverse cellular processes, posing a challenge to our understanding of genotype-phenotype relationships across multiple biological scales. Adaptive laboratory evolution (ALE) allows for such mutations to be found and characterized in the context of clear selection pressures. Here, several ALE-selected single-mutation variants in RNA polymerase (RNAP) of Escherichia coli are detailed using an integrated multi-scale experimental and computational approach. While these mutations increase cellular growth rates in steady environments, they reduce tolerance to stress and environmental fluctuations. We detail structural changes in the RNAP that rewire the transcriptional machinery to rebalance proteome and energy allocation toward growth and away from several hedging and stress functions. We find that while these mutations occur in diverse locations in the RNAP, they share a common adaptive mechanism. In turn, these findings highlight the resource allocation trade-offs organisms face and suggest how the structure of the regulatory network enhances evolvability.

Copyright © 2016 Elsevier Inc. All rights reserved.


Figures

Figure 1
Figure 1. Growth versus hedging antagonistic pleiotropy in organismal phenotypes
A) Adaptive Laboratory Evolution (ALE) -selectedrpoB mutations (E546V blue, E672K gray) grow faster in the glucose consumption phase but have a longer diauxic shift to grow on acetate than the wild type (red) (Table S1). B) In addition to growth on glucose (the environment in which the mutants were selected), several additional organismal phenotypes are affected by therpoB mutations. Bar charts show the percent change in measured phenotypes compared to the wild type. Steady-state growth rate increases (cyan) and growth rate in LB medium as well as fitness in environmental shifts and shocks decreases (brown). LB: Luria Broth, Glc: Glucose, Succ: Succinate, Ac: Acetate, Ery 100: 100 μg/mL erythromycin, Amp: Ampicillin. See also Figure S1 and S2, Table S1 and S2.
Figure 2
Figure 2. Consistent molecular growth versus hedging response
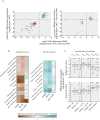
A) The differential RNA expression in the ALE-selectedrpoB mutants (E546V, E672K) is consistent (left). The differential RNA expression in glucose is also concordant with the differential protein expression measured in a previous work on glycerol of an ALE-selected 27 aa deletion in β′ compared to the wild type (rpoC-del27 (Cheng et al., 2014) right). B) Functional classification of differentially expressed genes reveals that genes with common functions are often differentially expressed in the same direction, segregating growth (up-regulated, cyan) and hedging (down-regulated, brown) functions. Gray dots are genes with functions that are not consistently differentially expressed. Median differential expression of genes in the functional categories is shown in the heat map; dashes indicate genes not detected in proteomics data (Cheng et al., 2014). C) Environmental controls disentangle direct effects of the mutations and indirect effects of changes in growth. Box plots show differential expression of identified growth and hedging functions across environments, showing that hedging functions are consistently down-regulated and the expression of growth functions depends on the growth rate. Stars indicate if the mean differential expression of the group of genes is significantly different than zero, based on a two-sided t-test (p<0.05, *; p< 0.0001, ***). See also Figure S3 and Table S3.
Figure 3
Figure 3. ALE-selectedrpoB mutations modulate structural dynamic of theE. coli RNAP
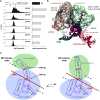
A) Change in interaction energy between the β & β′ subunits across six different E672 mutations, compared with their corresponding growth rates. To reduce bias from a single static crystal structure, interaction energy is calculated every 25 ps over a 60 ns molecular dynamic trajectory starting from the RNAP open complex. B) Dynamical community structures encompassing the ALE-selected mutations. Community 1 (green), as discussed in the text, includes the bridge helix in β′ subunit (purple), βE672, βE546, and a few other ALE-selected mutations in contact with βE672. Community 2 (brown) spans the interface between the β & β′ subunits, interacting with community 1 on one side, and the (p)ppGpp binding site on the other. C) A schematic representation showing how relative movements between the dynamical communities modulates open complex stability. Components are color coded as in panel B. A third community (blue) is identified for calculating the correlated motions with respect to the mutation containing community 1. Continuous arrows show the direction of relative collective motions of the community structures. Effective allosteric communication between distantly located residues can be resolved from optimal path calculated based on a dynamical correlation network. The result shows that βE672 and βE546 share the same optimal dynamical path (orange) towards the (p)ppGpp binding site in the ω subunit. Structural elements are shown from the same perspective, and color-coded the same as in B). See also Figure S2 and Table S4.
Figure 4
Figure 4. Reprograming of the regulatory network
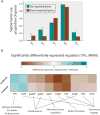
A) The σ factor usage of differentially expressed genes in mutant strains is shown. Bars indicate the fraction of up-regulated (cyan) and down-regulated (brown) genes that have a promoter that is regulated by a given σ factor. Only σ factors with greater than 10% of promoters regulated among either up-regulated or down-regulated genes are shown. Significant differences in the proportion between σ factor use in up-regulated and down-regulated genes are indicated with asterisks; one asterisk indicates p<0.05 and two asterisks indicate p<0.005. B) The fold change for transcription factors and sRNA that are significantly differentially expressed in both mutant strains compared to the wild-type are shown. See also Figure S4 and Table S3.
Figure 5
Figure 5. The changes and effects of proteomic and energetic resource allocation
A) A genome-scale model of Metabolism and gene Expression (ME-Model) is used to integrate the RNA-sequencing and physiological data. The transcriptome fraction devoted to ME and non-ME (i.e., not included in the ME-Model) genes is calculated for the wild-type and mutant strains. Grey area of the pie chart indicates the fraction of the transcriptome reallocated from non-ME to ME genes. Bar chart shows the functional categories that reduced or increased in expression by more than 0.1% of the total transcriptome. Abbreviations for the functional categories are: amino acid biosynthesis (AA), protein synthesis/folding (Pro), acid resistance (AR), and flagellar (Fla). All percentages are shown as the average for E546V and E672K. B) The physiological data was used to calculate the energy use not accounted for by the ME-Model (see Methods, Computation of maximum unaccounted for energy), showing a reduction in unaccounted for energy use inrpoB mutants compared to the wild-type. Error bars indicate standard error across biological replicates. C) The effects of non-ME protein and energy use on maximal growth rates in the ME-Model are computed and shown in the contour plot (see Methods). The wild-type and mutant strains are indicated on the plot, showing how lower non-ME protein and energy use can cause increased growth. See also Figure S5.
Figure 6
Figure 6. Multi-scale characterization from genotype to phenotype
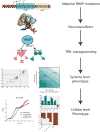
The multi-scale effects of the studied adaptive regulatory mutations in RNAP are summarized. The mutations alter the structural dynamics of the RNAP, perturbing the transcriptional regulatory network through the action of key transcription factors. The decrease in expression of hedging functions lowers the proteome and energy allocation towards hedging functions and increases cellular growth. In turn, the cell can grow faster in conditions of steady-state growth, but is less fit under environmental shifts and shocks.
See this image and copyright information in PMC

Similar articles

See all similar articles

Cited by

See all "Cited by" articles

References

    1. Bar-Nahum G, Epshtein V, Ruckenstein AE, Rafikov R, Mustaev A, Nudler E. A ratchet mechanism of transcription elongation and its control. Cell. 2005;120:183–193. - PubMed
    1. Barker MM, Gaal T, Gourse RL. Mechanism of regulation of transcription initiation by ppGpp. II. Models for positive control based on properties of RNAP mutants and competition for RNAP. Journal of molecular biology. 2001;305:689–702. - PubMed
    1. Barrick JE, Kauth MR, Strelioff CC, Lenski RE. Escherichia coli rpoB mutants have increased evolvability in proportion to their fitness defects. Molecular biology and evolution. 2010;27:1338–1347. - PMC - PubMed
    1. Best RB, Zhu X, Shim J, Lopes PE, Mittal J, Feig M, Mackerell AD., Jr Optimization of the additive CHARMM all-atom protein force field targeting improved sampling of the backbone phi, psi and side-chain chi(1) and chi(2) dihedral angles. J Chem Theory Comput. 2012;8:3257–3273. - PMC - PubMed
    1. Cashel M, Hsu LM, Hernandez VJ. Changes in conserved region 3 of Escherichia coli sigma 70 reduce abortive transcription and enhance promoter escape. J Biol Chem. 2003;278:5539–5547. - PubMed

Publication types

MeSH terms

Substances

Related information

Grants and funding

LinkOut - more resources

Full text links
Elsevier Science full text link Elsevier Science Free PMC article
Cite
Send To

NCBI Literature Resources

MeSHPMCBookshelfDisclaimer

The PubMed wordmark and PubMed logo are registered trademarks of the U.S. Department of Health and Human Services (HHS). Unauthorized use of these marks is strictly prohibited.


[8]ページ先頭

©2009-2025 Movatter.jp