Movatterモバイル変換


[0]ホーム

URL:


Skip to main page content
U.S. flag

An official website of the United States government

Dot gov

The .gov means it’s official.
Federal government websites often end in .gov or .mil. Before sharing sensitive information, make sure you’re on a federal government site.

Https

The site is secure.
Thehttps:// ensures that you are connecting to the official website and that any information you provide is encrypted and transmitted securely.

NIH NLM Logo
Log inShow account info
Access keysNCBI HomepageMyNCBI HomepageMain ContentMain Navigation
pubmed logo
Advanced Clipboard
User Guide

Full text links

Elsevier Science full text link Elsevier Science Free PMC article
Full text links

Actions

Share

.2016 Mar 24;165(1):139-152.
doi: 10.1016/j.cell.2016.02.034.

Lysosomal Disorders Drive Susceptibility to Tuberculosis by Compromising Macrophage Migration

Affiliations

Lysosomal Disorders Drive Susceptibility to Tuberculosis by Compromising Macrophage Migration

Russell D Berg et al. Cell..

Abstract

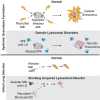
A zebrafish genetic screen for determinants of susceptibility to Mycobacterium marinum identified a hypersusceptible mutant deficient in lysosomal cysteine cathepsins that manifests hallmarks of human lysosomal storage diseases. Under homeostatic conditions, mutant macrophages accumulate undigested lysosomal material, which disrupts endocytic recycling and impairs their migration to, and thus engulfment of, dying cells. This causes a buildup of unengulfed cell debris. During mycobacterial infection, macrophages with lysosomal storage cannot migrate toward infected macrophages undergoing apoptosis in the tuberculous granuloma. The unengulfed apoptotic macrophages undergo secondary necrosis, causing granuloma breakdown and increased mycobacterial growth. Macrophage lysosomal storage similarly impairs migration to newly infecting mycobacteria. This phenotype is recapitulated in human smokers, who are at increased risk for tuberculosis. A majority of their alveolar macrophages exhibit lysosomal accumulations of tobacco smoke particulates and do not migrate to Mycobacterium tuberculosis. The incapacitation of highly microbicidal first-responding macrophages may contribute to smokers' susceptibility to tuberculosis.

Copyright © 2016 The Authors. Published by Elsevier Inc. All rights reserved.


Figures
None
Graphical abstract
Figure 1
Figure 1
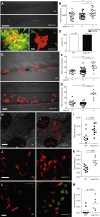
snapc1b Mutants Are Hypersusceptible toM. marinum and Have Increased Numbers of Macrophages that Display Vacuolated Morphology (A) Representative images of wild-type (WT) andsnapc1bfh111/fh111 mutant larvae 4 days post-infection (dpi) with 150M. marinum (Mm). Scale bar, 300 μm. (B) Quantification of Mm burden measured by fluorescence insnapc1bfh111/+ incross larvae at 5 dpi with 240 Mm. (C) Confocal images of green fluorescent macrophages (MΦ) and red fluorescent bacteria in intact granulomas of WT larvae and extracellular corded bacteria following complete granuloma breakdown insnapc1b mutant larva at 2 dpi with 200 Mm. Scale bar, 15 μm. (D) Quantification of bacterial cording in larvae from an incross ofsnapc1bfh111/+ parents at 5 dpi with 200 Mm. (E) Confocal images of the caudal hematopoietic tissue (CHT) of representative WT andsnapc1b mutant larvae with red fluorescent macrophages at 6 days post-fertilization (dpf). Scale bar, 20 μm. (F and G) Quantification of fluorescent macrophages (F) and neutral red-stained cells (G) in the CHT ofsnapc1bfh111/+ incross larvae at 6 dpf. (H) Confocal images of fluorescent macrophages in the head of representative WT andsnapc1b mutant larvae at 3 dpf. Dotted lines indicate the outline of larvae. Scale bar, 100 μm. (I) Total macrophage volume in the brains of WT andsnapc1b mutant larvae at 5 dpf. Volumetric analysis performed from 3D confocal images on red fluorescence signal. (J) Confocal images of fluorescent macrophages in the brain of WT andsnapc1b mutant larvae at 3 dpf. Scale bar, 60 μm. (K) Measurement of oblate ellipticity of macrophages in the brains of WT andsnapc1b mutant larvae at 3 dpf. (L) Confocal images red fluorescent macrophages stained with LysoTracker green in the brains of 3 dpf WT andsnapc1b mutant larvae. Scale bar, 30 μm. (M) Average lysosomal volume per animal normalized to total macrophage volume. Macrophage and lysosomal volumes were determined by volumetric analysis of red fluorescence (macrophages) and green fluorescence (lysosomes) in 3D confocal images. Statistical significance was assessed by one-way ANOVA with Sidak’s post-test (B, F, and G) or Student’s t test (I, K, and M). See also Figures S1 and S2, and Tables S2 and S3.
Figure 2
Figure 2
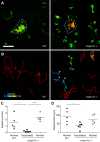
Lysosomal Storage insnapc1b Mutants Compromises Physiological Efferocytosis (A) Still images from confocal video of green fluorescent macrophages insnapc1b mutant larval and WT sibling brains. Time of image is indicated in minutes. Arrows mark pseudopodia; arrowheads mark vacuoles. Vertical dotted red line indicates the time point immediately following phagocytic event. Scale bar, 15 μm. (B) Speed of WT andsnapc1b mutant macrophages from the confocal video in (A). Average speed before and after the phagocytic events are indicated by a horizontal blue line. Green dots correspond to time points in the images shown in (A). (C) Migration of normal and vacuolated macrophages from the same animal to CCL2 injected into the HBV. (D) Representative confocal image of red fluorescent macrophages stained with acridine orange (AO) in brains ofsnapc1b mutant larvae and WT siblings at 3 dpf. Arrow marks a wild-type macrophage with very little AO staining. Arrowhead marks a rare AO positive macrophages seen in WT brains. Scale bar, 30 μm. (E and F) Confocal images (E) and quantification (F) of green fluorescent acridine-orange-stained unengulfed cell debris in the brains ofsnapc1b mutant larvae and WT siblings at 5 dpf. Scale bar, 150 μm. Images in (E) denoted as red data points in (F). Statistical significance was assessed by Student’s t test (B and F) and paired t test (C). See also Figure S3.
Figure 3
Figure 3
snapc1b Mutant Macrophages Fail to Participate in Granuloma Formation (A) Confocal images of granulomas in the hindbrain ventricle ofsnapc1b mutant larvae and WT siblings with green fluorescent macrophages at 2 dpi with 100 red fluorescent Mm. Scale bar, 60 μm. (B) Tracks of macrophage movement following granuloma formation insnapc1b mutant larvae and WT siblings shown in (A). Tracks are coded for speed. Tracks created by vacuolated macrophages are indicated with an asterisk. (C and D) Speed (C) and displacement (D) ofsnapc1b mutant and WT sibling macrophages in (A and B). Statistical significance was assessed using one-way ANOVA with Sidak’s post-test.
Figure 4
Figure 4
Cathepsin L Deficiency Causessnapc1b Mutant Vacuolated Macrophage Morphology and Susceptibility toM. marinum (A) Quantitative real-time PCR of relativectsl1 transcript insnapc1b+/− incross larvae at 6 dpf. Values normalized to transcript level of the heterozygous larvae, representative of two experiments. (B and C) Confocal images of green fluorescent macrophages in larvae injected with red fluorescent MR-Cathepsin L at 3 dpf, either following treatment with E64d or DMSO control at 2dpf (B) or insnapc1b mutants and WT siblings (C). Yellow or white arrowheads denote macrophages that are positive or negative for MR-Cathepsin, respectively. Scale bar, 50 μm. (D) Confocal images of green fluorescent macrophages stained with LysoTracker red in the brains of 3-dpf E64d-treated and DMSO control larvae. Scale bar, 50 μm. (E) Average macrophage speeds during a 5-hr movie in the brains of 3-dpf E64d-treated and DMSO control larvae. (F) Quantification of bacterial cording in DMSO control and E64d-treated larvae at 5 dpi with 150 Mm. (G) Confocal images of green fluorescent macrophages stained with LysoTracker red in the brains of 3-dpfctsl1 morphants and control larvae. Scale bar, 50 μm. (H) Average macrophage speeds during a 5-hr movie in the brains of 3-dpfctsl1 morphants and control larvae. (I) Quantification of bacterial cording in control,snapc1b, andctsl1 morphants at 5 dpi with 200 Mm. (J) Quantification of vacuolated macrophages in the brains of 3-dpf WT orsnapc1b mutant larvae following injection ofctsl1 RNA or control at 0 dpf. (K) Quantification of bacterial cording at 2 dpi with 215 Mm in the HBV ofsnapc1b mutants and WT siblings following injection ofctsl1 RNA or control. Statistical significance was assessed by ANOVA with Sidak’s post test (E, H, and J) or Fisher’s exact test (F, I, and K). See also Figure S4.
Figure 5
Figure 5
Lysosomal Storage Disorders Disrupt Macrophage Migration and Cause Granuloma Breakdown (A and B) Confocal images of green fluorescent macrophages in the brain of 3-dpf control and morphant larvae, unstained (A) or following staining with LysoTracker Red (B). Scale bars, 10 μm. (C) Quantification of average macrophage speed in control and morphant larvae by macrophage morphology (wt, wild-type; vac, vacuolated). (D–F) Quantification of bacterial cording in control and morphant larvae at 3 dpi with 200 Mm. Statistical significance was determined using paired t tests with Bonferroni correction (C) and Fisher’s exact test (D–F).
Figure 6
Figure 6
Macrophage Lysosomal Storage Disrupts Endocytic Recycling (A) Confocal images of red fluorescent macrophages following injection of green fluorescent dextran in E64d-treated and DMSO control larvae (3 dpf) at 5 and 30 hr post-injection. Yellow and white arrowheads denote macrophages with and without dextran, respectively. Scale bar, 50 μm. (B) Quantification of the percentage of macrophages that are positive for dextran in E64d-treated and DMSO control larvae (3 dpf) at 5 and 30 hr post-injection. (C) Confocal images of red fluorescent macrophages following injection of green fluorescent dextran ingba morphants and control larvae (3 dpf) at 5 and 30 hr post-injection. Yellow and white arrowheads denote macrophages with and without dextran, respectively. Scale bar, 50 μm. (D) Quantification of the percentage of macrophages that are positive for dextran ingba morphants and control larvae (3 dpf) at 5 and 30 hr post-injection. See also Figure S5.
Figure 7
Figure 7
Lysosomal Accumulation of Tobacco Smoke Products in Alveolar Macrophages Compromises Migration toM. tuberculosis (A) Representative images showing the characteristics of macrophages isolated by bronchoalveolar lavage from smokers and nonsmokers. Scale bars (left to right), 400, 10, 20, and 10 μm. (B) Percentage of vacuolated macrophages was assessed in smokers, ex-smokers, and nonsmokers. Vacuolated macrophages were scored based on their autofluorescence and morphology. (C) Number of macrophages that migrated through a transwell was assessed at 2 and 6 hr of incubation with either 0.1% fetal bovine serum (FBS) or Mtb H37Ra using macrophages from an ex-smoker. Values represent averages of a single experiment performed in triplicate. (D) Number of macrophages from non/ex-smokers that migrated through a transwell toward Mtb H37Ra (assessed following 2 hr incubation). (E) Fraction of macrophages that migrated in the transwell assay calculated from initial versus migrated macrophages of each morphology. Samples from smokers are split into vacuolated and normal with unique symbols for each patient. Statistical significance was assessed by one-way ANOVA with Sidak’s post-test (B), Student’s t test (D), paired t test (E). See also Figure S6 and Table S4.
Figure S1
Figure S1
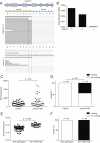
Genetic Disruption of thesnapc1b Locus Confers Susceptibility toM. marinum Infection, Related to Figure 1 (A) Top: Diagram ofsnapc1b gene showing introns (blue), exons (gray), and location of thefh111 splice acceptor mutation denoted by an asterisk above the relevant exon-intron boundary. Bottom: RNA-sequencing reads aligned to the exon 2 splice acceptor site from WT andsnapc1bfh111/fh111 mutant larvae with wild-type and mutant sequence. Thesnapc1b(fh111) mutation is denoted in red. (B) Quantitative real-time PCR of properly splicedsnapc1b transcript insnapc1b+/− incross larvae at 6 dpf. Values normalized to transcript level of β-actin, representative of two experiments. (C and D) Quantification of bacterial burden (C) and cording (D) in control and morphant larvae at 4 dpi with 250 Mm. (E and F) Quantification of bacterial burden and cording insnapc1bTg(la010158)/+ ×snapc1bfh111/+ cross larvae at 5 dpi with 150 Mm. Statistical significance was assessed by Student’s t test (C,E) and Fisher’s exact test (D).
Figure S2
Figure S2
snapc1b Mutants Have Numerous Vacuolated Macrophages and Normal Neutrophil Numbers in the Caudal Hematopoietic Tissue, Related to Figure 1 (A and B) (A) Brightfield and (B) confocal images of the CHT of representative WT and snapc1b-/- mutant larvae at 5 dpf. Scale bar 50μm. (C) 8X magnification of outlined regions in (B) showing normal (top) and vacuolated (bottom) morphology. (D) Quantification of Lyz:eGFP positive, green fluorescent neutrophils insnapc1b+/− incross larvae at 6 dpf.
Figure S3
Figure S3
Global Inhibition of Apoptosis Reduces the Abundance of Vacuolated Macrophages in thesnapc1b Mutant, Related to Figure 2 (A) Quantification of extracellular AO positive particles in WT andsnapc1b mutant larvae at 3 dpf following treatment with 10 μM Q-VD-OPh or DMSO control. (B) Quantification of AO-positive vacuolated macrophages insnapc1b mutant larvae and WT siblings at 3dpf following treatment with 10 μM Q-VD-OPh or DMSO control. (C) Quantification of LysoTracker-positive macrophages insnapc1b mutant larvae and WT siblings at 3dpf following treatment with 50 μM Q-VD-OPh or DMSO.
Figure S4
Figure S4
Macrophages ofsnapc1b Mutant and cathepsin L-Deficient Animals Restrict Mycobacterial Growth Normally, Related to Figure 4 (A) Macrophage intracellular bacterial burdens ofsnapc1b+/− incross larvae andtnfr1 morphants infected with 100 red fluorescent Mm at 2 dpf in the caudal vein. Bacterial volume (μm3) was quantified per animal from 3D confocal images captured in the tail region at 40 hpi. The intramacrophage replication of Mm is unrestricted intnfr1 morphants as expected (Clay et al., 2008; Pagán et al., 2015, Tobin et al., 2010). (B) Percentage of macrophages with high intracellular bacterial burdens in control,ctsl1 andtnfr1 morphants infected with ∼75 red fluorescent Mm at 2 dpf in the caudal vein. Bacterial burden was quantified per animal by counting the average number of bacteria per macrophage and categorizing as low (1-5 bacteria) or high (> 5 bacteria). Statistical significance was assessed by one-way ANOVA with Sidak’s post test (A, B).
Figure S5
Figure S5
Lysosomal Accumulation of Inert Particles Compromises Endocytic Recycling and Migration to the Initial Site of Mycobacterial Infection, Related to Figure 6 (A) Confocal images of green fluorescent macrophages in larvae mock-injected or injected with 5x10⁵ blue fluorescent 1 μm polystyrene beads. Scale bar, 12 μm. (B and C) Speed (B) and displacement (C) of macrophages with and without beads. (D) Confocal images of red fluorescent macrophages in 3dpf larvae pre-loaded with blue fluorescent polystyrene beads as in (A), injected 12 hr later with green fluorescent dextran and imaged at 5 and 30 hr post-dextran injection. Blue and white arrowheads denote macrophages containing dextran, with and without blue beads, respectively. Scale bar, 50 μm. (E) Quantification of macrophages that retained dextran at 5 and 30 hr post injection. (F) Diagram showing the experimental outline in which 2 dpf larvae were injected with Hoechst dye or beads in the CV followed by infection in the HBV with 200 Mm. (G and H) Confocal images of larval HBV containing green-fluorescent macrophages following CV injections with Hoechst (G) or blue fluorescent beads (H). Arrow and arrowhead denote Hoechst-positive macrophages that have migrated from the CHT, with and without phagocytosed red fluorescent Mm, respectively. Scale bar, 10 μm. (I) Number of macrophages in the HBV after injection of dye or beads in the CV followed by Mm infection in the HBV. Statistical significance was assessed using Student’s t test (B, C, and I), and one-way ANOVA with Sidak’s post test (E).
Figure S6
Figure S6
Alveolar Macrophage Migration to ZAS and Mtb, Related to Figure 7 (A) Migration of macrophages from nonsmoker SJH209 to 0.1% FBS, ZAS or Mtb at 2 hr. (B) Migration of macrophages from ex-smoker to Mtb at 1.5 and 3 hr in transwell assay.
See this image and copyright information in PMC

Comment in

Similar articles

See all similar articles

Cited by

See all "Cited by" articles

References

    1. Abrams J.M., White K., Fessler L.I., Steller H. Programmed cell death during Drosophila embryogenesis. Development. 1993;117:29–43. - PubMed
    1. Aflaki E., Stubblefield B.K., Maniwang E., Lopez G., Moaven N., Goldin E., Marugan J., Patnaik S., Dutra A., Southall N. Macrophage models of Gaucher disease for evaluating disease pathogenesis and candidate drugs. Sci. Transl. Med. 2014;6:240ra73. - PMC - PubMed
    1. Aker M., Zimran A., Abrahamov A., Horowitz M., Matzner Y. Abnormal neutrophil chemotaxis in Gaucher disease. Br. J. Haematol. 1993;83:187–191. - PubMed
    1. Allen T.C. Pulmonary Langerhans cell histiocytosis and other pulmonary histiocytic diseases: a review. Arch. Pathol. Lab. Med. 2008;132:1171–1181. - PubMed
    1. Alonso S., Pethe K., Russell D.G., Purdy G.E. Lysosomal killing of Mycobacterium mediated by ubiquitin-derived peptides is enhanced by autophagy. Proc. Natl. Acad. Sci. USA. 2007;104:6031–6036. - PMC - PubMed

Publication types

MeSH terms

Substances

Related information

Grants and funding

LinkOut - more resources

Full text links
Elsevier Science full text link Elsevier Science Free PMC article
Cite
Send To

NCBI Literature Resources

MeSHPMCBookshelfDisclaimer

The PubMed wordmark and PubMed logo are registered trademarks of the U.S. Department of Health and Human Services (HHS). Unauthorized use of these marks is strictly prohibited.


[8]ページ先頭

©2009-2025 Movatter.jp