Movatterモバイル変換


[0]ホーム

URL:


Skip to main page content
U.S. flag

An official website of the United States government

Dot gov

The .gov means it’s official.
Federal government websites often end in .gov or .mil. Before sharing sensitive information, make sure you’re on a federal government site.

Https

The site is secure.
Thehttps:// ensures that you are connecting to the official website and that any information you provide is encrypted and transmitted securely.

NIH NLM Logo
Log inShow account info
Access keysNCBI HomepageMyNCBI HomepageMain ContentMain Navigation
pubmed logo
Advanced Clipboard
User Guide

Full text links

Atypon full text link Atypon Free PMC article
Full text links

Actions

Share

.2015 Aug 11;112(32):E4495-504.
doi: 10.1073/pnas.1509380112. Epub 2015 Jul 23.

Optogenetic determination of the myocardial requirements for extrasystoles by cell type-specific targeting of ChannelRhodopsin-2

Affiliations

Optogenetic determination of the myocardial requirements for extrasystoles by cell type-specific targeting of ChannelRhodopsin-2

Tania Zaglia et al. Proc Natl Acad Sci U S A..

Abstract

Extrasystoles lead to several consequences, ranging from uneventful palpitations to lethal ventricular arrhythmias, in the presence of pathologies, such as myocardial ischemia. The role of working versus conducting cardiomyocytes, as well as the tissue requirements (minimal cell number) for the generation of extrasystoles, and the properties leading ectopies to become arrhythmia triggers (topology), in the normal and diseased heart, have not been determined directly in vivo. Here, we used optogenetics in transgenic mice expressing ChannelRhodopsin-2 selectively in either cardiomyocytes or the conduction system to achieve cell type-specific, noninvasive control of heart activity with high spatial and temporal resolution. By combining measurement of optogenetic tissue activation in vivo and epicardial voltage mapping in Langendorff-perfused hearts, we demonstrated that focal ectopies require, in the normal mouse heart, the simultaneous depolarization of at least 1,300-1,800 working cardiomyocytes or 90-160 Purkinje fibers. The optogenetic assay identified specific areas in the heart that were highly susceptible to forming extrasystolic foci, and such properties were correlated to the local organization of the Purkinje fiber network, which was imaged in three dimensions using optical projection tomography. Interestingly, during the acute phase of myocardial ischemia, focal ectopies arising from this location, and including both Purkinje fibers and the surrounding working cardiomyocytes, have the highest propensity to trigger sustained arrhythmias. In conclusion, we used cell-specific optogenetics to determine with high spatial resolution and cell type specificity the requirements for the generation of extrasystoles and the factors causing ectopies to be arrhythmia triggers during myocardial ischemia.

Keywords: Purkinje fiber; arrhythmia; cardiac ectopies; heart; optogenetics.


Conflict of interest statement

The authors declare no conflict of interest.

Figures
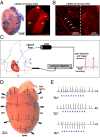
Fig. 1.
Fig. 1.
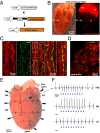
Cardiac optogenetics allows noninvasive investigation of heart electrophysiology in vivo. (A) Bright field (Left) and fluorescence (Right) images of α-MyHC-tdTomato-ChR2 heart. TheRight image oftdTomato fluorescence shows expression of ChR2 in both the atria and the ventricles. LA, left atrium; LV, left ventricle; RA, right atrium; RV, right ventricle. (Scale bar, 1.5 mm.) (B) Confocal image of ventricular cryosections from α-MyHC-tdTomato-ChR2 transgenic hearts showing ChR2 localization at the level of cardiomyocyte sarcolemma (white arrows) and t-tubuli. (Scale bar, 20 μm; high magnification, 5 μm.) (C) Representation of the setup used for epicardial photostimulation in open-chest anesthetized mice. LED stimulation occurred through fiber optics delivering time-controlled pulses of 470 nm blue light. The LED was connected to the ECG apparatus, allowing synchronization of the LED stimulation with a specific time point of the ECG recording. (D andE) Representative ECG traces of ectopic beats originated by epicardial light stimulation of different regions of the myocardium from α-MyHC-ChR2 mice (n = 10 mice). Blue arrows inD andE indicate light pulses. LA, RV, and LV photostimulation originates ectopic beats with different QRS shape.
Fig. S1.
Fig. S1.
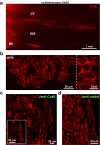
Tissue-specific expression of ChR2 in the heart by using the cre-lox genetic system. (A) Transgenic mice expressing cre-recombinase under the control of the cardiomyocyte-specific promoter α-MyHC were crossed with B6.Cg-Gt (ROSA) 26Sortm27.1(CAG-COP4*H134R/tdTomato)Hze/J. The resulting offspring had the STOP cassette deleted in cardiomyocytes, driving the expression of the hChR2 (H134R)-tdTomato fusion protein. (B) Confocal image analysis of atrial cryosections from control (Left) and α-MyHC-ChR2 transgenic mice (Right panels). (Scale bar, 30 μm.) (C) Hematoxylin/eosin staining on ventricular cryosections from control (Top panel) and α-MyHC-ChR2 transgenic mice (Bottom panel), showing no significant alterations in myocardial histology in ChR2-expressing hearts. (Scale bar, 50 μm.) (D) Evaluation of heart rate (in bpm) (Left panel) and QRS interval (in ms,Right panel) in control (black bars) and α-MyHC-ChR2 transgenic mice (white bars). Bars represent SEM (NS, not significant;n = 10 mice for each group).
Fig. 2.
Fig. 2.
Optogenetics-based investigation of heart electrophysiology ex vivo. (A) Activation map of one photostimulation pulse on the RV. The dashed line indicates the stimulation fiber position. (Scale bar, 0.5 cm; color bar in ms.) (B) Example of monophasic potential (MAP) signal during photostimulation. (C) Optical mapping (Vm) of one light pulse. The fiber position is represented in the first snapshot by the gray dashed line. All propagations showing snapshots are separated in time by 2 ms. (Scale bar, 0.5 cm.) The asterisk shows the MAP electrode position. (D–F) Optical measurement of photostimulation and spread of activation in a Langendorff-perfused intact mouse heart. (D) Intensity distribution of photostimulation using an optical fiber (OF; diameter, 0.4 mm). The position of the fiber tip is indicated by the gray-shaded rectangle. The isochrones indicate the relative intensity (colors of the isochrones correspond to the color bar). LV, left ventricle; RV, right ventricle. (E) Cross-section of the intensity distribution. The intensity profile is given along the blue line shown in theInset. (F) Activation map showing the propagation of wave fronts following photostimulation.
Fig. S2.
Fig. S2.
Ex vivo photostimulation of α-MyHC-ChR2 hearts. Shown is the percentage of successful coupling on the LVs (Left panel) and RVs (Right panel) at different stimulation frequencies and with different-sized fibers (200 μm, green; 400 μm, black; and 800 μm, red).
Fig. 3.
Fig. 3.
Direct optogenetic assessment of Purkinje fiber function in vivo. (A) Scheme of the generation of the transgenic mouse expressing the fused proteintdTomato-ChR2 under the control of the Cx40 promoter (Cx40-ChR2). (B) Bright field (Left) and fluorescence (Right) images of a longitudinally sectioned whole Cx40-ChR2 heart. TheRight image shows specific expression of ChR2 in the atria and the conduction system. LA, left atrium; LV, left ventricle; RA, right atrium; RV, right ventricle. (Scale bar, 1.5 mm.) (C andD) Confocal immunofluorescence analysis on ventricular (C) and atrial (D) cryosections from red fluorescent Cx40-ChR2 mice stained with an antibody specific for Cx40 (green signal). [Scale bars, (C) 30 μm, and high magnifications, 10 μm; (D) 15 μm.] (E andF) Representative ECG traces of ectopic beats originated by epicardial photostimulation of different regions of the myocardium from Cx40-ChR2 mice (n = 8 mice). Blue arrows indicate light pulses. RV and interventricular septum photostimulation originates ectopic beats with different QRS shapes in all mice, whereas LV epicardial stimulation always failed to induce ectopies.
Fig. S3.
Fig. S3.
Selective expression of ChR2 in conducting cardiomyocytes. (A) Hearts from a Cx40-ChR2 transgenic mouse were cut longitudinally, and slices were analyzed at the fluorescence stereomicroscope. The image evidences the presence of ChR2-expressing bundles in the interventricular septum, as well as in the RV subendocardium. ChR2-positive fibers can be detected in the LV wall. (Scale bar, 1 mm.) (B) Confocal image analysis of atrial cryosections from Cx40-ChR2 transgenic mice. (Scale bar, 20 μm; high magnification, 5 μm.) (C) Confocal immunofluorescence analysis on ventricular cryosections from a α-MyHC-ChR2 transgenic mouse stained with an antibody to Cx40. The red signal is the fluorescence oftd-Tomato-ChR2–expressing cells. The green signal, indicating the expression of Cx40, is specifically restricted to the subendocardial layers of Purkinje fibers. (Scale bar, 30μm; high magnification, 50 μm.) (D) Confocal immunofluorescence analysis on ventricular cryosections from a α-MyHC-ChR2 transgenic mouse stained with a 488-conjugated anti-rabbit secondary antibody. The red signal is the fluorescence oftd-Tomato-ChR2–expressing cells. The absence of the green signal indicates no specific staining of the secondary antibody. (Scale bar, 50 μm.)
Fig. S4.
Fig. S4.
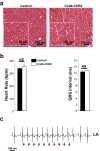
ChR2 expression in the cardiac conduction system does not affect heart morphology and function. (A) Hematoxylin/eosin staining on ventricular cryosections from control (Left panel) and Cx40-ChR2 transgenic mice (Right panel). (Scale bar, 100 μm; high magnifications, 50 μm.) (B) Evaluation of heart rate (in bpm) (Left panel) and QRS interval (in ms,Right panel) in control (white bars) and Cx40-ChR2 transgenic mice (black bars). Bars represent SEM (NS, not significant;n = 8 mice for each group). (C) Representative ECG trace of ectopic beats originated by epicardial light stimulation (10 Hz) of the LA from Cx40-ChR2 mice (n = 8 mice). Blue arrows indicate light pulses (5 ms).
Fig. 4.
Fig. 4.
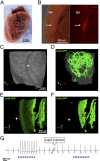
Correlation between distribution and function of the Purkinje fiber network in the RV. (A) RV epicardial surface from a whole Cx40-ChR2 heart. The black box indicates the RV region with the highest responsiveness to photostimulation. (Scale bar, 2 mm.) (B) Bright field (Left) and fluorescence (Right) images of the RV section at the anatomical level enclosed in the black box inA. (Scale bar, 500 μm.) (C–F) 3D reconstruction of the RV Purkinje fiber arborization obtained in Cx40-GFP transgenic mice by optical projection tomography. Rotation of the 3D reconstructed image (see coordinates in the panel corner) (E andF) highlights the connecting bundle between the septal and the RV branches of PF. (G) Representative ECG traces of ectopic beats originated by epicardial light stimulation of the RV from Cx40-ChR2 mice before and after (15 min) RV intracavital Lugol’s solution injection (n = 5 mice). Blue arrows indicate the light pulses. Lugol’s solution treatment caused enlargement of the QRS complex and abolished light-induced ectopies in all mice analyzed.
Fig. 5.
Fig. 5.
Optogenetics allows selective interrogation of Purkinje fiber electrophysiology in vivo. (A) Stimulation rate/cardiac capture relationship obtained in α-MyHC-ChR2 and Cx40-ChR2 mice. Bars represent SEM (*P < 0.05, **P < 0.01;n = 5 mice for each group). (B) Optical programmed stimulation using the extrastimulus (S1 and S2) protocol to measure the ERP. Blue arrows indicate the light pulses. (C) Evaluation of the ERP in the RV of both α-MyHC-ChR2 (gray bar) and Cx40-ChR2 (black bar) mice. Bars represent SEM (**P < 0.01;n = 10 α-MyHC-ChR2 mice andn = 5 Cx40-ChR2 mice).
Fig. 6.
Fig. 6.
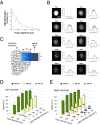
Optogenetic assay of the minimal myocardial volume required to trigger focal ectopic beats in the normal myocardium. (A) Measure of 470 nm light penetrance into the ventricular myocardium upon epicardial illumination. Experimental data were fitted to a monoexponential decay function (R2 > 0.9) (57), shown with a solid line. Bars represent SEM (n = 10). (B) Images of the optical fiber’s light beam, as emerging from myocardial slices of incremental thickness. For each image the beam intensity profile is shown; the red bar indicates the diameter of the optical fiber. (C) Modulation of light intensity and fiber diameter shapes the depth (h) and width (d), respectively, of the illuminated myocardial cylinder. (D andE) Optogenetic assay of minimal myocardial volume required for successful trigger of ectopies in the LV (D) and RV (E). The red circle in the columns inE indicates the percentage of successfully captured beats after Purkinje fiber ablation with Lugol’s solution. Black arrows inD andE indicate the liminal tissue volume to be irradiated to evoke ectopic beats. Red arrow inE indicates the liminal tissue volume after Lugol’s solution injection in the RV. Bars represent SEM (measures repeated in triplicate, inn = 10 mice).
Fig. S5.
Fig. S5.
Estimation of the shape of the light penetrating the myocardial tissue. Three dimensional projection of serial images of the shape of the light emitted by a 200-μm optical fiber, generated by a 470-nm LED, as it emerges from myocardial slices of different thickness; above each image, the thickness of the myocardial slice is shown. Dashed lines highlight the reference shape of the optical fiber (fiber diameter) used to illuminate the slices.
Fig. S6.
Fig. S6.
Left descending coronary artery ligation in α-MyHC-ChR2 mice. (A) Image of a whole heart from a α-MyHC-ChR2 that had undergone LAD coronary artery ligation and subsequent i.v. injection of Evans Blue to identify the ischemic pale area. White arrow indicates the coronary ligation. LV, left ventricle; RV, right ventricle. (Scale bar, 1 mm.) (B) Representative ECG traces from a α-MyHC-ChR2 transgenic mouse at baseline and 5 and 30 min after LAD ligation. ECG recording evidences alterations of the QRS complex upon ischemia, which are absent in sham-operated mice at the same time point.
Fig. 7.
Fig. 7.
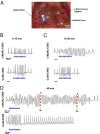
Induction of sustained ventricular arrhythmias by optical stimulation in the advanced postischemic phase. (A) Photograph of the optogenetic experiment, picturing the heart of the anesthetized mouse, seen through the toracotomic window, during delivery of a light pulse to the RV epicardium via the optical fiber. The white arrowhead shows the heart region described in Fig. 4C–F. (B) Representative ECG traces of RV photostimulation during the first 15 min after LAD ligation in α-MyHC-ChR2 (Top) and Cx40-ChR2 (Bottom) hearts (n = 10 and 8 mice, respectively). (C) Representative ECG trace recorded between 15 and 30 min after LAD ligation in α-MyHC-ChR2 (Top) mice. Photostimulation of the origin of the RVOT induced episodes of unsustained polymorphic VT. TheBottom panel shows a representative ECG trace recorded between 15 and 30 min after LAD ligation in Cx40-ChR2 mice. Blue arrows indicate the light pulses. (D) TheTop panel shows a representative ECG trace of sustained arrhythmias originated by light stimulation of the RV, at the site indicated above and described in Fig. 4C–F, in α-MyHC-ChR2 mice during postischemic phase 2. Sustained arrhythmias were induced in 8 out of 10 mice. The same photostimulation protocol failed to trigger sustained arrhythmias in Cx40-ChR2 mice (n = 8 mice) (Bottom panel). Blue arrows indicate the light pulses.
See this image and copyright information in PMC

Similar articles

See all similar articles

Cited by

See all "Cited by" articles

References

    1. Sedmera D, Gourdie RG. Why do we have Purkinje fibers deep in our heart? Physiol Res. 2014;63(Suppl 1):S9–S18. - PubMed
    1. Hoyt RH, Cohen ML, Saffitz JE. Distribution and three-dimensional structure of intercellular junctions in canine myocardium. Circ Res. 1989;64(3):563–574. - PubMed
    1. Rohr S, Kucera JP, Fast VG, Kléber AG. Paradoxical improvement of impulse conduction in cardiac tissue by partial cellular uncoupling. Science. 1997;275(5301):841–844. - PubMed
    1. Xie Y, Sato D, Garfinkel A, Qu Z, Weiss JN. So little source, so much sink: Requirements for afterdepolarizations to propagate in tissue. Biophys J. 2010;99(5):1408–1415. - PMC - PubMed
    1. Myles RC, Wang L, Kang C, Bers DM, Ripplinger CM. Local β-adrenergic stimulation overcomes source-sink mismatch to generate focal arrhythmia. Circ Res. 2012;110(11):1454–1464. - PMC - PubMed

Publication types

MeSH terms

Substances

Related information

Grants and funding

LinkOut - more resources

Full text links
Atypon full text link Atypon Free PMC article
Cite
Send To

NCBI Literature Resources

MeSHPMCBookshelfDisclaimer

The PubMed wordmark and PubMed logo are registered trademarks of the U.S. Department of Health and Human Services (HHS). Unauthorized use of these marks is strictly prohibited.


[8]ページ先頭

©2009-2025 Movatter.jp