First-in-human trial of a novel suprachoroidal retinal prosthesis
- PMID:25521292
- PMCID: PMC4270734
- DOI: 10.1371/journal.pone.0115239
First-in-human trial of a novel suprachoroidal retinal prosthesis
Abstract
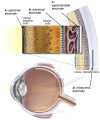
Retinal visual prostheses ("bionic eyes") have the potential to restore vision to blind or profoundly vision-impaired patients. The medical bionic technology used to design, manufacture and implant such prostheses is still in its relative infancy, with various technologies and surgical approaches being evaluated. We hypothesised that a suprachoroidal implant location (between the sclera and choroid of the eye) would provide significant surgical and safety benefits for patients, allowing them to maintain preoperative residual vision as well as gaining prosthetic vision input from the device. This report details the first-in-human Phase 1 trial to investigate the use of retinal implants in the suprachoroidal space in three human subjects with end-stage retinitis pigmentosa. The success of the suprachoroidal surgical approach and its associated safety benefits, coupled with twelve-month post-operative efficacy data, holds promise for the field of vision restoration.
Trial registration: Clinicaltrials.govNCT01603576.
Conflict of interest statement
Figures


Similar articles
- Factors affecting perceptual thresholds in a suprachoroidal retinal prosthesis.Shivdasani MN, Sinclair NC, Dimitrov PN, Varsamidis M, Ayton LN, Luu CD, Perera T, McDermott HJ, Blamey PJ; Bionic Vision Australia Consortium.Shivdasani MN, et al.Invest Ophthalmol Vis Sci. 2014 Sep 9;55(10):6467-81. doi: 10.1167/iovs.14-14396.Invest Ophthalmol Vis Sci. 2014.PMID:25205858Clinical Trial.
- Progress in artificial vision through suprachoroidal retinal implants.Bareket L, Barriga-Rivera A, Zapf MP, Lovell NH, Suaning GJ.Bareket L, et al.J Neural Eng. 2017 Aug;14(4):045002. doi: 10.1088/1741-2552/aa6cbb.J Neural Eng. 2017.PMID:28541930Review.
- Optical coherence tomography-guided retinal prosthesis design: model of degenerated retinal curvature and thickness for patient-specific devices.Opie NL, Ayton LN, Apollo NV, Ganesan K, Guymer RH, Luu CD.Opie NL, et al.Artif Organs. 2014 Jun;38(6):E82-94. doi: 10.1111/aor.12287. Epub 2014 Apr 1.Artif Organs. 2014.PMID:24689741
- Vision function testing for a suprachoroidal retinal prosthesis: effects of image filtering.Barnes N, Scott AF, Lieby P, Petoe MA, McCarthy C, Stacey A, Ayton LN, Sinclair NC, Shivdasani MN, Lovell NH, McDermott HJ, Walker JG.Barnes N, et al.J Neural Eng. 2016 Jun;13(3):036013. doi: 10.1088/1741-2560/13/3/036013. Epub 2016 Apr 25.J Neural Eng. 2016.PMID:27108845
- The potential of the second sight system bionic eye implant for partial sight restoration.Luo YH, Fukushige E, Da Cruz L.Luo YH, et al.Expert Rev Med Devices. 2016 Jul;13(7):673-81. doi: 10.1080/17434440.2016.1195257. Epub 2016 Jun 22.Expert Rev Med Devices. 2016.PMID:27247995Review.
Cited by
- Testing of Newly Developed Wide-Field Dual-Array Suprachoroidal-Transretinal Stimulation Prosthesis in Dogs.Morimoto T, Fujikado T, Kanda H, Miyoshi T, Endo T, Nishida K, Kishima H, Saito T, Ito K, Ozawa M, Nishida K.Morimoto T, et al.Transl Vis Sci Technol. 2021 Mar 1;10(3):13. doi: 10.1167/tvst.10.3.13.Transl Vis Sci Technol. 2021.PMID:34003947Free PMC article.
- Potential therapeutic strategies for photoreceptor degeneration: the path to restore vision.Karamali F, Behtaj S, Babaei-Abraki S, Hadady H, Atefi A, Savoj S, Soroushzadeh S, Najafian S, Nasr Esfahani MH, Klassen H.Karamali F, et al.J Transl Med. 2022 Dec 7;20(1):572. doi: 10.1186/s12967-022-03738-4.J Transl Med. 2022.PMID:36476500Free PMC article.Review.
- Properties of Retinal Precursor Cells Grown on Vertically Aligned Multiwalled Carbon Nanotubes Generated for the Modification of Retinal Implant-Embedded Microelectrode Arrays.Johnen S, Meißner F, Krug M, Baltz T, Endler I, Mokwa W, Walter P.Johnen S, et al.J Ophthalmol. 2016;2016:2371021. doi: 10.1155/2016/2371021. Epub 2016 Apr 21.J Ophthalmol. 2016.PMID:27200182Free PMC article.
- Bioengineering strategies for restoring vision.Cehajic-Kapetanovic J, Singh MS, Zrenner E, MacLaren RE.Cehajic-Kapetanovic J, et al.Nat Biomed Eng. 2023 Apr;7(4):387-404. doi: 10.1038/s41551-021-00836-4. Epub 2022 Jan 31.Nat Biomed Eng. 2023.PMID:35102278Review.
- Retinal Prosthetic Approaches to Enhance Visual Perception for Blind Patients.Shim S, Eom K, Jeong J, Kim SJ.Shim S, et al.Micromachines (Basel). 2020 May 24;11(5):535. doi: 10.3390/mi11050535.Micromachines (Basel). 2020.PMID:32456341Free PMC article.Review.
References
- Chader GJ, Weiland J, Humayun MS (2009) Artificial vision: needs, functioning, and testing of a retinal electronic prosthesis. Prog Brain Res 175:317–332. - PubMed
- Pascolini D, Mariotti SP (2012) Global estimates of visual impairment: 2010. Br J Ophthalmol 96:614–618. - PubMed
- Zrenner E (2013) Fighting blindness with microelectronics. Sci Transl Med 5:210ps216. - PubMed
- Shepherd RK, Shivdasani MN, Nayagam DA, Williams CE, Blamey PJ (2013) Visual prostheses for the blind. Trends Biotechnol 31:562–571. - PubMed
Publication types
MeSH terms
Associated data
Related information
Grants and funding
LinkOut - more resources
Full Text Sources
Other Literature Sources
