Movatterモバイル変換


[0]ホーム

URL:


Skip to main page content
U.S. flag

An official website of the United States government

Dot gov

The .gov means it’s official.
Federal government websites often end in .gov or .mil. Before sharing sensitive information, make sure you’re on a federal government site.

Https

The site is secure.
Thehttps:// ensures that you are connecting to the official website and that any information you provide is encrypted and transmitted securely.

NIH NLM Logo
Log inShow account info
Access keysNCBI HomepageMyNCBI HomepageMain ContentMain Navigation
pubmed logo
Advanced Clipboard
User Guide

Full text links

Public Library of Science full text link Public Library of Science Free PMC article
Full text links

Actions

Share

doi: 10.1371/journal.pone.0053998. Epub 2013 Jan 16.

The evaporative function of cockroach hygroreceptors

Affiliations

The evaporative function of cockroach hygroreceptors

Harald Tichy et al. PLoS One.2013.

Abstract

Insect hygroreceptors associate as antagonistic pairs of a moist cell and a dry cell together with a cold cell in small cuticular sensilla on the antennae. The mechanisms by which the atmospheric humidity stimulates the hygroreceptive cells remain elusive. Three models for humidity transduction have been proposed in which hygroreceptors operate either as mechanical hygrometers, evaporation detectors or psychrometers. Mechanical hygrometers are assumed to respond to the relative humidity, evaporation detectors to the saturation deficit and psychrometers to the temperature depression (the difference between wet-bulb and dry-bulb temperatures). The models refer to different ways of expressing humidity. This also means, however, that at different temperatures these different types of hygroreceptors indicate very different humidity conditions. The present study tested the adequacy of the three models on the cockroach's moist and dry cells by determining whether the specific predictions about the temperature-dependence of the humidity responses are indeed observed. While in previous studies stimulation consisted of rapid step-like humidity changes, here we changed humidity slowly and continuously up and down in a sinusoidal fashion. The low rates of change made it possible to measure instantaneous humidity values based on UV-absorption and to assign these values to the hygroreceptive sensillum. The moist cell fitted neither the mechanical hygrometer nor the evaporation detector model: the temperature dependence of its humidity responses could not be attributed to relative humidity or to saturation deficit, respectively. The psychrometer model, however, was verified by the close relationships of the moist cell's response with the wet-bulb temperature and the dry cell's response with the dry-bulb temperature. Thus, the hygroreceptors respond to evaporation and the resulting cooling due to the wetness or dryness of the air. The drier the ambient air (absolutely) and the higher the temperature, the greater the evaporative temperature depression and the power to desiccate.


Conflict of interest statement

Competing Interests:The authors declare that no conflicts and competing interests exist.

Figures

Figure 1
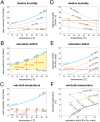
Figure 1. Calculated relationships between the key parameters of humidity and atmospheric temperature.
A. Relationship between vapor pressure, relative humidity and temperature. The relative humidity is the ratio of vapor pressure and saturation vapor pressure times 100. As the saturation vapor pressure increases with rising temperature, the relative humidity decreases when the vapor pressure is constant.B. Relationship between vapor pressure, saturation deficit and temperature. The saturation deficit is the difference between vapor pressure and saturation vapor pressure and shows the amount of water vapor required for saturation at different temperatures. As the saturation vapor pressure increases with rising temperature, the saturation deficit increases when the vapor pressure is constant.C. Relationship between vapor pressure, wet-bulb temperature and dry-bulb temperature, which is the atmospheric temperature. Temperature depression is the difference between wet-bulb and dry-bulb temperature. As the saturation vapor pressure increases with rising temperature, the wet-bulb temperature as well as the temperature depression increases when the vapor pressure is constant.D. Relationship between relative humidity, vapor pressure and temperature.E. Relationship between saturation deficit, vapor pressure and temperature.F. Relationship between wet-bulb temperature, vapor pressure and saturation deficit. At constant vapor pressure (orange line), both the wet-bulb temperature and the saturation deficit increases with rising (dry-bulb) temperature.Pw water vapor pressure,Ps saturation water vapor pressure,rH relative humidity,SD saturation deficit,dry T dry-bulb temperature,wet T wet-bulb temperature.
Figure 2
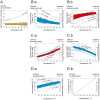
Figure 2. Effects of atmospheric temperature on the hygroreceptors responses as predicted by the three humidity transduction models.
A. Humidity stimulation consists of constant amplitude oscillating change in vapor pressure, illustrated by the orange zone.Ba. The constant amplitude oscillating change in vapor pressure inA produces, with rising temperature, continuously deceasing oscillations in relative humidity (left axis), illustrated by the blue zone. Impulse frequency of a moist cell responding to oscillations in relative humidity is predicted to oscillate within blue zone (right axis).Bb. Same plot as inBa but with turned y-axis (left axis) to illustrate the relative humidity stimulus eliciting excitatory responses in a dry cell. Impulse frequency of a dry cell responding to oscillations in relative humidity is proposed to oscillate within red zone (right axis).Ca. Constant amplitude oscillating change in vapor pressure inA produces, with rising temperature, continuously increasing oscillations in saturation deficit (left axis), illustrated by the red zone. Impulse frequency of a dry cell responding to oscillations in saturation deficit is predicted to oscillate within red zone (right axis).Cb. Same plot as inCa but with turned y-axis (left axis) to illustrate the saturation deficit stimulus eliciting excitatory responses in a moist cell. Impulse frequency of a moist cell responding to oscillations in saturation deficit is predicted to oscillate within blue zone (right axis).Da. Constant amplitude oscillating change in vapor pressure inA produces, with rising temperature, continuously increasing oscillations in wet-bulb temperature (left axis), illustrated by the blue zone. Impulse frequency of a moist cell responding to oscillations in wet-bulb temperature is predicted to oscillate within blue zone (right axis).Db. Dry-bulb temperature as function of air temperature. Impulse frequency of a dry cell responding to the dry-bulb temperature is predicted to increase with rising temperature (right axis).Pw water vapor pressure,Ps saturation water vapor pressure.Arrows point in the direction of increasing axis values.
Figure 3
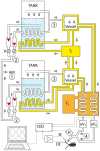
Figure 3. Delivery system for sinusoidal humidity modulation.
Compressed air was divided at1 into two air streams to be set at different water vapor pressure values. Each stream was further split into two substreams (at2) and their flow rates adjusted by needle valves (V) and monitored continuously by flow meters (F) before passing through atank of water at constant depth and temperature (42°C). One substream bubbled out through many holes in a polyethylene tubing in a tank of ion-exchange water at constant 42°C. Temperature was controlled by thermostat 1 (T1). The second substream was conducted through the spiral tube in the same tank but remained dry when it was also warmed to 42°C. After emerging from the tank, the two substreams were combined in a single stream (at3) variable in water vapor content from dry to almost saturated. Homogeneity of mixture was enhanced by a 2-l series connectedvessel. Water-jacket insulation is shown. The temperature of the two air streams was then set at given temperature levels by driving them through a thermostatically controlled heat exchanger (T2). After passing through electrical proportional valves (eV1, eV2), the air streams were combined to a single stream (at4). The vapor pressure of his stream was sinusoidally modulated by mixing the two streams in a ratio determined by the proportional valves by means of the output sequencer function of the data acquisition software (Spike2; Cambridge Electronic Design,CED, Cambridge, UK). By 180° phase shifting of the control voltages of the electrical proportional valves, the flow rate of the combined air stream was held constant. The antenna was placed at the outlet of the stimulus air stream, the recording or different electrode (DE) inserted at the base of the hygroreceptive sensillum and the reference or indifferent electrode (IE) into the tip of the antenna. Humidity stimulation was measured by a UV-absorption hygrometer (H).
Figure 4
Figure 4. Simultaneously recorded activity of a moist cell, a dry cell and a cold cell.
A. Scanning electron micrograph of the distal margin of a ring-shaped segment from the middle antennal region of the male cockroach showing location and external features of the hygro-thermoreceptive sensillum (arrow).B. Time course of humidity; oscillation in the relative humidity produced by oscillating changes in vapor pressure at 20.2°C.C. Action potentials recorded by inserting an electrode into the sensillum base.D. Responses of the moist cell, the dry cell and the cold cell classified off-line by the spike detecting and template matching systems of the Spike2 software (Cambridge Electronic Design, UK) and represented as raster plots.Ea. Detail of the recording inC showing action potentials of the 3 cells;b. Classified action potentials, obtained by matching the shape of each action potential against shape templates. The medium-sized impulses are produced by the moist cell, the small impulse amplitudes by the dry cell and the large impulses by the cold cell.F. Template windows showing the template boundaries of the spike waveforms from the 3 cells.Pw water vapor pressure,rH relative humidity.
Figure 5
Figure 5. Humidity stimulation expressed as vapour pressure.
Impulse frequency of a moist cell and a dry cell located in the same sensillum during three consecutive oscillations in vapor pressure as a function of instantaneous vapor pressure and its rate of change. Multiple regressions which utilize three-dimensional planes [F = yo+aPw/Δt)+bPw; whereF is the impulse frequency andyo is the intercept of the regression plane with theF axis reflecting the height of the regression plane] were calculated to determine the gain of the responses for the instantaneous vapor pressure (b-slope) and its rate of change (a-slope). Impulse frequency of the moist cell increases linearly with rising instantaneous vapor pressure and its rate of change, in the dry cell with falling instantaneous vapor pressure and its rate of change.R2, coefficient of determination; the number of points per plot is 130.Arrows point in the direction of increasing axis values.F impulse frequency,Pw water vapor pressure.
Figure 6
Figure 6. Humidity stimulation expressed as water vapour pressure.
Plots of the time course of impulse frequency of a moist cell and a dry cell from the same sensillum during oscillating changes in vapor pressure at different temperature levels. With rising temperature, the oscillations in impulse frequency of the moist and dry cells shift upwards on the frequency scale.
Figure 7
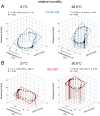
Figure 7. Humidity stimulation expressed as relative humidity.
Impulse frequency of a moist cell (A) and a dry cell (B) from the same sensillum during oscillating changes in relative humidity at two different temperatures, plotted as function of instantaneous relative humidity and the rate with which the relative humidity changes. Regression planes [F = yo+arH/Δt)+b rH; whereF is the impulse frequency andyo is the intercept of the regression plane with theF axis reflecting is the height of the regression plane] were utilized to determine the gain values for instantaneous relative humidity (b-slope) and its rate of change (a-slope). Impulse frequency of the moist cell (A) increases linearly with rising instantaneous relative humidity and its rate of change, in the dry cell (B) with falling instantaneous relative humidity and its rate of change.R2, coefficient of determination; the number of points per plot was 60.Arrows point in the direction of increasing axis values.F impulse frequency,rH relative humidity.
Figure 8
Figure 8. Humidity stimulation expressed as relative humidity.
Effect of temperature on the 3 parameters of the regression plane utilized to determine the response characteristic of the moist cell and the dry cell to oscillating changes in relative humidity.Aa andBa.yo intercept of the regression plane with theF axis reflecting the height of the regression plane plotted as function of temperature.Ab andBb. Gain for the rate of change of the relative humidity plotted as function of temperature.Ac andBc: Gain for the instantaneous relative humidity plotted as function of temperature. Relationships approximated by quadratic regressions [f = yo+aT+aT2].R2, coefficient of determination; the number of points per plot was 30.Arrows point in the direction of increasing axis values.F impulse frequency,rH relative humidity.
Figure 9
Figure 9. Humidity stimulation expressed as saturation deficit.
Impulse frequency of the moist cell (A) and the dry cell (B) of Fig. 7 during oscillating changes in saturation deficit at two different temperatures, plotted as function of instantaneous saturation deficit and the rate with which the saturation deficit changes. Regression planes [F = yo+aSD/Δt)+b SD; whereF is the impulse frequency andyo is the intercept of the regression plane with theF axis reflecting the height of the regression plane] were utilized to determine the gain values for the instantaneous saturation deficit (b-slope) and its rate of change (a-slope). Impulse frequency of the moist cell (A) increases linearly with rising instantaneous saturation deficit and its rate of change, in the dry cell (B) with falling instantaneous saturation deficit and its rate of change.R2, coefficient of determination; the number of points per plot was 60.Arrows point in the direction of increasing axis values.F impulse frequency,SD saturation deficit.
Figure 10
Figure 10. Humidity stimulation expressed as saturation deficit.
Effect of temperature on the parameters of the regression plane utilized to determine the response characteristic of the moist cell (A) and the dry cell (B) to oscillating changes in the saturation deficit.Aa andBa:yo intercept of the regression plane with theF axis reflecting the height of the regression plane plotted as function of temperature.Ab andBb. Gain for the rate of change of the saturation deficit plotted as function of temperature.Ac andBc. Gain for the instantaneous saturation deficit plotted as function of temperature. Relationships approximated by linear regressions [f = yo+aT].R2, coefficient of determination; the number of points per plot was 30.Arrows point in the direction of increasing axis values.F impulse frequency,SD saturation deficit.
Figure 11
Figure 11. Humidity stimulation based on the wet- and dry-bulb principle.
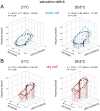
A. Impulse frequency of the moist cell (A) and the dry cell (B) of Fig. 7 during oscillating changes in the wet-bulb temperature at two different temperatures, plotted as function of instantaneous wet-bulb temperature and the rate with which the wet-bulb temperature changes. Regression planes [F = yo+aTwet/Δt)+b Twet; whereF is the impulse frequency andyo is the intercept of the regression plane with theF axis reflecting the height of the regression plane] were utilized to determine the gain values for the instantaneous wet-bulb temperature (b-slope) and its rate of change (a-slope). Impulse frequency of the moist cell increases linearly with rising instantaneous wet-bulb temperature and its rate of change.B. Impulse frequency of the dry cell of Fig. 7B as function of the dry-bulb temperature (air temperature) during oscillating changes in the wet-bulb temperature at 4 different temperatures. Relationship approximated by linear regression [f = yo+aT]. Resolving power of impulse frequency for dry-bulb temperature (the number of discrete steps which impulse frequency can distinguish within the temperature range). The band width is determined by means and standard deviations of the responses to the dry-bulb temperature when testing the effect of oscillating changes in the wet-bulb temperature. The band enables 5 steps to be distinguished.R2, coefficient of determination; the number of points per plot inA was 30, inB,5.Arrows point in the direction of increasing axis values.F impulse frequency,Twet wet-bulb temperature,Tdry dry-bulb temperature.
Figure 12
Figure 12. Humidity stimulation based on the wet-bulb principle.
Effect of temperature on the parameters of the regression plane utilized to determine the response characteristic of the moist cell to oscillating changes in the wet-bulb temperature.a.yo intercept of the regression plane with theF axis reflecting the height of the regression plane plotted as function of the temperature level.b. Gain for the rate of change of the wet-bulb temperature plotted as function of temperature.c. Gain for the instantaneous wet-bulb temperature plotted as function of temperature. Relationships approximated by linear regressions [f = yo+aT].R2, coefficient of determination; the number of points per plot was 30.
Figure 13
Figure 13. Humidity stimulation based on the dry-bulb principle.
Impulse frequency of the dry cell of Fig. 7B as function of the dry-bulb temperature (atmospheric temperature) during oscillating changes in the wet-bulb temperature at different temperatures levels. Relationship approximated by linear regression [f = yo+aT]. Resolving power of impulse frequency for dry-bulb temperature (the number of discrete steps which impulse frequency can distinguish within the temperature range). The band encloses all responses throughout the range and enables 4 steps to be distinguished.R2, coefficient of determination; the number of points was 30.F impulse frequency.
Figure 14
Figure 14. Summary of the electrophysiological analysis of the adequacy of the three humidity transduction models.
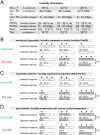
Analysis is based on the specific predictions drawn from each of the models by determining the effect of three temperature levels on the responses of the moist and dry cells to oscillating changes in vapor pressure expressed as oscillation in relative humidity, saturation deficit or wet-bulb temperature. +,++and+++stand for categories of increasing response magnitude predicted by the models. Obtained response ranges of each cell are normalized to its response calculated for 30°C.A. Humidity stimulation.B. In the mechanical hygrometer swelling and shrinking of a hygroscopic sensillum wall due to changes in the relative humidity governs the response of the moist and dry cells.C. In the evaporation detector, humidity affects the lymph concentration outside the dendrites of the moist and dry cells, involving the saturation deficit.D. In the psychrometer, activity of the moist cell is initiated by evaporative cooling and actiovity of the dry cell by the temperature.Asterisks indicate correspondence between predicted and obtained responses.Pw water vapor pressure,Ps saturation water vapor pressure,Pw/Ps relative humidity,Ps-Pw saturation deficit,T temperature,dry T dry-bulb temperature,wet T wet-bulb temperature.
See this image and copyright information in PMC

Similar articles

See all similar articles

Cited by

See all "Cited by" articles

References

    1. Altner H, Schaller-Selzer L, Stetter H, Wohlrab I (1983) Poreless sensilla with inflexible socket. Cell Tissue Res 234: 279–307. - PubMed
    1. Altner H, Loftus R (1985) Ultrastructure and function of insect thermo- and hygroreceptors. Annu Rev Entomol 30: 273–295.
    1. Steinbrecht RA (1999) Bimodal thermo- and hygrosensitive sensilla. In: Harrison FW, Locke M, editors. Microscopic Anatomy of Invertebrates, Wiley-Liss, New York: 405–422.
    1. Tichy H, Loftus R (1996) Hygroreceptors in insects and a spider: humidity transduction models. Naturwissenschaften 83: 255–263.
    1. Yokohari F (1999) Hygro- and thermoreceptors. In: Eguchi E, Tominaga Y, editors. Atlas of Arthropod Sensory Receptors. Springer, Berlin Heidelberg New York, 191–210.

Publication types

MeSH terms

Grants and funding

LinkOut - more resources

Full text links
Public Library of Science full text link Public Library of Science Free PMC article
Cite
Send To

NCBI Literature Resources

MeSHPMCBookshelfDisclaimer

The PubMed wordmark and PubMed logo are registered trademarks of the U.S. Department of Health and Human Services (HHS). Unauthorized use of these marks is strictly prohibited.


[8]ページ先頭

©2009-2025 Movatter.jp