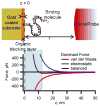
High density single-molecule-bead arrays for parallel single molecule force spectroscopy
- PMID:22548234
- PMCID: PMC3389265
- DOI: 10.1021/ac3001622
High density single-molecule-bead arrays for parallel single molecule force spectroscopy
Abstract
The assembly of a highly parallel force spectroscopy tool requires careful placement of single-molecule targets on the substrate and the deliberate manipulation of a multitude of force probes. Since the probe must approach the target biomolecule for covalent attachment, while avoiding irreversible adhesion to the substrate, the use of polymer microspheres as force probes to create the tethered bead array poses a problem. Therefore, the interactions between the force probe and the surface must be repulsive at very short distances (<5 nm) and attractive at long distances. To achieve this balance, the chemistry of the substrate, force probe, and solution must be tailored to control the probe-surface interactions. In addition to an appropriately designed chemistry, it is necessary to control the surface density of the target molecule in order to ensure that only one molecule is interrogated by a single force probe. We used gold-thiol chemistry to control both the substrate's surface chemistry and the spacing of the studied molecules, through binding of the thiol-terminated DNA and an inert thiol forming a blocking layer. For our single molecule array, we modeled the forces between the probe and the substrate using DLVO theory and measured their magnitude and direction with colloidal probe microscopy. The practicality of each system was tested using a probe binding assay to evaluate the proportion of the beads remaining adhered to the surface after application of force. We have translated the results specific for our system to general guiding principles for preparation of tethered bead arrays and demonstrated the ability of this system to produce a high yield of active force spectroscopy probes in a microwell substrate. This study outlines the characteristics of the chemistry needed to create such a force spectroscopy array.
Figures


Similar articles
- Stable immobilization of an oligonucleotide probe on a gold substrate using tripodal thiol derivatives.Sakata T, Maruyama S, Ueda A, Otsuka H, Miyahara Y.Sakata T, et al.Langmuir. 2007 Feb 27;23(5):2269-72. doi: 10.1021/la0616193. Epub 2007 Feb 2.Langmuir. 2007.PMID:17269799
- Automated bead alignment apparatus using a single bead capturing technique for fabrication of a miniaturized bead-based DNA probe array.Noda H, Kohara Y, Okano K, Kambara H.Noda H, et al.Anal Chem. 2003 Jul 1;75(13):3250-5. doi: 10.1021/ac020674n.Anal Chem. 2003.PMID:12964776
- Single-molecule protein arrays enabled by scanning probe block copolymer lithography.Chai J, Wong LS, Giam L, Mirkin CA.Chai J, et al.Proc Natl Acad Sci U S A. 2011 Dec 6;108(49):19521-5. doi: 10.1073/pnas.1116099108. Epub 2011 Nov 21.Proc Natl Acad Sci U S A. 2011.PMID:22106270Free PMC article.
- Molecular Tension Probes for Imaging Forces at the Cell Surface.Liu Y, Galior K, Ma VP, Salaita K.Liu Y, et al.Acc Chem Res. 2017 Dec 19;50(12):2915-2924. doi: 10.1021/acs.accounts.7b00305. Epub 2017 Nov 21.Acc Chem Res. 2017.PMID:29160067Free PMC article.Review.
- Strategies in the preparation of DNA oligonucleotide arrays for diagnostic applications.Beaucage SL.Beaucage SL.Curr Med Chem. 2001 Aug;8(10):1213-44. doi: 10.2174/0929867013372463.Curr Med Chem. 2001.PMID:11472237Review.
Cited by
- Unraveling protein-protein interactions in clathrin assemblies via atomic force spectroscopy.Jin AJ, Lafer EM, Peng JQ, Smith PD, Nossal R.Jin AJ, et al.Methods. 2013 Mar;59(3):316-27. doi: 10.1016/j.ymeth.2012.12.006. Epub 2012 Dec 25.Methods. 2013.PMID:23270814Free PMC article.
- Progress toward the application of molecular force spectroscopy to DNA sequencing.Cheng P, Oliver PM, Barrett MJ, Vezenov D.Cheng P, et al.Electrophoresis. 2012 Dec;33(23):3497-505. doi: 10.1002/elps.201200351.Electrophoresis. 2012.PMID:23161379Free PMC article.
References
- Mukhopadhyay R. Analytical Chemistry. 2009;81:1736. - PubMed
- Fuller CW, Middendorf LR, Benner SA, Church GM, Harris T, Huang X, Jovanovich SB, Nelson JR, Schloss JA, Schwartz DC, Vezenov DV. Nat Biotechnol. 2009;27:1013. - PubMed
- Song L, Ahn S, Walt DR. Analytical Chemistry. 2006;78:1023. - PubMed
- Nelson PC, Zurla C, Brogioli D, Beausang JF, Finzi L, Dunlap D. The Journal of Physical Chemistry B. 2006;110:17260. - PubMed
Publication types
MeSH terms
Substances
Related information
Grants and funding
LinkOut - more resources
Full Text Sources
Other Literature Sources
