Movatterモバイル変換


[0]ホーム

URL:


Skip to main page content
U.S. flag

An official website of the United States government

Dot gov

The .gov means it’s official.
Federal government websites often end in .gov or .mil. Before sharing sensitive information, make sure you’re on a federal government site.

Https

The site is secure.
Thehttps:// ensures that you are connecting to the official website and that any information you provide is encrypted and transmitted securely.

NIH NLM Logo
Log inShow account info
Access keysNCBI HomepageMyNCBI HomepageMain ContentMain Navigation
pubmed logo
Advanced Clipboard
User Guide

Full text links

Public Library of Science full text link Public Library of Science Free PMC article
Full text links

Actions

Share

.2012 Feb;10(2):e1001259.
doi: 10.1371/journal.pbio.1001259. Epub 2012 Feb 14.

Astrocytes mediate in vivo cholinergic-induced synaptic plasticity

Affiliations

Astrocytes mediate in vivo cholinergic-induced synaptic plasticity

Marta Navarrete et al. PLoS Biol.2012 Feb.

Abstract

Long-term potentiation (LTP) of synaptic transmission represents the cellular basis of learning and memory. Astrocytes have been shown to regulate synaptic transmission and plasticity. However, their involvement in specific physiological processes that induce LTP in vivo remains unknown. Here we show that in vivo cholinergic activity evoked by sensory stimulation or electrical stimulation of the septal nucleus increases Ca²⁺ in hippocampal astrocytes and induces LTP of CA3-CA1 synapses, which requires cholinergic muscarinic (mAChR) and metabotropic glutamate receptor (mGluR) activation. Stimulation of cholinergic pathways in hippocampal slices evokes astrocyte Ca²⁺ elevations, postsynaptic depolarizations of CA1 pyramidal neurons, and LTP of transmitter release at single CA3-CA1 synapses. Like in vivo, these effects are mediated by mAChRs, and this cholinergic-induced LTP (c-LTP) also involves mGluR activation. Astrocyte Ca²⁺ elevations and LTP are absent in IP₃R2 knock-out mice. Downregulating astrocyte Ca²⁺ signal by loading astrocytes with BAPTA or GDPβS also prevents LTP, which is restored by simultaneous astrocyte Ca²⁺ uncaging and postsynaptic depolarization. Therefore, cholinergic-induced LTP requires astrocyte Ca²⁺ elevations, which stimulate astrocyte glutamate release that activates mGluRs. The cholinergic-induced LTP results from the temporal coincidence of the postsynaptic activity and the astrocyte Ca²⁺ signal simultaneously evoked by cholinergic activity. Therefore, the astrocyte Ca²⁺ signal is necessary for cholinergic-induced synaptic plasticity, indicating that astrocytes are directly involved in brain storage information.


Conflict of interest statement

The authors have declared that no competing interests exist.

Figures
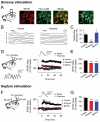
Figure 1
Figure 1. Cholinergic activity induces astrocyte Ca2+ elevations and LTP in CA3-CA1 synapses in the hippocampus in vivo.
(A) Schematic drawing of the experimental approach used to monitor Ca2+ levels in hippocampal astrocytes in vivo; representative images of astrocytes labeled with sulforhodamine 101 (SR101) and loaded with Fluo-4-AM; corresponding merge image; and image of Fluo-4-loaded astrocytes displaying regions of interests. Scale bar, 20 µm. (B) Fluorescence traces of Ca2+ levels in regions of interests in astrocytes showed in (A) evoked by tail pinch sensory stimulation (horizontal bars) in control and in the presence of atropine. (C) Proportion of astrocytes responding to sensory stimulation in control (66 astrocytes fromn = 8 rats), atropine (32 astrocytes fromn = 4 rats), and MCPG (15 astrocytes fromn = 3 rats). (D) Schematic drawing of the in vivo experimental approach showing the stimulating electrode in the Schaffer collaterals (SC) and the extracellular recording electrode of fEPSPs placed in the hippocampal CA1 region, and a representative trace of a field potential showing hippocampal theta rhythm activity (bottom) during tail pinch sensory stimulation. Right, Relative fEPSP slope (from basal values) versus time. Zero time corresponds to the onset of stimulation (as in all other figures). Inset: mean fEPSPs before and 60 min after stimulation. (E) Average relative changes of fEPSP evoked 60 min after sensory stimulation in control (n = 7), atropine (n = 6), and MCPG (n = 6). (F) Schematic drawing showing the additional stimulating electrode in the medial septum nucleus. Right, Relative fEPSP slope (from basal values) versus time. Zero time corresponds to the onset of stimulation that lasted 90.7 s (horizontal bar). Inset: mean fEPSPs before and 60 min after septum stimulation. (G) Average relative changes of fEPSP evoked 60 min after stimulation in control (n = 9), atropine (n = 6), and MCPG (n = 6). ***p<0.001. Data are presented as means ± s.e.m (as in all other figures).
Figure 2
Figure 2. Cholinergic activity in hippocampal slices induces astrocyte Ca2+ elevations and LTP in CA3-CA1 synapses.
(A) Schematic drawing showing the stimulating electrodes (alveus and SC) and the whole-cell recording electrode (CA1 pyramidal neuron) in hippocampal slices, and a representative postsynaptic response (bottom) to one train of alveus TBS (action potentials evoked by TBS were truncated). (B) Pseudocolor images representing fluorescence intensities of fluo-4-filled astrocytes before and during alveus stimulation. Scale bar, 40 µm. (C) Astrocyte Ca2+ spike probability versus time. (D) Average relative changes of maximum astrocyte Ca2+ spike probability (from basal values) during alveus stimulation in control (132 astrocytes fromn = 13 slices), atropine (94 astrocytes fromn = 10 slices), and MCPG (71 astrocytes fromn = 7 slices). (E) Mean EPSCs before and 60 min after alveus stimulation. (F) Relative EPSC amplitudes (from basal values) versus time. (G) Average relative changes of EPSC amplitudes evoked 60 min after stimulation in control (n = 13), atropine (n = 10), and MCPG (n = 12). In (C) and (F), zero time corresponds to the onset of stimulation that lasted 90.7 s (horizontal bars). *p<0.05, ***p<0.001. Data are presented as means ± s.e.m.
Figure 3
Figure 3. Cholinergic-induced hippocampal LTP requires astrocyte Ca2+ elevations.
(A) Fluorescence image showing dialysis of sulforhodamine B into the astrocytic network after loading a single astrocyte with the dye (1 mg/ml) through the whole-cell recording pipette. Scale bar, 40 µm. (B) Schematic drawing depicting BAPTA or GDPβS dialysis into the astrocytic network from the recorded astrocyte. (C) Pseudocolor images representing fluorescence intensities of fluo-4- and BAPTA-filled astrocytes before (basal) and during alveus stimulation. Scale bar, 20 µm. (D) Astrocyte Ca2+ spike probability in control, BAPTA-, and GDPβS-loaded astrocytes. (E) Average relative changes of maximum astrocyte Ca2+ spike probability (from basal values) during alveus stimulation in control (100 astrocytes fromn = 11 slices), BAPTA- (96 astrocytes fromn = 10 slices), and GDPβS-loaded astrocytes (76 astrocytes fromn = 10 slices). (F) Mean EPSCs (n = 10 consecutive EPSCs) before and 60 min after alveus TBS in a slice with BAPTA-loaded astrocytes. (G) Relative EPSC amplitudes versus time in control and BAPTA- and GDPβS-loaded astrocytes. (H) Average relative changes of EPSC amplitudes evoked 60 min after alveus TBS in control (n = 8), BAPTA- (n = 7), and GDPβS-loaded astrocytes (n = 5). In (D) and (G), zero time corresponds to the onset of stimulation that lasted 90.7 s (horizontal bars). **p<0.01, ***p<0.001. Data are presented as means ± s.e.m.
Figure 4
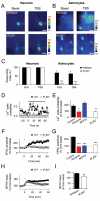
Figure 4. Cholinergic-induced hippocampal LTP is altered in IP3R2−/− mice.
(A) Pseudocolor images representing fluorescence intensities of pyramidal neurons filled with fuo-4 through the recording pipette before (basal) and during alveus TBS in wildtype (top) and IP3R2−/− mice (bottom). Scale bar, 20 µm. (B) Pseudocolor images representing fluorescence intensities of fluo-4-filled astrocytes before (basal) and during alveus TBS in wildtype (top) and IP3R2−/− mice (bottom). Scale bar, 15 µm. (C) Proportion of responding neurons and astrocytes to ACh application and alveus TBS in wildtype and IP3R2−/− mice (6 and 10 neurons fromn = 6 and 10 slices for each stimulus in wildtype and IP3R2−/− mice, respectively; for ACh: 111 and 157 astrocytes fromn = 6 and 15 slices; for TBS: 81 and 64 astrocytes fromn = 9 and 10 slices, in wildtype and IP3R2−/− mice, respectively). (D) Astrocyte Ca2+ spike probability in wildtype and IP3R2−/− mice (81 and 64 astrocytes fromn = 9 and 10 slices, respectively). (E) Average relative changes of maximum astrocyte Ca2+ spike probability (from basal values) during alveus stimulation in control (81 astrocytes fromn = 9 slices), atropine (25 astrocytes fromn = 4 slices), and MCPG (40 astrocytes fromn = 5 slices) in wildtype mice and control IP3R2−/− mice (64 astrocytes fromn = 10 slices). (F) Relative EPSC amplitudes versus time in slices from wildtype (n = 8) and IP3R2−/− (n = 8) mice. (G) Average relative changes of EPSC amplitudes evoked 60 min after alveus TBS in slices from wildtype mice in control (n = 8), atropine (n = 4), and MCPG (n = 5), and from IP3R2−/− mice (n = 8). (H) Relative mean fEPSP slope versus time inin vivo wildtype (n = 6) and IP3R2−/− mice (n = 4) before and after sensory stimulation. (I) Average relative changes of the mean fEPSP slope evoked 60 min after sensory stimulation in wildtype (n = 6) and IP3R2−/− mice (n = 6). In (D), (F), and (H), zero time corresponds to the onset of stimulation (horizontal bars). *p<0.05, **p<0.01, ***p<0.001.
Figure 5
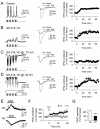
Figure 5. Cholinergic-induced hippocampal LTP depends on mild postsynaptic depolarizations.
(A) Left, CA1 pyramidal neuron response to a train of alveus TBS recorded in current-clamp conditions. Center, mean EPSCs (n = 10 consecutive EPSCs) before and 60 min after alveus TBS. Right, relative EPSC amplitudes versus time (n = 6). Zero time corresponds to the onset of alveus TBS that lasted 90.7 s (horizontal bar). (B, C, and D) as in (A), but in QX-314-loaded neuron recorded in current-clamp conditions (n = 7), in voltage-clamp conditions at a holding potential of −70 mV (n = 5) and −30 mV (n = 5), respectively. (E) Representative neuronal responses to application of ACh in current- (CC) and voltage-clamp (VC) conditions at a holding potential of −70 mV. (F) Relative EPSC amplitudes versus time in CC and VC before and after ACh application (arrow). (G) Average relative changes of EPSC amplitudes evoked 60 min after ACh application in CC and VC (n = 10 and 10, respectively). ***p<0.001.
Figure 6
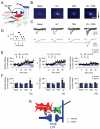
Figure 6. Astrocyte Ca2+ elevations induce LTP of transmitter release at single hippocampal synapses.
(A) Schematic drawing depicting simultaneous recordings from one pyramidal neuron, one astrocyte filled with NP-EGTA and GDPβS filling the astrocytic network, and the stimulating electrode. (B) Pseudocolor images representing fluorescence intensity of a NP-EGTA- and fluo-4-filled astrocyte before (basal) and during UV-flash astrocyte stimulation, alveus TBS, and pairing both stimuli. Scale bar, 20 µm. (C) Synaptic responses (10 consecutive stimuli; top traces) and corresponding average EPSCs (bottom traces) obtained from paired whole-cell recordings before (basal) and 20 min after UV-flash astrocyte stimulation, alveus TBS, and pairing both stimuli. (D) Representative transient increase of the probability of neurotransmitter release (Pr) (bin width, 0.5 min) evoked by UV-flash astrocyte stimulation in a single synapse. Zero time corresponds to the time of UV stimulation. (E) Relative changes in synaptic efficacy (i.e., mean amplitude of responses including successes and failures of neurotransmission), probability of neurotransmitter release (Pr), and synaptic potency (i.e., mean EPSC amplitude excluding failures) (bin width, 2 min) over time evoked by UV-flash astrocyte stimulation, alveus TBS, and pairing both stimuli in control (n = 9) and MCPG (n = 6). (F) Relative changes of synaptic parameters evoked 20–30 min after UV-flash astrocyte stimulation, alveus TBS, and pairing both stimuli in control and MCPG (n = 9 and 6 astrocyte-neuron pairs, respectively). **p<0.01, ***p<0.001. (G) Schematic drawing representing the astrocyte-mediated cholinergic-induced LTP. Cholinergic axons simultaneously activate AChRs in pyramidal neurons and astrocytes. Consequent astrocyte Ca2+ elevations stimulate glutamate (Glu) release that increases transmitter release probability through presynaptic mGluR activation. The temporal coincidence of astrocyte and postsynaptic activities simultaneously evoked by cholinergic activity induces long-term changes in synaptic efficacy.
See this image and copyright information in PMC

Comment in

Similar articles

See all similar articles

Cited by

See all "Cited by" articles

References

    1. Eroglu C, Barres B. A. Regulation of synaptic connectivity by glia. Nature. 2010;468:223–231. - PMC - PubMed
    1. Halassa M. M, Haydon P. G. Integrated brain circuits: astrocytic networks modulate neuronal activity and behavior. Annu Rev Physiol. 2010;72:335–355. - PMC - PubMed
    1. Perea G, Navarrete M, Araque A. Tripartite synapses: astrocytes process and control synaptic information. Trends Neurosci. 2009;32:421–431. - PubMed
    1. Volterra A, Meldolesi J. Astrocytes, from brain glue to communication elements: the revolution continues. Nat Rev Neurosci. 2005;6:626–640. - PubMed
    1. Di Castro M. A, Chuquet J, Liaudet N, Bhaukaurally K, Santello M, Bouvier D, Tiret P, Volterra A. Local Ca(2+) detection and modulation of synaptic release by astrocytes. Nat Neurosci. 2011;14:1276–1284. - PubMed

Publication types

MeSH terms

Substances

Related information

LinkOut - more resources

Full text links
Public Library of Science full text link Public Library of Science Free PMC article
Cite
Send To

NCBI Literature Resources

MeSHPMCBookshelfDisclaimer

The PubMed wordmark and PubMed logo are registered trademarks of the U.S. Department of Health and Human Services (HHS). Unauthorized use of these marks is strictly prohibited.


[8]ページ先頭

©2009-2025 Movatter.jp