Movatterモバイル変換


[0]ホーム

URL:


Skip to main page content
U.S. flag

An official website of the United States government

Dot gov

The .gov means it’s official.
Federal government websites often end in .gov or .mil. Before sharing sensitive information, make sure you’re on a federal government site.

Https

The site is secure.
Thehttps:// ensures that you are connecting to the official website and that any information you provide is encrypted and transmitted securely.

NIH NLM Logo
Log inShow account info
Access keysNCBI HomepageMyNCBI HomepageMain ContentMain Navigation
pubmed logo
Advanced Clipboard
User Guide

Full text links

Frontiers Media SA full text link Frontiers Media SA Free PMC article
Full text links

Actions

Share

.2011 Dec 22:5:85.
doi: 10.3389/fnint.2011.00085. eCollection 2011.

Cortical correlates of fitts' law

Affiliations

Cortical correlates of fitts' law

Peter J Ifft et al. Front Integr Neurosci..

Abstract

Fitts' law describes the fundamental trade-off between movement accuracy and speed: it states that the duration of reaching movements is a function of target size (TS) and distance. While Fitts' law has been extensively studied in ergonomics and has guided the design of human-computer interfaces, there have been few studies on its neuronal correlates. To elucidate sensorimotor cortical activity underlying Fitts' law, we implanted two monkeys with multielectrode arrays in the primary motor (M1) and primary somatosensory (S1) cortices. The monkeys performed reaches with a joystick-controlled cursor toward targets of different size. The reaction time (RT), movement time, and movement velocity changed with TS, and M1 and S1 activity reflected these changes. Moreover, modifications of cortical activity could not be explained by changes of movement parameters alone, but required TS as an additional parameter. Neuronal representation of TS was especially prominent during the early RT period where it influenced the slope of the firing rate rise preceding movement initiation. During the movement period, cortical activity was correlated with movement velocity. Neural decoders were applied to simultaneously decode TS and motor parameters from cortical modulations. We suggest that sensorimotor cortex activity reflects the characteristics of both the movement and the target. Classifiers that extract these parameters from cortical ensembles could improve neuroprosthetic control.

Keywords: Fitts’ law; brain–machine interface; decision making; motor cortex; neurophysiology; neuroprosthetics; sensorimotor transformation; somatosensory cortex.


Figures
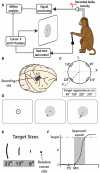
Figure 1
Figure 1
Implantation and experimental protocol.(A) Rhesus monkeys controlled the location of a cursor on a display screen by moving a joystick with their left hand. Joystick kinematics as well as the neural activity were recorded and analyzed offline.(B) 4 × 4 Grids of 16 electrode triplets were implanted bilaterally in M1 and S1 arm and leg regions, however only the right hemisphere arm region of M1 and S1 was recorded from in this study.(C) For each trial, the cursor was to move along the radial origin-to-target axis (X′) toward one of four potential target locations.(D) Left to right-typical trial begins with cursor moved within the target at center of screen. After hold period, penalty ring, and target arc appear. The cursor is then moved radially through the target arc to receive a reward.(E) Three potential target sizes are shown with respect to the cursor, for size reference.(F) An example of a single trial movement trace is shown. Target onset (TO) and movement onset (MO) are denoted on time axis. The approach epoch that was used in later analysis spanned from movement onset to target acquisition.
Figure 2
Figure 2
Distribution of reaction times was computed for each movement direction by monkey N (A) and monkey M (B) with probability “P” shown as a function of RT. A Kruskal–Wallis test was performed for each direction to determine significance of target size on distribution of reaction times (see Table 1).(C) Reaction time for trials of the three different indices of difficulty (ID) was fit with linear function and tested for significance usingF test. Means for each ID plotted as filled circles (monkey M) and open circles (monkey N). The target size of the trial is denoted by colors specified below(A,B).(D) Movement time for the three ID conditions. A regression line was used to fit all trials and the subsequent inverse of slope yields index of performance (IP) in bits per second. Significance was tested in same way as in(C). All error bars indicate SE.
Figure 3
Figure 3
Reach kinematics reflect differences in target size.(A,B) Averaged position traces of monkey N and monkey M along theX′ axis from 0 (the origin) to 4 (the target, denoted by dashed line). The target size of the trial is denoted by colors specified in(A).(C,D) Distribution of mean approach velocity for each of the four movement directions with probability (P) shown as a function of mean approach velocity. For each direction, a Kruskal–Wallis test was performed to evaluate the effect of target size;p-values shown for each direction separately (see Table 1).
Figure 4
Figure 4
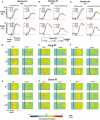
Effect of reaction time on firing rate profiles.(A–C) Averaged and normalized firing rate across all recorded M1 cells in monkey N, M1 cells in monkey M, and S1 cells in monkey M. For each four-axis panel, the left column denotes movements in preferred direction of each neuron and right column shows the least preferred direction. The upper and lower rows represent the averaged and normalized PETH across long and short reaction time trials, respectively. Target size specified by line color [(see legend below(B)]. Slopes in spk/s2 computed from regression of normalized firing rate during analysis interval (gray box, see Materials and Methods).(D–F) Population PETH showing normalized firing rate profiles on long reaction time trials for all cells (ordinate) over time (abscissa) relative to target onset (denoted by vertical black bar) from M1 of monkey N(D), M1 of monkey M(E), and S1 of monkey M(F). For each, the most preferred (left) and least preferred direction (right) are compared.(G–I) Same as(D–F) with PETH showing firing rate profiles during the short reaction time trials. Color of pixel represents normalized firing rate (z-score, see Materials and Methods). Scale of axis in(A–C) narrower than in(D–I) due to averaging across M1 or S1 populations reducing the amplitude of PETH profile compared to single cell activity levels.
Figure 5
Figure 5
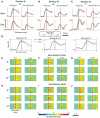
Effect of velocity on firing rate profiles. The normalized firing rate was computed during the 1-s interval surrounding movement onset from three subpopulations of neurons:(A) M1 neurons in monkey N,(B) M1 neurons in Monkey M,(C) S1 neurons in Monkey M. In each panel, the left column represents averaged, normalized FR for movements in each cell’s preferred direction, right column the least preferred direction. The top row is averaged over all trials slower than the median approach epoch velocity and the bottom row shows only fast trials. Target size specified by line color [see legend below(B)]. (D) Same data from(A–C) collapsed into simply a comparison of slow vs. fast trial average PSTH for each of the three cell groups. Population PSTH for slow(E–G) and fast(H–J) trial averages. In each panel:Y axis contains all neurons,X axis represents time aligned on movement onset (black bar). Color of pixel represents normalized firing rate (z-score, see Materials and Methods).
Figure 6
Figure 6
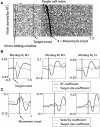
Multiple linear regression analysis of target size, reaction time, and velocity with firing rate over task interval.(A) Firing rates were estimated using a 50-ms sliding window slid with 50 ms time steps in the interval from 0.5 s before target onset until 1.5 s after target onset. The firing rate of a single cell in the window was fit with a linear function of the corresponding trial RT and target size and then averaged across all cells (see Eq. 4, in Materials and Methods).(B) Data showing the coefficient for RT and target size of Eq. 4 as a function of location of sliding window right-most bound in monkey N M1, monkey M M1, and monkey M S1 (left to right). Vertical line represents target onset.(C) Firing rates were fit with linear function of mean approach velocity and target size of each trial (Eq. 5, in Materials and Methods). Methods for(C) same as shown in(A), except data realigned on movement onset (dashed line) and sliding window range from 1 s before to 1 s after movement onset.
Figure 7
Figure 7
Movement kinematics can be decoded from neural activity.(A,B) Movements along theX axis andY axis decoded offline and shown with the actual traces.(C,D) AverageX′ vs. time profile for the two velocity groups, both actual (solid lines) and predicted (dashed lines). (E,F) ActualX′ position vs. time for each target size, in both monkeys(E) compared with predictedX′ trace for each target size(F). Shown separately for clarity, however SNR computed by comparing actual and predicted for a given target size. In all predictedX′ trajectories, the single trial kinematics were predicted then averaged across the session to generate the traces in panels(C–F).
Figure 8
Figure 8
Velocity, target size, and reaction time predicted using linear discriminant analysis. Each parameter was divided into three groups for analysis. Data for each prediction collected from a single bin, 100 ms sliding window of neuronal data incremented at 25 ms through the specified interval. Data denote normalized fraction correct by dividing the fraction correct prediction by the chance level performance (see Materials and Methods).(A–C) Prediction of the three parameters aligned on target onset (dashed vertical line) for monkey N M1(A), monkey M M1(B), and monkey M S1(C). Noted on each is the mean time of movement onset (μMO) with the mean ± SD denoted by smaller black vertical bars on time axis.(D–F) Prediction of the three parameters now aligned on movement onset (dashed vertical line). Each panel shown with 95% confidence interval for expected LDA classification performance (gray horizontal band).
See this image and copyright information in PMC

Similar articles

See all similar articles

Cited by

See all "Cited by" articles

References

    1. Alexander G. E., Crutcher M. D. (1990). Neural representations of the target (goal) of visually guided arm movements in three motor areas of the monkey. J. Neurophysiol. 64, 164–178 - PubMed
    1. Andersen R. A., Cui H. (2009). Intention, action planning, and decision making in parietal-frontal circuits. Neuron 63, 568–58310.1016/j.neuron.2009.08.028 - DOI - PubMed
    1. Ashe J., Georgopoulos A. P. (1994). Movement parameters and neural activity in motor cortex and area 5. Cereb. Cortex 4, 590–60010.1093/cercor/4.6.590 - DOI - PubMed
    1. Awiszus F. (1997). Spike train analysis. J. Neurosci. Methods 74, 155–16610.1016/S0165-0270(96)02246-7 - DOI - PubMed
    1. Bohan M., Longstaff M. G., Van Gemmert A. W., Rand M. K., Stelmach G. E. (2003). Effects of target height and width on 2D pointing movement duration and kinematics. Motor Control 7, 278–289 - PubMed

Related information

Grants and funding

LinkOut - more resources

Full text links
Frontiers Media SA full text link Frontiers Media SA Free PMC article
Cite
Send To

NCBI Literature Resources

MeSHPMCBookshelfDisclaimer

The PubMed wordmark and PubMed logo are registered trademarks of the U.S. Department of Health and Human Services (HHS). Unauthorized use of these marks is strictly prohibited.


[8]ページ先頭

©2009-2025 Movatter.jp