Movatterモバイル変換


[0]ホーム

URL:


Skip to main page content
U.S. flag

An official website of the United States government

Dot gov

The .gov means it’s official.
Federal government websites often end in .gov or .mil. Before sharing sensitive information, make sure you’re on a federal government site.

Https

The site is secure.
Thehttps:// ensures that you are connecting to the official website and that any information you provide is encrypted and transmitted securely.

NIH NLM Logo
Log inShow account info
Access keysNCBI HomepageMyNCBI HomepageMain ContentMain Navigation
pubmed logo
Advanced Clipboard
User Guide

Full text links

BioMed Central full text link BioMed Central Free PMC article
Full text links

Actions

.2011 Feb 15:11:46.
doi: 10.1186/1471-2148-11-46.

Tracing the legacy of the early Hainan Islanders--a perspective from mitochondrial DNA

Affiliations

Tracing the legacy of the early Hainan Islanders--a perspective from mitochondrial DNA

Min-Sheng Peng et al. BMC Evol Biol..

Abstract

Background: Hainan Island is located around the conjunction of East Asia and Southeast Asia, and during the Last Glacial Maximum (LGM) was connected with the mainland. This provided an opportunity for the colonization of Hainan Island by modern human in the Upper Pleistocene. Whether the ancient dispersal left any footprints in the contemporary gene pool of Hainan islanders is debatable.

Results: We collected samples from 285 Li individuals and analyzed mitochondrial DNA (mtDNA) variations of hypervariable sequence I and II (HVS-I and II), as well as partial coding regions. By incorporating previously reported data, the phylogeny of Hainan islanders was reconstructed. We found that Hainan islanders showed a close relationship with the populations in mainland southern China, especially from Guangxi. Haplotype sharing analyses suggested that the recent gene flow from the mainland might play important roles in shaping the maternal pool of Hainan islanders. More importantly, haplogroups M12, M7e, and M7c1* might represent the genetic relics of the ancient population that populated this region; thus, 14 representative complete mtDNA genomes were further sequenced.

Conclusions: The detailed phylogeographic analyses of haplogroups M12, M7e, and M7c1* indicated that the early peopling of Hainan Island by modern human could be traced back to the early Holocene and/or even the late Upper Pleistocene, around 7-27 kya. These results correspond to both Y-chromosome and archaeological studies.


Figures

Figure 1
Figure 1
Map of Hainan Island and its surrounding regions, showing elevation relative to modern sea level. Map outline was kindly provided by YT. Yao, CAS Key Laboratory of Marginal Sea Geology, South China Sea Institute of Oceanology, Guangzhou [3].
Figure 2
Figure 2
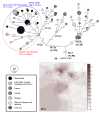
Tree drawn from a median-joining network of 180 mtDNA haplotypes observed in Hainan Island. mtDNA motifs of HVS-I (16080-16488) combined with HVS-II and/or certain coding region sites were considered to improve the resolution of the tree which was constructed manually and checked by using the Network 4.510. The circles represent mtDNA sequence types, shaded according to population with an area proportional to their absolute frequency. The geographic sources of populations were also noted. These are transitions while suffixes A, C, G and T refer to transversions, "Y" specifies heteroplasmic status C/T at the site, and "@" means a reverse mutation. Seven haplotypes were determined as the existing of heteroplasmic sites.
Figure 3
Figure 3
Principle components analysis (PCA) of populations in southern China and Vietnam. The detailed information of 50 populations employed and their haplogroup profiles was indicated in Additional file 2 and 3.
Figure 4
Figure 4
Plot of the haplogroup contribution of the first and second PC. The contribution of each haplogroup was calculated as the factor scores for PC1 and PC2 with regression method (REGR) in SPSS13.0 software.
Figure 5
Figure 5
Reconstructed phylogenetic tree of 21 complete mtDNA genome sequences from haplogroups M12 and M7c'e. The six reported sequences were taken from the literature and were further labeled by the symbols MD [18], AC [39], QK1 [20], and QK2 [28] followed by "#", the geographic locations, and the sample codes or the access numbers in GenBank. One sequence (Accession No. EU294322) submitted by "Family Tree DNA" was retrieved from GenBank. Haplogroup age estimates (±standard errors) are indicated at the branch roots in terms of the calibrated mutation rate with symbols as SP [58] and LE [66], respectively. Mutations are transitions at the respective nucleotide position unless otherwise specified. Letters following positions indicate transversions. Recurrent mutations are underlined. +: insertion; d: deletion; @: back-mutation. "R" specifies heteroplasmic status A/G and was also noted in italic. Amino acid replacements are specified by single-letter code; s, synonymous replacements; t, change in transfer RNA; r, change in ribosomal RNA gene.
Figure 6
Figure 6
Median-joining network of HVS-I sequences of haplogroup M12 and the spatial frequency distribution. The circles represent mtDNA HVS-I (16090 - 16365) sequence types, shaded according to region with an area proportional to their absolute frequency which is also indicated by the number in the circle. Mutations are transitions unless the base change is explicitly indicated. Heteroplasmic positions are indicated by an "H" after the nucleotide positions. Some HVS-II sites were employed to improve the resolution and were noted in parentheses.
Figure 7
Figure 7
Median-joining network of HVS-I sequences of haplogroup M7e. The circles represent mtDNA HVS-I (16085 - 16365) sequence types, shaded according to region with an area proportional to their absolute frequency which is also indicated by the number in the circle. Mutations are transitions unless the base change is explicitly indicated. Heteroplasmic positions are indicated by an "H" after the nucleotide position.
See this image and copyright information in PMC

References

    1. Clark PU, Dyke AS, Shakun JD, Carlson AE, Clark J, Wohlfarth B, Mitrovica JX, Hostetler SW, McCabe AM. The Last Glacial Maximum. Science. 2009;325:710–714. doi: 10.1126/science.1172873. - DOI - PubMed
    1. Huang ZG, Zhang WQ, Chai FX, Xu QH. On the lowest sea level during the culmination of the lastest glacial period in South China. Acta Geogr Sin. 1995;50:385–393.
    1. Yao YT, Harff J, Meyer M, Zhan WH. Reconstruction of paleocoastlines for the northwestern South China Sea since the Last Glacial Maximum. Sci China Ser D-Earth Sci. 2009;52:1127–1136. doi: 10.1007/s11430-009-0098-8. - DOI
    1. Li D, Li H, Ou C, Lu Y, Sun Y, Yang B, Qin Z, Zhou Z, Li S, Jin L. Paternal genetic structure of Hainan aborigines isolated at the entrance to East Asia. PLoS ONE. 2008;14:e2168. doi: 10.1371/journal.pone.0002168. - DOI - PMC - PubMed
    1. Hao SD, Wang DX. Hainan archaeology: retrospect and prospect. Kaogu. 2003. pp. 291–299.

Publication types

MeSH terms

Substances

LinkOut - more resources

Full text links
BioMed Central full text link BioMed Central Free PMC article
Cite
Send To

NCBI Literature Resources

MeSHPMCBookshelfDisclaimer

The PubMed wordmark and PubMed logo are registered trademarks of the U.S. Department of Health and Human Services (HHS). Unauthorized use of these marks is strictly prohibited.


[8]ページ先頭

©2009-2025 Movatter.jp